Article Text

Abstract
Objective To determine the time to resolution of different-layered retinal haemorrhages (RHs), and to describe the main patterns of their resolution in a group of children with encephalopathies.
Methods and analysis From a prospective study of 114 children with traumatic and non-traumatic encephalopathies, 429 selected individual RHs (iRHs) from 18 children were serially imaged from admission using a RetCam. Photoshop and Scion Imaging software allowed calculation of RH area in pixels.
Results Two patterns of the resolution were recognised on the basis of area measurements: a progressive decrease (pattern A, 60% of iRHs), and a form of asymmetrical decay in which iRHs first increased in size before then progressively decreasing (pattern B, 35% of iRHs). Within the pattern A group, the Kaplan-Meier median survival time (MST) (95% CI) was 10 (9.3 to 10.7) days for intra-RHs (IRHs) and 38 (10.8 to 65.2) days for pre-RHs (PRHs), log rank (Mantel-Cox) p=0.001. The mean percentage reduction in area per day was 12.5% for all iRHs, 14.5% for IRHs and 6.3% for PRHs.
Conclusion Serial area measurements of iRHs revealed that 35% haemorrhages became temporarily larger before decreasing to resolution. Serially imaged selected RHs showed a longer MST for PRHs than for IRHs.
- child health (paediatrics)
- retina
- imaging
- trauma
This is an open access article distributed in accordance with the Creative Commons Attribution Non Commercial (CC BY-NC 4.0) license, which permits others to distribute, remix, adapt, build upon this work non-commercially, and license their derivative works on different terms, provided the original work is properly cited, appropriate credit is given, any changes made indicated, and the use is non-commercial. See: http://creativecommons.org/licenses/by-nc/4.0/.
Statistics from Altmetric.com
Key messages
What is already known about this subject?
Abusive head trauma (AHT) is generally associated with a greater number of retinal haemorrhages (RHs) than accidental traumatic brain injury.
Intra-RHs (IRHs) tend to resolve more quickly than pre-RHs (PRHs).
It is, therefore, conceivable that RHs may be dated from their pattern. Very numerous IRHs may indicate a recent injury, while the presence of PRHs in isolation may indicate an older injury.
What are the new findings?
While the number of RHs in each patient did not increase, serial measurement of the area of individual RHs showed that 35% haemorrhages initially increased in area, before decreasing to resolution.
How might these results change the focus of research or clinical practice?
These findings refine the retrospective timing of RHs based on haemorrhage area. This may have implications for clinical and medicolegal analysis of RHs in cases of suspected AHT.
Introduction
The number, type and distribution of retinal haemorrhages (RHs) form an important diagnostic characteristic in cases of suspected abusive head trauma (AHT). While in accidental traumatic brain injury (ATBI), the timing of the injury giving rise to the RHs is usually well known, almost all AHT cases are unwitnessed. The prospect of using the rate of RH resolution, with retrospective extrapolation, to time the antecedent trauma remains a challenge. Charting the same RH through time to a precise resolution date is one limiting factor.
The natural history of RHs has been reported from various methodologies (online supplementary table 1). Binenbaum1 has comprehensively reviewed the literature and has reported that ‘too numerous to count’ intra-RHs (IRHs) generally indicate a recent injury, while the presence of pre-RHs (PRHs) in isolation generally indicates an older injury.
Supplemental material
We aimed, in this prospective study of children with traumatic and non-traumatic encephalopathies, to determine, by serial imaging of selected individual RHs (iRHs) until they had macroscopically resolved, the time to resolution of the iRHs in different retinal zones and layers (calculated from haemorrhage numbers and surface area) occurring in different aetiologies. We also aimed to describe any novel patterns of resolution, which differed from the expected progressive diminution in size.
Patients and methods
This prospective observational retinal imaging study was conducted over a 7-year period on children with ATBI, AHT and non-traumatic encephalopathies (NTE).
A hand-held RetCam-I wide-field digital retinal camera (Natus Medical, Pleasanton, California, USA), with a 120o ‘children’s’ lens, was used throughout the study. A consistent set of retinal views, directing the camera centrally, superiorly, inferiorly, nasally and laterally to cover as much of the retina as possible, was used for each eye.2 All RetCam imaging for suspected AHT cases were conducted by a paediatric ophthalmologist after indirect ophthalmoscopy. Other cases were imaged by all the authors trained in this technique. About 68% of children had their first imaging session within 48 hours of admission to any hospital. When RHs were found, we aimed to perform daily imaging until all haemorrhages had resolved, but only while the patient was ventilated or anaesthetised.
All RetCam images were downloaded to a single off-line dedicated computer, (with Photoshop V.7.0 and Scion Image Analysis software) for morphometry and counting, without changing the format and ensuring consistent computer screen-resolution settings. Pixel counts were used to measure haemorrhage areas (1 pixel=0.0012443 cm2), for image analysis.
We selected 429 representative iRHs for detailed study and analysis, based on the following image requirements: a well-centred haemorrhage away from the image margin; not overlying another RH; representatives of different retinal zones, layers and aetiology; and the same haemorrhage visible on at least one further imaging session. The RetCam images were then saved as a greyscale tiff image, for Scion ‘density slicing’. Circumference and area measurements were achieved either semiautomatically for clear, well-circumscribed and non-overlapping haemorrhages, or by manually defining the circumference using the cursor of the computer (figure 1). Both methods were repeated three times, for each RH. IRH (dot-blot and flame haemorrhages) and PRH were differentiated by morphological appearance.

RetCam and Scion Image Analysis example. The infant sustained abusive head trauma, was aged 1.5 months, and had left subdural haemorrhage, interhemispheric blood, diffuse brain swelling, seizures, bruises on the face, a torn frenulum, rib fractures and bruising to the right wrist. The left eye on day 3 from admission is shown. (A) RetCam image; (B) From Scion Image Analysis, with green filter applied for greyscale image and (C) First selected haemorrhage ‘H1’ identified and circumference automatically outlined. The information box displays the automatic area measure in pixels. (D) Twenty-four selected haemorrhages outlined and identified by ID number. On successive imaging, the same ID number was used for each selected haemorrhage. ID, identification.
Statistical analysis
Statistical analyses were conducted using the IBM SPSS V.22 statistical package. The Student t-test was used to compare the area reduction (in pixels) between IRHs and PRHs. The Kaplan-Meier median survival time (MST) used the log rank (Mantel-Cox) test for significance.
Patient and public involvement
Patients or their families were not involved in the design or conduct of the study, other than by providing informed consent to participation.
Results
The study comprised 114 children (57 ATBI, 21 AHT and 36 NTE). Clinical details of the cohort have been previously published.2 There were 34 children with RHs, median age 5.85 months (range 0.01–176.45 months). A total of 3931 haemorrhages were present (including 2 cases with a total of 5 haemorrhages, identified only by indirect ophthalmoscopy). Details of the retinal imaging sessions used in the study are summarised in online supplementary table 2 and figure 2. From the 18 cases with serial imaging of iRHs available, we selected 429 (23.1%) RHs for study, which were equally divided between right and left eye, and comprised 38 PRHs, 386 IRHs (329 dot-blots and 57 flame-shaped) and 5 inadmissible RHs. Detailed RH counts in this study showed no increase in the number of RHs in any patient. The percentage of selected PRHs to the total number of counted PRHs in the study was 44.2%; and the percentage of selected IRHs to the total number of counted IRHs in the study was 13.1%, with 13.9% for selected dot-blot haemorrhages and 9.9% for selected flame-shaped haemorrhages. Additionally, of all 429 selected iRHs in this study, 20.5% were peripapillary, 42.7% were macular and the remainder, 36.8%, were in the periphery. AHT cases comprised 76.5% (328/429) RHs, ATBI 11.4% (49/429) RHs and NTE 12.1% (52/429) RHs.
Supplemental material
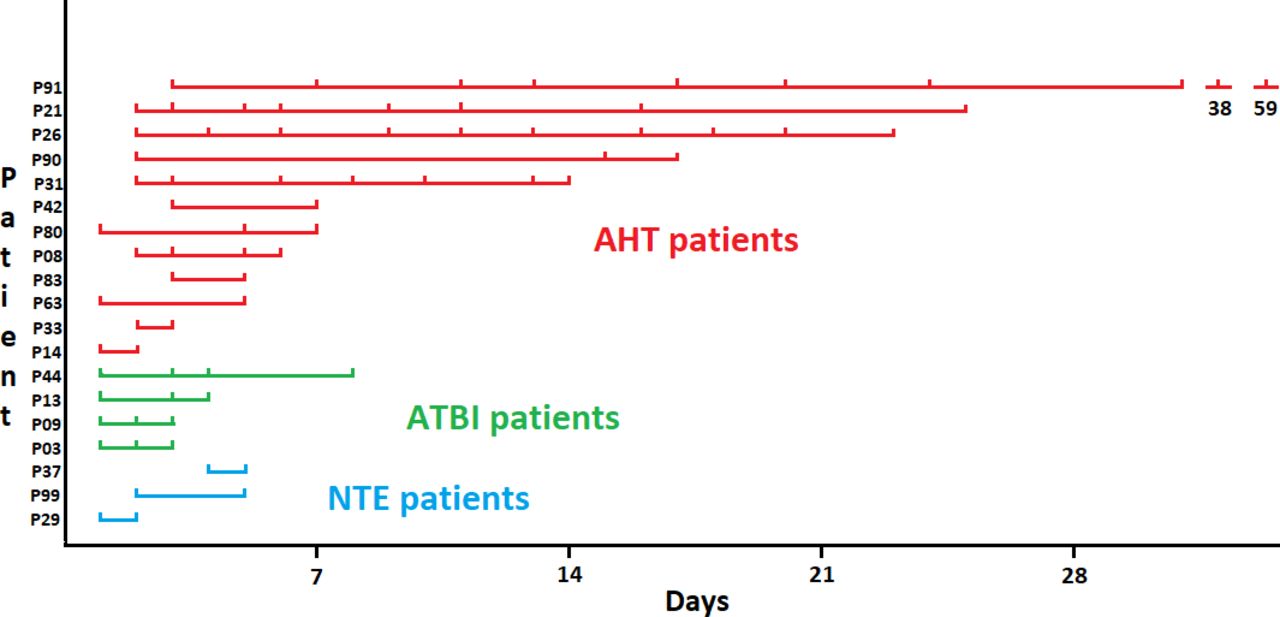
Timelines of examinations of the 18 patients with retinal haemorrhages who underwent serial examinations. The timelines are ordered by duration of follow-up and by aetiology group. AHT, abusive head trauma; ATBI, accidental traumatic brain injury; NTE, non-traumatic encephalopathies.
A total of 251 of the 429 iRHs studied were observed to fully resolve during the serial examination, and 178 remained present at the time of the last examination. Of the 251 that resolved, the precise day of the resolution was not known for iRHs, where the interval between the examination when the haemorrhage was last present and the examination when the haemorrhage was found to be resolved was more than 1 day. We used the day when the haemorrhage was found to be resolved as a surrogate for the true time of resolution in these haemorrhages. The median interval between the examination when the haemorrhage was last present and the examination when the haemorrhage was found to be resolved was 6 days (95% CI 7.48 to 9.51), range 1–42 days.
With respect to change in the area of RHs over time, three main patterns of resolution emerged, summarised in table 1.
Patterns A, B and C by resolution of retinal haemorrhages selected for analysis
First, pattern A (n=256 haemorrhages in 16 cases; 256/429=59.7% of all haemorrhages) were those in which the largest haemorrhage area was present initially, and the haemorrhages progressively became smaller. A total of 153 resolved and 103 did not fully resolve during the period they were under study. The percentage of all iRHs due to AHT, ATBI and NTE in pattern A were 62% (204/328), 36.7% (18/49) and 65.4% (34/52), respectively.
The second pattern, pattern B (n=150 haemorrhages in 14 cases, 150/429=34.9% of haemorrhages) were those in which the initial RH increased in area before progressively decreasing in area. A total of 75 resolved and 75 did not fully resolve during the period they were under study. The pattern B phenomenon was seen in all RH types (10% were PRHs and 90% were IRHs (20/135 flame and 115/135 dot-blot RHs)) and all aetiologies (31.3% (103/328) of AHT-induced haemorrhages, 59% (29/49) of accidentally induce RHs and 34.6% (18/52) of NTE-induced RHs). There were no haematological or other pathologies associated with patients who had pattern B haemorrhages.
Of all 429 haemorrhages, 94.7% could be classified into the two described patterns A and B. In the third pattern, pattern C (n=23 RHs in 4 cases, that is, 23/429=5.4% of haemorrhages), the initial iRH size increased or decreased in a fluctuating way. All the 23 had fully resolved on the last day of imaging.
Time from admission to resolution in pattern A group
For the 153/256 haemorrhages that resolved in pattern A group, the mean (range) number of days from admission to resolution was 14.3 (2–59) days, and from the first imaging session to the day of resolution was 13.4 (1–57) days. For IRHs (n=142), the mean (range) number of days from first imaging to resolution was 12.0 (1–57) days, and for PRHs (n=8), 29.0 (10–57) days.
Time from admission to maximum iRH area in pattern B group
In the pattern B group (150 haemorrhages), the mean (range) number of days from admission to the day of maximum haemorrhage area was 4.7 (2–38) days, and from the day of first imaging to the day of maximum haemorrhage area was 2.7 (1–35) days. For IRHs (n=135), the mean (range) number of days from admission to the day of maximum haemorrhage area was 4.1 (2–24) days, and from the day of first imaging to the day of maximum haemorrhage area was 2.2 (1–21) days. For PRHs (n=12), the mean (range) number of days from admission to the day of maximum haemorrhage area was 11.8 (3–38) days, and from the day of first imaging to the day of maximum haemorrhage area was 9.8 (1–35) days.
Time from maximum iRH area to resolution in pattern B group
A total of 75 RHs in the pattern B group resolved while under observation, 72 IRHs and 3 PRHs. The mean (range) number of days from maximum area to resolution was 9.0 (1–52) days. The mean (range) number of days from maximum area to resolution for 72 IRHs was 8.2 (1–52) days. The mean (range) number of days from maximum area to resolution for 3 PRHs was 28.3 days (21–42) days.
RH area (in pixels) change over time
Within pattern B group, the mean (range) increase in iRH area measured in pixels from the first examination to the examination at which maximum area occurred was 35.24% (0.5%–208%) for IRHs (n=135) and 98.92% (6%–427%), for PRHs (n=12).
Comparison of the rates of decline in area between iRH types
The mean rate of reduction in area was calculated where possible, using (i) first or largest measurement, (ii) the second measurement was zero if the zero was within 1 day of a previous measurement when the RH was still present and (iii) the second measurement was otherwise the measurement from the last measured day when the RH was still present. For each haemorrhage, we calculated the area difference from (i) to (ii), or (i) to (iii) and divided these values by the number of days to obtain a rate of area reduction. We assumed a linear course of decline. Not all RHs were demonstrated to reduce in area, due to limited periods of observation. The RHs that were observed to become smaller (n=290) had an initial mean area of 819.7 pixels and their area reduced by a mean of 102.2 pixels per day (12.5%). The IRHs that were observed to become smaller (n=261) had an initial mean area of 685.5 pixels and their area reduced by a mean of 99.1 pixels per day (14.5%). The PRHs that were observed to become smaller (n=27) had an initial mean area of 2114.1 pixels and their area reduced by a mean of 133.9 pixels per day (6.3%). The difference in the mean rate of size reduction between IRHs and PRHs approached significance (p=0.07).
Comparison of the rates of decline in area between pattern A and pattern B groups
In the pattern A group, the RHs that resolved (n=153) or did not resolve but were observed to become smaller (n=101) had an initial mean area of 845.8 pixels and their area reduced by a mean of 128.3 pixels per day (15.2%). In the pattern B group, the RHs that resolved (n=75) or did not resolve but were observed to become smaller after initially enlarging (n=30) had a mean maximum area of 703.1 pixels and their area reduced from their maximum area by a mean of 96.9 pixels per day (13.8%). There was no significant difference between the groups.
Pattern A and pattern B resolution is illustrated in figure 3, using RH area measurements from one patient. In addition, selected retinal images from this patient are shown in figure 4.

Pattern A and pattern B resolution illustrated in RH area measurements from one patient. H, haemorrhage; RH, retinal haemorrhage.
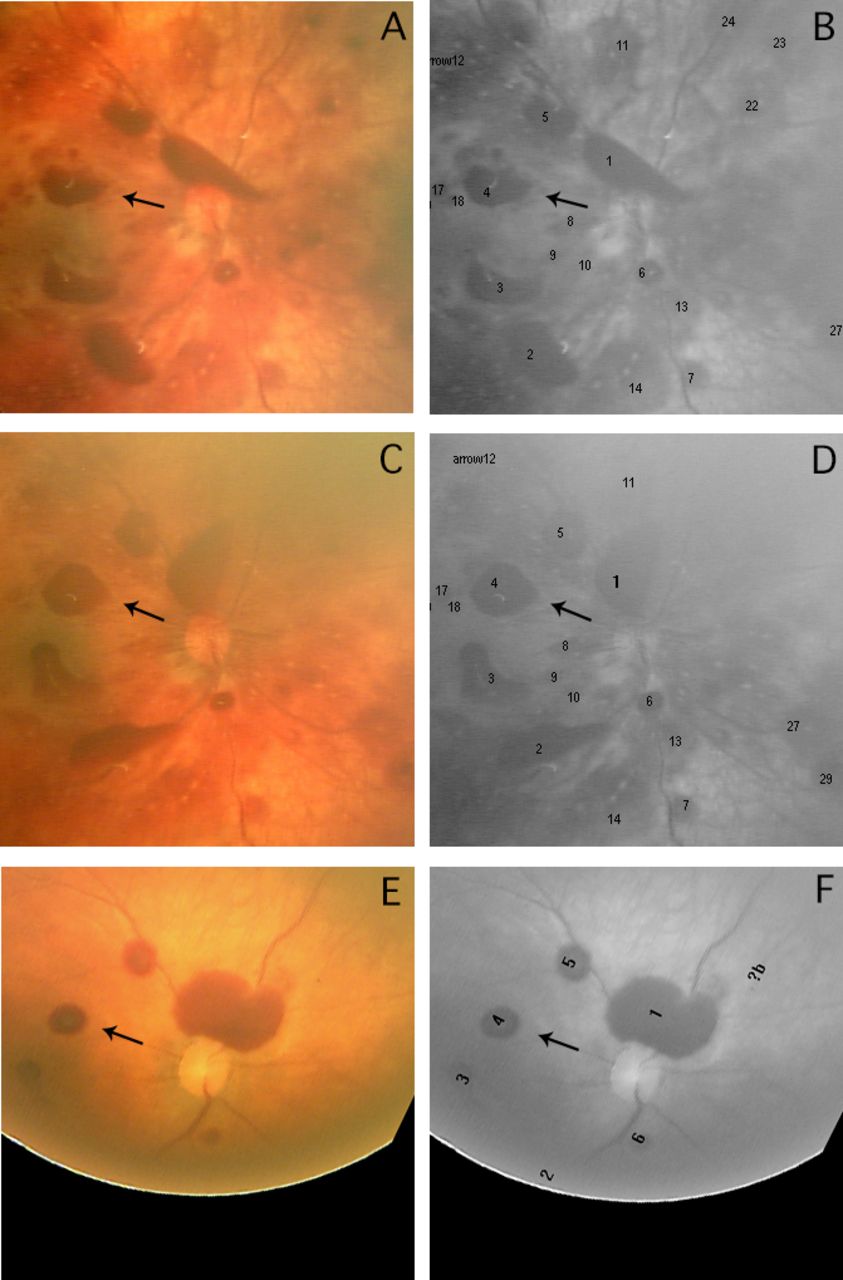
Retinal images to illustrate pattern B resolution. These are from the right eye of the patient used in figure 3. The images were taken at day 2 (A and B), day 3 (C and D) and day 9 (E and F) after admission. Each pair of images shows a colour image, and a corresponding black and white image with numbered individual retinal haemorrhages (iRHs) marked. The iRHs numbers correspond to those given in the key within figure 3. Haemorrhage 4, a pre-RH, is marked with an arrow in each image, as an example of pattern B resolution. The images were cropped and rotated, centred on the optic disc, but were not modified in any other way.
Median survival times
MST measurements for RHs that resolved used the time from the first imaging session to the last imaging session. The caveat for both Kaplan-Meier plots (figure 5) was that the precise day of the resolution was not known for some haemorrhages. As described above, we used the day when the haemorrhage was found to be resolved as a surrogate for the true endpoint. The Kaplan-Meier survival function MST (95% CI) was 10 (8.9 to 11.1) days for pattern A and 10 (9.1 to 10.9) days for pattern B, log rank (Mantel-Cox) p=0.48. The MST (95% CI) for IRHs was 10 (9.3 to 10.7) days and for PRHs, 38 (10.8 to 65.2) days, log rank (Mantel-Cox) p=0.001.

(A) Kaplan-Meier plot comparing pattern A and pattern B haemorrhage survival. (B) Kaplan-Meier plot comparing intraretinal and preretinal haemorrhage survival within pattern A group. Hs, haemorrhages; IntraRet, intraretinal; IRHs, intraretinal haemorrhages; PreRet, preretinal; PRHs, preretinal haemorrhages.
RH resolution rates are summarised in table 2.
Summary of resolution of retinal haemorrhages selected for analysis
Discussion
Novel aspects of this study were the sequential counting of RH numbers and the methodical measurements of selected iRH areas (in pixels) from all the serially imaged occasions until resolution. This revealed two predominant patterns of resolution.
In pattern A (60% of all RHs), the initial haemorrhage area was the largest observed and progressively declined until resolution. In the previously unrecognised pattern B (35%), the initial haemorrhage area first increased over a mean period of 4.7 days from admission, before subsequently decreasing towards resolution. This duration was longer for the 15 PRHs in pattern B, where the number of days from admission to the day of maximum haemorrhage area was a mean of 11.8 days. The mean increase in area was 35% for IRHs and 99% for PRHs.
We postulate that pattern B may be due to spreading of the haemorrhage, not unlike that occurring with a cutaneous haemorrhage, or from fibrinolysis resulting in the acute breakdown of blood with water drawn into the collection.3 Spreading and dispersal of haemorrhages in the retina is restricted between certain layers, particularly across the internal plexiform layer, because multiple junctions here act as a barrier, whereas in more superficial haemorrhages, more dispersal is possible.4 PRHs generally contain a large volume of blood, and have limited cellular contact for absorption. There were no haematological or other pathologies associated with patients who had pattern B haemorrhages. We found that individual haemorrhages may enlarge before regressing, which is clinically plausible, and also observed that there was no increase in RH numbers.
Given that iRHs may expand in area first before gradually resolving (pattern B), there are limitations to inferences that might be made by interpreting the area or change in the area of an individual haemorrhage in relation to the timing of any possible inciting event. All RH types and aetiologies were represented in the pattern B phenomenon.
The values for the duration of iRHs from our prospective study are consistent with those from the existing literature,1 5–8table 3.
Summary of resolution of retinal haemorrhages in the literature
The mean rate of area reduction per day was 14.5% for IRHs and 6.3% for PRHs. Haemorrhage resolution was correspondingly faster for IRHs. The mean rate of area reduction per day of pattern A group (15.2%) was similar to pattern B group (13.8%), when the latter was measured from the point of maximum area to resolution.
A post-mortem morphometric study on eyes,9 using a 100-square grid, which quantified the area affected by RHs, showed that children with AHT had larger haemorrhage-affected areas than children who had accidental injuries or falls. We have previously described an association between large numbers of RHs and AHT using data from the current study.2
A limitation of the study was uncertainty about the precise time of resolution of some haemorrhages. We used the day at which the haemorrhage was found to be resolved as a surrogate for the precise time of resolution in these cases. However, the true time of resolution could have been at any time between that day, and the day of the previous examination. While imaging sessions were performed frequently in the days following admission, on up to 10 occasions in some infants (online supplementary table 2 and figure 2), the logistical challenges and stress caused when imaging ill infants precluded the use of a systematic schedule.
Errors in assessing RH area are likely to have been small. PRHs occasionally change shape due to head movement. A single researcher (PAJ) repeated each measurement for each haemorrhage three times, and accepted the median measurement. An irregular outline of any haemorrhage could give rise to a slightly differing automatically calculated area. Unlike retinal blood vessels, RHs are not compressible and it is, therefore, unlikely that a variable pressure on the eye by the handheld RetCam caused artefact in our study measurements.10 Optical coupling of the RetCam lens with the cornea removes several camera magnification variables.11 However, fundus magnification varies with axial length.12 While this will vary with growth, serial measurements of individual subjects in our study were performed over a relatively short time period. In addition, we used percentage changes in RHs areas, rather than absolute pixel measurements, as this is thought to be a more reliable approach.11 Our study reports two-dimensional measurements. In these images, linear magnification of radial lines is greatest in the centre of each image and smaller near their edge.13 In order to minimise error, we did not use haemorrhages near the edges of our images. In our study, the same investigator undertook sequential imaging of the same patient over successive days using the same camera. The same computer display was used throughout, in order to maintain a fixed image area:pixel count ratio. Variability of image magnification in this study is, therefore, likely to be low, though not zero. On occasion, different haemorrhages in the same image followed different patterns of resolution. We, therefore, believe the changes seen in pattern B and pattern C iRHs were primarily physiological rather than optical. Pattern B haemorrhages were seen in images taken by all investigators.
In this study of RH area measurements (as pixel counts), using uniform methodology, we found that approximately one-third of all iRHs increased before decreasing in area. This finding negates any possible retrospective timing of any antecedent event. We reiterate that the number of haemorrhages in each patient did not increase, and the time to resolution of different haemorrhage types from this prospective study was similar to those reported in the literature.
Acknowledgments
We are grateful to Dr Rob Elton for statistical advice and to Claire Fleck Photography for assistance in the preparation of the figures. We are indebted to the patients and parents/carers for consenting to participate in this study, and the attending hospital medical and nursing staff.
References
Footnotes
Contributors RAM, PAJ, BF and AM planned the study. PAJ, BF, AT and AM conducted the study. RAM and PAJ analysed and submitted the study. RAM is responsible for the overall conduct of the study and is the guarantor of the study.
Funding Grants were provided by the RS Macdonald Charitable Trust, the Royal College of Surgeons of Edinburgh and the Friends of the Sick Kids Foundation, Edinburgh, Scotland.
Competing interests None declared.
Patient consent for publication Not required.
Ethics approval Ethical approval was granted by the Lothian research ethics committee (LREC 2004/6/2).
Provenance and peer review Not commissioned; externally peer reviewed.