Article Text

Abstract
Objective To assess linear correlation between swept-source optical coherence tomography (SS-OCT) lens density variation and patients’ best-corrected visual acuity (BCVA).
Methods and analysis Linear densitometry was performed on horizontal lens images from 518 eyes, obtained using SS-OCT. All densities from the anterior to the posterior side of the cataract were exported for detailed analysis. The algorithm used a classical random forest regression machine learning approach with fourfold cross-validation, meaning four batches of data from 75% of the eyes with known preoperative best-corrected visual acuity (poBCVA) were used for training a model to predict the data from the remaining 25% of the eyes. The main judgement criterion was the ability of the algorithm to identify linear correlation between measured and predicted BCVA.
Results A significant linear correlation between poBCVA and the algorithm’s prediction was found, with Pearson correlation coefficient (R)=0.558 (95% CI: 0.496 to 0.615, p<0.001). Mean BCVA prediction error was 0.0965±0.059 logarithm of the minimal angle of resolution (logMAR), with 312 eyes (58%) having a BCVA prediction correct to ±0.1 logMAR. The best algorithm performances were achieved for 0.20 logMAR, with 79%±0.1 logMAR correct prediction. Mean, anterior cortex, nucleus and posterior cortex pixel density were all not correlated with patient BCVA.
Conclusion Pixel density variations based on axial lens images provided by SS-OCT biometer provide reasonably accurate information for machine learning analysis to estimate patient BCVA in all types of cataracts. This study demonstrates significant linear correlation between patients’ poBCVA and the algorithmic prediction, with acceptable mean prediction error.
- imaging
- lens and zonules
Data availability statement
Data are available upon request.
This is an open access article distributed in accordance with the Creative Commons Attribution Non Commercial (CC BY-NC 4.0) license, which permits others to distribute, remix, adapt, build upon this work non-commercially, and license their derivative works on different terms, provided the original work is properly cited, appropriate credit is given, any changes made indicated, and the use is non-commercial. See: http://creativecommons.org/licenses/by-nc/4.0/.
Statistics from Altmetric.com
Key messages
What is already known about this subject?
Swept-source optical coherence tomography (SS-OCT) global lens pixel density is sensitive and specific for confirming cataract presence. Nucleus density analysis permits definition of linear correlation with Ocular Scattering Index (OSI), Pentacam nucleus staging (PNS) and best-corrected visual acuity (BCVA). Anterior and posterior cortical opacifications are not evaluated with this method, with a risk of false negatives in real-life applications.
What are the new findings?
Analysing lens density variations from anterior to posterior parts of the lens permits definition of linear correlation with patients’ BCVA in all types of cataracts.
How might these results change the focus of research or clinical practice?
These results should help to develop a lens dysfunction score comparable to OSI or PNS, using a single-machine SS-OCT biometer for time and cost economy.
Introduction
Cataracts are the most common cause of blindness worldwide. Several classifications are used to assess cataract morphology and density, such as the Lens Opacification Classification System (LOCS III)1 and the Wisconsin Cataract Grading System.2 Clinical slit-lamp classification methods remain subjective, with limited intergrader reproducibility (65%),2 but can be enhanced by deep convolutional neural networks.3 Also, several objective imaging methods have been developed to grade cataracts and correlate their severity with patients’ best-corrected visual acuity (BCVA).
Pentacam nucleus staging (PNS) with Scheimpflug tomography (Pentacam, Oculus Optikgerate GmbH) or Ocular Scattering Index (OSI) Optical Quality Analysis System (Visiometrics SL) devices are replicable and reliable methods for grading cataracts. Several studies have shown the correlation between Scheimpflug lens density and OSI indices, and their correlation with LOCS III classification, contrast sensitivity, phacoemulsification ultrasound parameters and BCVA.4–7
More recently, swept-source optical coherence tomography (SS-OCT) development has permitted easy, routine cataract lens imaging.8 Swept-source biometers can perform biometry and axial imaging with corneal, cataract and macular reports on a single machine. This new type of imagery has permitted new data interpretation, showing replicable and reliable lens density evaluation.8–10 A promising correlation exists between mean optical coherence tomography (OCT) lens pixel density and LOCS III classification, Scheimpflug imaging and OSI, which could facilitate further applications of SS-OCT biometers in cataract evaluation.9 10
Two leading study cohorts have been used to evaluate SS-OCT performance in cataract grading. First, Panthier et al9 10 focused on global lens density to predict cataract presence, with a cut-off at 73.8 pixels per unit. Then, Chen et al11 identified a strong correlation between SS-OCT nuclear density, Pentacam nuclear density and logMAR BCVA. However, nuclear density ignores cortical and posterior cataracts, and the large ranges in visual acuity used in prospective studies may be less representative of further clinical applications and lack sensitivity in mild cataracts.
SS-OCT provides reliable measures for both biometry and lens imaging. To date, SS-OCT lens evaluation has only focused on global lens density or nuclear density but never focused on localisation of opacities to better fit all types of cataracts. However, single-machine evaluation may be time and cost-effective for evaluating a patient’s cataract and its impact on BCVA. Before engaging new large and time-consuming prospective cohorts, new methods to grade cataracts using SS-OCT can be evaluated in retrospective cohorts, searching for linear correlation with BCVA. If effective, the method should be used in prospective cohorts to develop an SS-OCT index fitting to PNS or OSI to better indicate surgery. Considering the large amount of data provided by SS-OCT cataract density imaging from the anterior to the posterior part, machine learning may be an accurate method for correlating lens density and BCVA.
The aim of this study was to develop a method for analysing OCT lens density variation patterns to improve evaluation of all types of cataracts with mild to moderate loss of vision, and which better fits real-life applications.
Methods
Patients
All patients consulting for cataract surgery between 1 November 2019 and 28 February 2020 at Quinze-Vingts National Ophthalmology Hospital (CHNO) consultation department, with a preoperative best-corrected visual acuity (poBCVA) between 0.5 and 0.05 logarithm of the minimal angle of resolution (logMAR) and complete postoperative visual recovery (0.0 logMAR), were retrospectively included in the study. Exclusion criteria were corneal or vitreoretinal disorders, previous ocular surgery (except refractive surgery) and incomplete postoperative visual acuity recovery (>0.00 logMAR). Corticonuclear or subcapsular cataracts were confirmed in preoperative examination, OCT reports and surgery reports. The surgical technique used was phacoemulsification, and all operators in CHNO were eligible to be included. Preoperative and postoperative visual acuity were measured using a converted logMAR scale. Patient age, preoperative ametropia and diabetic status were collected from their preoperative consultation file.
Swept-source intraocular lens tomography
All included patients underwent preoperative swept-source biometry acquisition using a IOL-700 Zeiss (Léna, Germany). The device uses a 1055 nm wavelength, with 44 mm A-scan depth and 6 mm width. Its measurement speed is 2000 A-scans per second, with a 22 μm resolution in the tissue. The IOL then provided the horizontal B-scan, which is displayed in the report as a 0°–180° B-scan. Lens pictures were imported from the Zeiss Forum software biometry report in Portable Network Graphics format (figure 1). Fixation was considered to be poor if foveolar depression was not visible on the OCT report, and dilatation was considered to be poor if this iris presence might alter the posterior cortex peripheral signal.
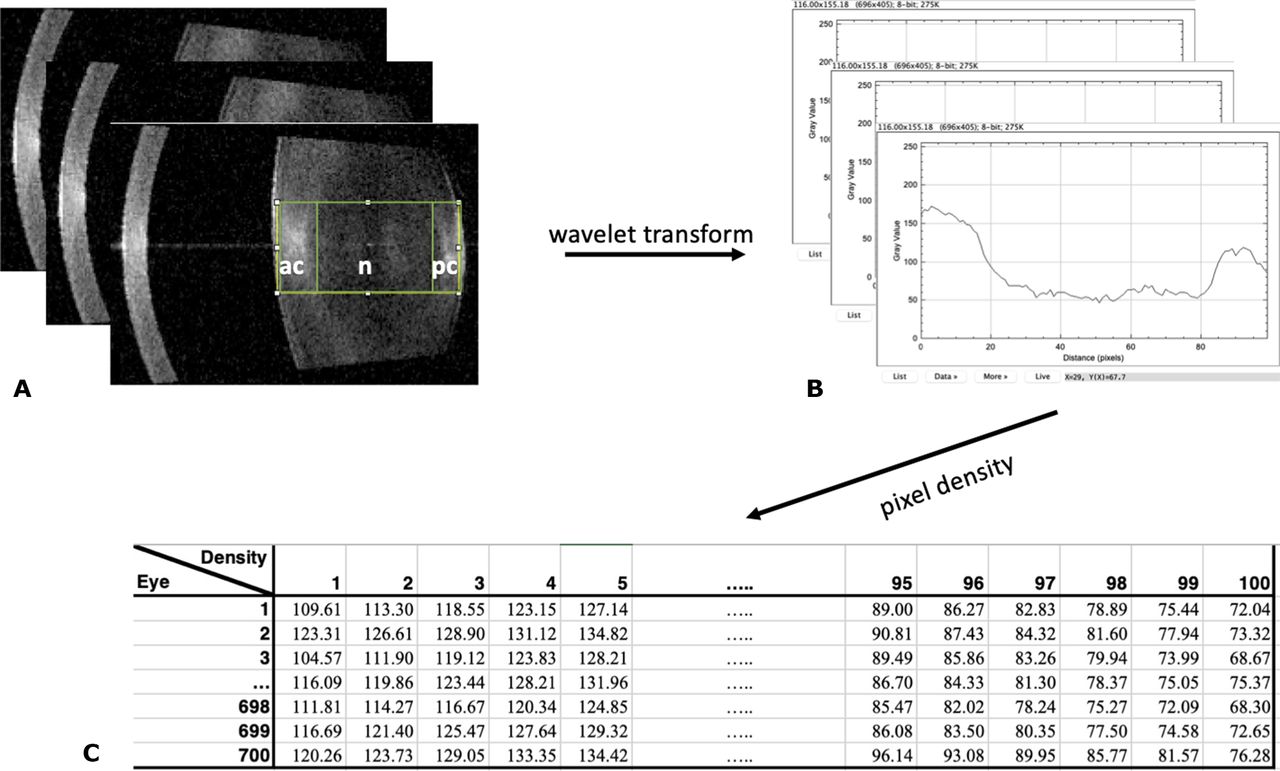
(A) Region of interest selection. (B) Curve plot of the amount of grey from left to right. (C) Pixel intensity (amount of grey) from lens anterior to posterior side.
Image processing
Linear densitometry was performed on the horizontal lens images obtained using the SS-OCT of the IOL measuring device. Original SS-OCT B-scans of the lens were exported to open-source ImageJ software (National Institutes of Health). The images were analysed according to the Scheimpflug imaging method previously described by Grewal et al5 and transposed by Panthier et al9 for OCT imaging. The lens area was selected using the magic stick tool, which delineated lens boundaries and defined the region of interest (ROI) centred on the lens nucleus (figure 1A). The anterior cortex, nucleus and posterior cortex were considered following clinical slit-lamp observation, as illustrated in online supplemental figure 1. The ROI density was measured in pixel intensity units, on a scale from 0 to 255 (figure 1B). Instead of calculating the cataract mean density, all the densities from the anterior to the posterior side of the cataract were exported for detailed analysis (figure 1C). It was assumed that higher pixel intensities were associated with higher cataract densities.
Supplemental material
Algorithm
The algorithm input was the lens density report (figure 1C), aiming to predict patient poBCVA. Eye laterality and patients’ sex and age were not used as inputs. To optimise the data available, the algorithm was trained using fourfold cross-validation, with four batches of 75% of the data used for training a model to predict the 25% remaining.
The algorithm is based on an adapted random forest regressor machine learning approach (figure 2). It does not directly use the all-lens density, but rather the density values and variation between them from the anterior to the posterior side of the cataract. The wavelet transform allows for the capturing of density patterns and variations along the lens, which are used by the algorithm to create a number of classifying decision trees for various subsamples of the dataset. Then, the algorithm uses averaging of comparable database samples to predict poBCVA for the test samples, providing more discriminating information compared with mean cataract density.

Schematic of random forest regression algorithm. BCVA, best-corrected visual acuity.
Judgement criteria
The main judgement criteria were the ability of the algorithm to identify linear correlation between measured and predicted poBCVA. The secondary judgement criteria were the ability of the algorithm to estimate patients’ poBCVA ±0.1 logMAR and mean, anterior, nuclear and posterior lens density correlations with poBCVA. Subgroup analysis evaluated the influence of preoperative ametropia, diabetes and type of cataract on the algorithm prediction.
Statistics
Statistical analysis was performed using Excel Software (Microsoft, Redmond, USA) and PValue.io (Medistica, Paris France). All p values less than 0.05 were considered statistically significant. Eyes were analysed independently. Univariate analysis was performed using the Welch test for non-numerical data and Pearson correlation for numerical data.
Results
Seven hundred acquisitions from 481 patients were analysed. Two hundred and seventy-one (52%) patients were women and the population mean age was 68.5±9.47 years. The preoperative mean spherical equivalent was −0.73±3.3 diopters, and the mean visual acuity was 0.27±0.9 logMAR (table 1). One hundred eighty-two eyes were excluded from the final evaluation: 76 eyes had poor fixation; 89 had poor dilatation; and 17 had both. Five hundred eighteen eyes were included in the final analysis.
Population characteristics
Algorithm performances
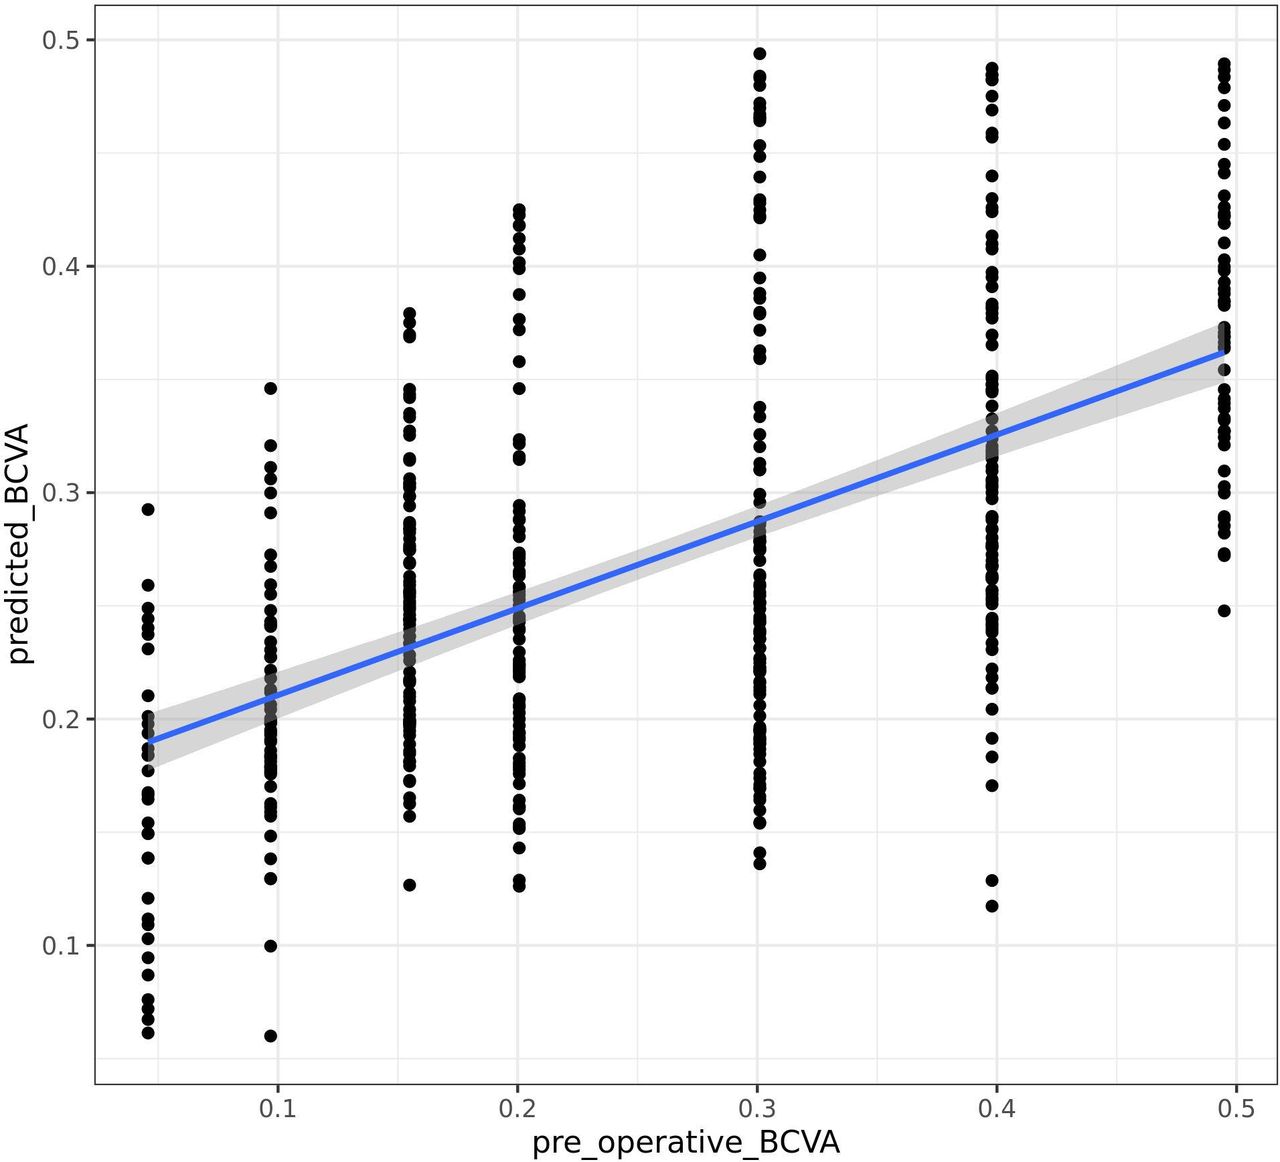
Significant linear correlation between poBCVA and algorithm prediction was found, with R=0.558 (CI 95%: 0.496–0.615, p<0.001) (figure 3). Mean poBCVA prediction error was 0.0965±0.0590 logMAR, and 302 eyes (58%) reached prediction correct to ±0.1 logMAR. The best performances were obtained from the algorithm for 0.20 logMAR with prediction correct to 79%±0.1 logMAR. Algorithm performances for each visual acuity are detailed in table 2. Areas that were strongly associated with the algorithm’s decision were the interface between the anterior cortex and nucleus, the nucleus centre, and the interface between the posterior cortex and the posterior capsule.

Correlation between measured (horizontal) and predicted (vertical) corrected visual acuity. Pearson correlation coefficient=0.558 (95% CI 0.496 to 3880.615, p<0.001). BCVA, best-corrected visual acuity.
Algorithm performances depending on preoperative best-corrected visual acuity
Lens density correlation
Mean, anterior cortex, nucleus and posterior cortex pixel density were all poorly correlated with patient poBCVA, with R=0.004 (p=0.91), R=0.03 (p=0.46), R=0.02 (p=0.65) and R=0.07 (p=0.06) linear correlations, respectively (online supplemental figure 2).
Supplemental material
Subgroup analysis
Age (R=0.0561 (−0.0181 to 0.130), p=0.14] and preoperative spherical equivalent (R=−0.00176 (−0.0844 to 0.0879), p=0.97) (online supplemental table 1) did not significantly influence the algorithm prediction. This effect was also seen for diabetes, with logMAR absolute mean error (0.096±0.06 vs 0.098±0.06, p=0.85), and posterior subcapsular cataract (0.097±0.06 vs 0.096±0.06, p=0.92) (online supplemental table 2).
Supplemental material
Supplemental material
Discussion
This study takes a new approach, assessing the possibility of estimating patient visual acuity using cataract swept-source OCT imaging and pixel density variation machine learning analysis. Cataracts are a leading cause of blindness and a major health issue. Objective assessment to confirm cataracts and estimate visual acuity loss in all types of cataracts opens new avenues in patient screening, to follow cataract evolution, better indicate and prepare for surgery or even confirm loss of visual acuity is caused by cataracts.
With 518 eyes, the algorithm has 58% correct BCVA predictions within ±0.1 logMAR. These results are enhanced for mid-visual acuity with a high number of eyes references. However, when plotting samples predicted to be low BVCA versus high BVCA, one can see a clear split between the patterns.
Low or high BVCA data under-representation in the algorithm database may cause a bias of recognition and statistical overestimation or underestimation, respectively. The algorithm analyses patterns of density variation, compares them to the database and may lack comparable data in limited visual acuity. Moreover, the alternative comparative method (75% database, 25% analysis) could alter this statistical bias.
Retrospective medical record analysis and the high number of operators may cause selection bias. However, all patients had standardised poBVCA evaluation using the same refraction systems, and biometry was acquired using the same machine. Single-operator screening could reduce this bias in further evaluation.
The IOL Master 700 performs six scans with different sagittal axes of the eye, but only the horizontal scan was included in analysis. Whole lens and nuclear density OCT analysis shows linear correlation with LOCS III classification.12 13 This technique may have an advantage in portraying the morphological characteristics of the whole nucleus and theoretically diminishing observer subjectivity in order to identify contours of the lens nucleus. However, the ROI selection method allows the observer to choose lens density patterns visible in scotopic conditions and might be more representative of BCVA measurement conditions. Moreover, the ROI technique is already used in several studies that employed Pentacam Scheimpflug or OCT images to evaluate the nuclear density with good interoperator reproducibility.9 14 This study aimed to explore a new technique for better lens imaging evaluation; however, automated lens analysis using six radial scans may enhance the algorithm precision and be more accurate for clinical practice.
Pupil dilatation with tropicamide or cyclopentolate produces statistically significant central corneal thickness, anterior chamber depth, lens thickness (LT) and wide-to-wide variations in IOL Master 700 measurements.15 16 OSI is affected by pupil size, especially in patients with astigmatism.17 In contrast, LT constriction after dilation affects total lens density, and the variation in density patterns remains unknown. Further algorithm evaluation on the non-dilated pupil should be considered.
We did not find any correlation between nuclear density and patient BCVA (R=0.02, p=0.65), neither did Wong et al13 with Time domain-OCT (TD-OCT) and Kim et al12 with Spectral domain-OCT (SD-OCT) analysis. In contrast, Chen et al11 showed a significant correlation between SS-OCT nuclear density and BCVA (R=0.655, p<0.001). The study by Chen et al11 was based on eyes with selected nuclear cataracts, and patients with a larger poBCVA range were enrolled (0.05–2.0 logMAR), which may reduce the sensitivity required to reach significant correlations. In contrast, we included a smaller poBCVA range and all types of cataracts. The presence of anterior or posterior opacifications combined with nuclear cataracts might explain previous methods’ lack of sensitivity and the absence of linear correlation with measured poBCVA once evaluating all types of cataracts.
Including anterior, nuclear, cortical and posterior subcapsular opacities could also affect total lens density analysis, as explained by de Castro et al.8 Some OCT images have light reflection polymorphisms and posterior attenuation. This may have an impact on the intensity of light passing through the lens nucleus and alter the OCT signal in the nuclear region. These light attenuation patterns are a source of bias for nucleus density analysis but may be strongly correlated with visual alteration and variations in lens density patterns, as used in our method.
The long-range SS-OCT is a high-speed imaging system, capable of providing a sharply focused cross-sectional image of the entire lens nucleus. However, regarding the posterior capsule, specular reflection sometimes led to brightness in this region, especially in patients with good fixation and tangent acquisition. This could lead to confusion in strict posterior capsule evaluation; however, the algorithm prediction error was not affected by posterior cataract opacification: 0.097±0.06 vs 0.096±0.06 absolute mean error (p=0.92).
Signal alteration occurs in dense cataracts, mostly consisting of density attenuation, which affects SS-OCT lens analysis with underestimated nucleus density analysis.11 These limits have also been described with the Pentacam Scheimpflug camera. Magalhães et al18 revealed that, when the LOCS III score was higher than 6.0, the correlation was statistically insignificant, with a loss in nuclear density estimation caused by signal alteration. They concluded that PNS lost efficacy because the blue light used by Pentacam was obstructed by a dense nucleus. In contrast, attenuated density pattern variations are easily identifiable and strongly correlated with low visual acuity.
OSI available with the OQAS (Visiometrics, Spain) device shows an interesting correlation between BCVA and PNS.19 However, OSI is also affected by ocular surface20 21 and vitreomacular disorders,22 so its clinical applications could be more limited. Moreover, having two devices is time-consuming, personnel-consuming and cost-consuming.
Finally, these preliminary outcomes suggest several recommendations for further studies. Algorithm correlation to OSI or PNS score might enhance further applications. Prospective data collection by a single trained operator might limit data collection bias and balanced repartition in BCVA might reduce image recognition errors; approximately 100 eyes for each BCVA seems appropriate. Automated six-radial scan analysis could enhance lens density pattern algorithm recognition and improve operator reproducibility. Lens OCT imaging could help to estimate BCVA loss caused by cataracts.
Conclusion
Pixel density variations based on axial lens images provided by IOL SS-OCT represent reasonably accurate information for machine learning analysis to estimate patients’ BCVA in all types of cataracts. This method provides better discrimination compared with mean lens density and is applicable to anterior, nuclear and posterior cataracts for better clinical application. This study identifies a significant linear correlation between patients’ poBCVA and the algorithm’s prediction, with acceptable mean prediction error.
Data availability statement
Data are available upon request.
Ethics statements
Ethics approval
All procedures performed in this study were in accordance with the ethical standards of the institutional research committee and with the 1964 Helsinki Declaration and its later amendments or comparable ethical standards.
References
Supplementary material
Supplementary Data
This web only file has been produced by the BMJ Publishing Group from an electronic file supplied by the author(s) and has not been edited for content.
Footnotes
Contributors HB and MR were in charge of data acquisition, image processing and article redaction. LT and CB were in charge of article supervision and revision. LT was in charge of refractive advices and article first review in the department of ophthalmology. MR participated in data collection. CB was the coordinator and final reviewer in the department of ophthalmology. HB was in charge of data interpretation and article redaction.
Funding The authors have not declared a specific grant for this research from any funding agency in the public, commercial or not-for-profit sectors.
Disclaimer This study was not related to LT’s consulting activities for the Zeiss group.
Competing interests None declared.
Provenance and peer review Not commissioned; externally peer reviewed.
Supplemental material This content has been supplied by the author(s). It has not been vetted by BMJ Publishing Group Limited (BMJ) and may not have been peer-reviewed. Any opinions or recommendations discussed are solely those of the author(s) and are not endorsed by BMJ. BMJ disclaims all liability and responsibility arising from any reliance placed on the content. Where the content includes any translated material, BMJ does not warrant the accuracy and reliability of the translations (including but not limited to local regulations, clinical guidelines, terminology, drug names and drug dosages), and is not responsible for any error and/or omissions arising from translation and adaptation or otherwise.