Article Text

Abstract
Objective To evaluate correlations between variability in central foveal thickness (CFT) and vision with ranibizumab in a HARBOR post hoc analysis.
Methods and analysis Patients with neovascular age-related macular degeneration (nAMD; N=1097) received monthly or as-needed (PRN) ranibizumab (0.5 or 2.0 mg) for 24 months. Fluctuation scores were used to assess CFT variability; every time CFT increased and then decreased (or vice versa), numeric value of the change was added to the score. Magnitude of change <50 µm was considered clinically insignificant and did not count towards the score. Fluctuation scores were grouped into quartiles. Least squares mean (LSM) changes in best-corrected visual acuity (BCVA) were plotted against fluctuation score quartiles for CFT, subretinal fluid (SRF) height, neurosensory retina and neurosensory retina + subretinal hyper-reflective material.
Results Patients with lower fluctuations scores (quartiles 1–3) had greatest vision gains at month 24, with LSM changes from baseline of 9.0–10.8 and 8.7–10.6 letters in the monthly and PRN arms, respectively. Corresponding changes for quartile 4 were 6.7 and 6.5 letters, respectively. There were no differences between quartiles for association between fluctuations in SRF height and BCVA gains. There were inverse correlations between magnitude of fluctuations in neurosensory and inner retina thickness and BCVA gains for quartile 4 vs quartiles 1–3. Patients in quartiles 1 and 2 showed rapid, robust BCVA gains, whereas those in quartiles 3 and 4 had lesser responses.
Conclusions Fluctuations in retinal thickening with ranibizumab may be associated with treatment response in patients with nAMD.
Trial registration number NCT00891735.
- vision
- treatment medical
- retina
- macula
- clinical trial
Data availability statement
Data are available on reasonable request. For eligible studies qualified researchers may request access to individual patient level clinical data through a data request platform. At the time of writing, this request platform is Vivli (https://vivli.org/ourmember/roche/). For up-to-date details on Roche’s Global Policy on the Sharing of Clinical Information and how to request access to related clinical study documents, see here: https://go.roche.com/data_sharing. Anonymised records for individual patients across more than one data source external to Roche cannot, and should not, be linked due to a potential increase in risk of patient re-identification.
This is an open access article distributed in accordance with the Creative Commons Attribution Non Commercial (CC BY-NC 4.0) license, which permits others to distribute, remix, adapt, build upon this work non-commercially, and license their derivative works on different terms, provided the original work is properly cited, appropriate credit is given, any changes made indicated, and the use is non-commercial. See: http://creativecommons.org/licenses/by-nc/4.0/.
Statistics from Altmetric.com
Key messages
What is already known on this topic?
Increased retinal thickness is a hallmark of eyes with neovascular age-related macular degeneration; fluctuations in retinal thickness have been hypothesised to have a negative impact on vision outcomes.
What this study adds?
Our findings suggest that fluctuations in retinal thickness, defined as a change of ≥50 µm after the loading period, may be associated with treatment response, but that patients with the greatest fluctuation scores may still be able to attain vision gains, although less than those among patients with the lowest fluctuation scores. Patients receiving fixed monthly treatment fluctuate less than those receiving pro re nata treatment, which is associated with a trend towards worse vision gains among patients experiencing the highest fluctuations.
How this study might affect research, practice or policy?
Monitoring fluctuations in retinal thickness during treatment may help prognosticate treatment response.
Introduction
Age-related macular degeneration (AMD) is a major cause of vision loss in people aged ≥50 years and can rapidly and progressively worsen over time.1–4 In patients with neovascular (‘wet’) AMD (nAMD), choroidal neovascularisation (CNV) leads to the leakage of blood and serum into the subretinal macular region, resulting in macular scarring and scotomata.2 An increase in retinal thickness or fluid in any retinal space indicates active CNV.5–7 Vascular endothelial growth factor (VEGF) plays an important role in the development of CNV.4 8 Hence, anti-VEGF therapy is the gold standard for treating CNV secondary to nAMD. However, there are currently no diagnostic tools for predicting response to anti-VEGF therapy.
Increased retinal thickness, as assessed on optical coherence tomography (OCT), is a hallmark of eyes with nAMD. OCT assessment of eyes with nAMD is the standard of care, particularly when managing patients on anti-VEGF treatments. Depending on various prevalent practice patterns, the number of injections per year is variable in this patient population. Injection frequency may also have an impact on disease activity control, and thereby on retinal thickness. Depending on the dosing regimen, there may be a variable pattern of changes to retinal thickness over the treatment duration; however, it is unclear whether fluctuations in retinal thickness have an impact on vision outcomes. Usha Chakravarthy’s group was the first to address this issue and, based on data from the Comparison of Age-related Macular Degeneration Treatments Trials (CATT) and Inhibition of VEGF in Age-related choroidal Neovascularisation (IVAN) trials, found that there were correlations between greater fluctuations in retinal thickness (measured as foveal centre point thickness) and functional and morphological outcomes.9 Both trials evaluated four treatment arms, with eyes randomly assigned to the anti-VEGF agents ranibizumab and bevacizumab, either administered monthly or as-needed (pro re nata; PRN).9 This elegant analysis used SD in centre point thickness as the measure of fluctuation and found that variation in retinal thickness in eyes receiving treatment for nAMD was adversely associated with visual outcomes.9 A post hoc analysis of the HAWK and HARRIER trials evaluating the impact of variations in retinal thickness (measured as central subfield thickness (CST)) on vision outcomes in patients with nAMD revealed similar preliminary findings.10
In parallel, we explored analysis methods to answer the same question using data from the phase III HARBOR trial of ranibizumab in treatment-naïve patients with nAMD and active subfoveal CNV.11 12 When evaluating representative patients from the HARBOR trial, it became clear that there were differences in the way that central foveal thickness (CFT) decreased in the macula at the individual patient level, with some patients experiencing a gradual decline, whereas in others, CFT thickness would rebound after reaching a nadir, a phenomena we call ‘bounce’ (online supplemental figure 1); however, both gradual decline and ‘bounce’ patients had similar SD. Therefore, we set out to find a metric for fluctuation translatable to clinical practice.
Supplemental material
In this study, we report results from a post hoc analysis of the HARBOR trial, which evaluated correlations between patients’ variability in CFT measurements over time and their overall vision outcomes in response to ranibizumab treatment at month 24. The correlations between the magnitude of fluctuations at month 12 and vision outcomes at month 24 were also evaluated.
Materials and methods
The HARBOR trial
This was a post hoc analysis of the HARBOR trial (ClinicalTrials.gov: NCT00891735), a multicentre, double-masked, randomised, active treatment-controlled trial of ranibizumab in treatment-naïve patients with nAMD and active subfoveal CNV. Full details of the study design, patient population, treatment protocol and prespecified outcome measures in the HARBOR trial are described elsewhere.11 12 Briefly, patients with best-corrected visual acuity (BCVA) 20/40–20/320 (Snellen equivalent) were randomised to one of four treatment groups receiving intravitreal ranibizumab 0.5 mg or 2.0 mg, with each dose either administered monthly or PRN (after 3 monthly loading doses) through month 24.11 12 After the loading doses, patients in the PRN arm were able to receive ranibizumab if they had a decrease of ≥5 Early Treatment Diabetic Retinopathy Study (ETDRS) letters in BCVA since the previous visit or any evidence of disease activity on spectral-domain OCT (subretinal fluid (SRF), intraretinal fluid (IRF) or subretinal pigment epithelium).11 12
Patient and public involvement
Patients or the public were not involved in the design, conduct, reporting or the dissemination plans for HARBOR.
Post hoc analysis: fluctuations in CFT
Patients were included in this post hoc analysis if BCVA data were available at baseline and month 24. Rather than utilising SD to assess a patient’s variability, this post hoc analysis established a fluctuation score, that is, the cumulative change in microns of CFT over time, where CFT was defined as the retinal thickness (internal limiting membrane (ILM) to retinal pigment epithelium (RPE)) at the fovea. A total of 16 non-missing CFT values from month 3 to month 24 were required for the calculation of fluctuation scores. Each time the CFT changed direction (eg, increasing to decreasing or vice versa), the numeric value of the change was added to the fluctuation score (online supplemental figure 2). Changes <50 µm were considered clinically insignificant and did not count towards the fluctuation score. Month 3 was used as a pseudobaseline for computing the fluctuation score to allow both arms to stabilise after receiving loading injections.
Supplemental material
Fluctuation score quartiles of CFT were determined based on data from the pooled monthly and PRN treatment arms (or, alternatively, by treatment regimen, where indicated) and were defined as follows:
Quartile 1: 0–25th percentile of fluctuation scores (ie, the quartile with the least fluctuation).
Quartile 2: 25–50th percentile of fluctuation scores.
Quartile 3: 50–75th percentile of fluctuation scores.
Quartile 4: ≥75th percentile of fluctuation scores (ie, the quartile with the most fluctuation).
Changes in visual acuity
Least squares mean (LSM) changes in BCVA were plotted against fluctuation score quartiles for the following parameters: CFT (ILM-RPE), SRF height, neurosensory retina (measured from ILM to photoreceptor outer segments) and neurosensory retina + subretinal hyper-reflective material (SHRM). LSM changes in BCVA by fluctuation score quartile were plotted over time.
Statistical analysis
For each treatment regimen (PRN or monthly), LSM changes in BCVA and 95% CIs were calculated for each fluctuation score quartile and adjusted based on baseline BCVA (not on the pseudobaseline). Correlations between fluctuation scores at month 12 and various outcome measures at month 24 were assessed; correlation coefficients and p values were calculated.
Results
Patient disposition
Overall, 1097 patients were randomised to ranibizumab 0.5 mg monthly (n=275), 0.5 mg PRN (n=275), 2.0 mg monthly (n=274) or 2.0 mg PRN (n=273).12 Baseline demographic and ocular characteristics were well balanced across ranibizumab treatment arms.12
In this post hoc analysis, both the 2 monthly groups and the two PRN groups were pooled (monthly, n=549; PRN, n=548). Baseline demographic and ocular characteristics were similar between patients in the monthly and PRN treatment arms (online supplemental table 1). The mean age of the overall population was 78.7 years; 59% of patients were female and the majority were White (97%). The mean visual acuity (BCVA) at baseline was 53.9 and most patients (75%) had either type 1 or type 2 lesions.
Supplemental material
When CFT fluctuation score quartiles were determined based on the pooled dataset (monthly and PRN treatment arms combined), 228 patients had a fluctuation score of 0 and were in quartile 1, 197 were in quartile 2, 212 were in quartile 3 and 212 were in quartile 4. Of the 212 patients who experienced the largest CFT fluctuations (quartile 4), 179 were in the PRN arm and 33 were in the monthly arm. Patients in the monthly treatment arm with the largest CFT fluctuations had worse ocular lesion characteristics at baseline (greater CNV thickness and greater central retinal/lesion thickness) compared with the overall post hoc population (online supplemental table 2).
Supplemental material
BCVA outcomes and CFT measurements
Patients in quartiles 1–3 had the numerically greatest vision gains at month 24, with the mean change from baseline ranging from 9.0 to 10.8 letters in the monthly treatment arm (pooled monthly, n=394) and 8.7–10.6 letters in the PRN treatment arm (pooled PRN, n=243) (figure 1A). In comparison, patients in quartile 4, with the largest fluctuations, had the least vision gains at month 24, with a mean change from baseline of 6.7 letters in the monthly treatment arm (n=33) and 6.5 letters in the PRN treatment arm (n=179) (figure 1A).

Least squares mean (LSM) best-corrected visual acuity (BCVA) change from baseline at month 24 by magnitude of central foveal thickness (internal limiting membrane to retinal pigment epithelium) fluctuation, including quartiles defined by all data (monthly and as-needed (pro re nata) (PRN) pooled); (A) and quartiles defined by regimen-specific data for monthly (B) and PRN (C) patients. Error bars represent 95% CI; LSM was adjusted for baseline BCVA. The numbers of patients for each quartile in the monthly arm (B) are not equal because >25% of the monthly patients had a fluctuation score of 0.
Although there were no statistically significant differences, fluctuation scores were lower in monthly quartiles (figure 1B) compared with PRN quartiles (figure 1C). When looking at BCVA outcomes, patients in quartiles 1–3, with the lower fluctuation scores, had the greatest BCVA gains at month 24, with a 10.5-letter to 10.8-letter gain in monthly patients (pooled monthly, n=321) (figure 1B) and an 8.0-letter to 10.6-letter gain in PRN patients (pooled PRN, n=317) (figure 1C). Patients in quartile 4, with the highest fluctuation scores, had the least vision gains within the respective subgroup, with an 8.4-letter gain with the monthly regimen (n=106) (figure 1B) and a 5.3-letter gain (n=105) with the PRN regimen (figure 1C). Overall, when comparing patients in quartile 4 with those in quartiles 1, 2 and 3, there was an inverse correlation between the magnitude of CFT fluctuations and BCVA gains at month 24. Unsurprisingly, because patients in the PRN cohort were only treated when there was a disease breakthrough, quartile 4 in the pooled monthly subgroup had a lower mean fluctuation score and numerically better BCVA compared with quartile 4 in the pooled PRN subgroup.
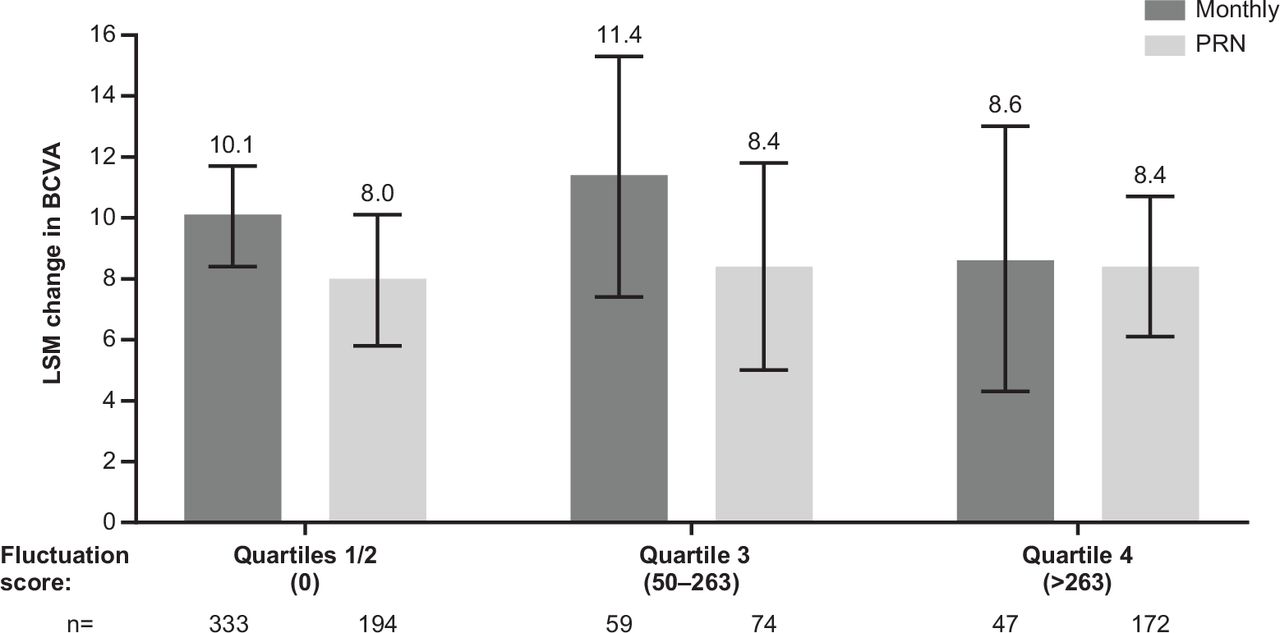
When the same methodology was applied to look at the fluctuation score quartiles based on changes to the height of the SRF compartment, we observed that BCVA gains in PRN patients were generally similar across all quartiles (ie, ~8-letter gains) (figure 2). The monthly patients also demonstrated ≥8.6-letter gains across quartiles, with patients in quartiles 1, 2 and 3 showing numerically higher gains than those in quartile 4 (figure 2). Overall, fluctuations in the SRF compartment were not associated with a discernible trend of BCVA gain at month 24 between quartiles.

Least squares mean (LSM) best-corrected visual acuity (BCVA) change from baseline at month 24 by magnitude of subretinal fluid fluctuation, with quartiles defined by all data (monthly and as-needed (pro re nata) (PRN) pooled). Quartiles 1 and 2 were combined because >50% of patients had a fluctuation score of 0. Error bars represent 95% CI; LSM was adjusted for baseline BCVA.
To study the impact of IRF on BCVA gains at month 24, we looked at fluctuations in thickness of the neurosensory retina measured from the ILM to photoreceptor outer segments. We observed that quartiles 1–3 had gains of ≥9.3 letters for both treatment regimens, whereas quartile 4 had lower gains of 3.3 letters in monthly patients (n=60) and 5.6 letters in PRN patients (n=169), respectively (figure 3). These between-quartile differences are clinically meaningful. Overall, when comparing patients in quartile 4 vs those in quartiles 1, 2 and 3, there was an inverse correlation between the magnitude of fluctuations in neurosensory retina thickness and BCVA gains at month 24.

Least squares mean (LSM) best-corrected visual acuity (BCVA) change from baseline at month 24 by magnitude of fluctuation of neurosensory retina thickness (internal limiting membrane to photoreceptor outer segment representative of intraretinal fluid), with quartiles defined by all data (monthly and as-needed (pro re nata) (PRN) pooled). Quartiles 1 and 2 were combined because >50% of patients had a fluctuation score of 0. Error bars represent 95% CI; LSM was adjusted for baseline BCVA.
We also looked at the impact of fluctuations of the inner retina inclusive of SHRM, which combined thickness of neurosensory retina and SHRM. Here, too, we observed the same trend as for the neurosensory retina alone, with quartile 4 having clinically meaningful lower mean BCVA gains of 4.2 letters in the monthly arm (n=55) and 3.6 letters in the PRN arm (n=163) compared with the other three quartiles, with mean BCVA gains of ≥9.9 letters in any treatment arm (figure 4). Overall, when comparing patients in quartile 4 vs those in quartiles 1, 2 and 3, there was an inverse correlation between the magnitude of fluctuations in inner retina thickness and BCVA gains at month 24, irrespective of regimen.
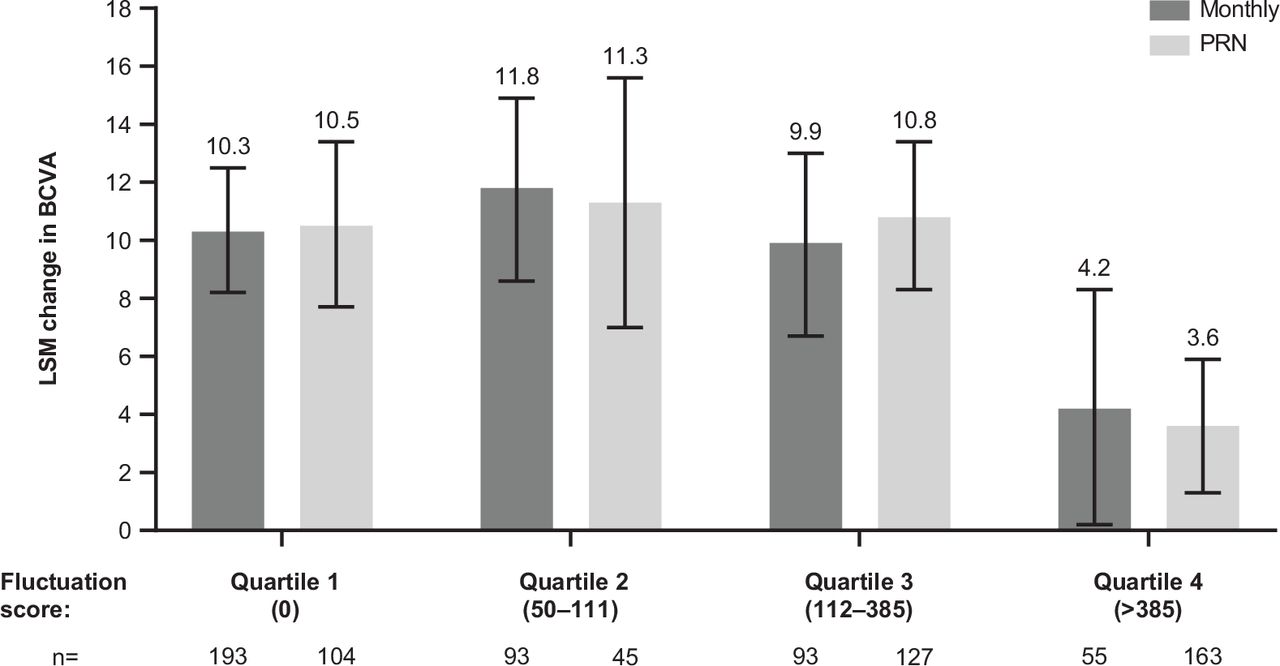
Least squares mean (LSM) best-corrected visual acuity (BCVA) change from baseline by magnitude of fluctuation of inner retina thickness (representative of intraretinal fluid + subretinal hyper-reflective material), with quartiles defined by all data (monthly and as-needed (pro re nata) (PRN) pooled). Error bars represent 95% CI; LSM was adjusted for baseline BCVA.
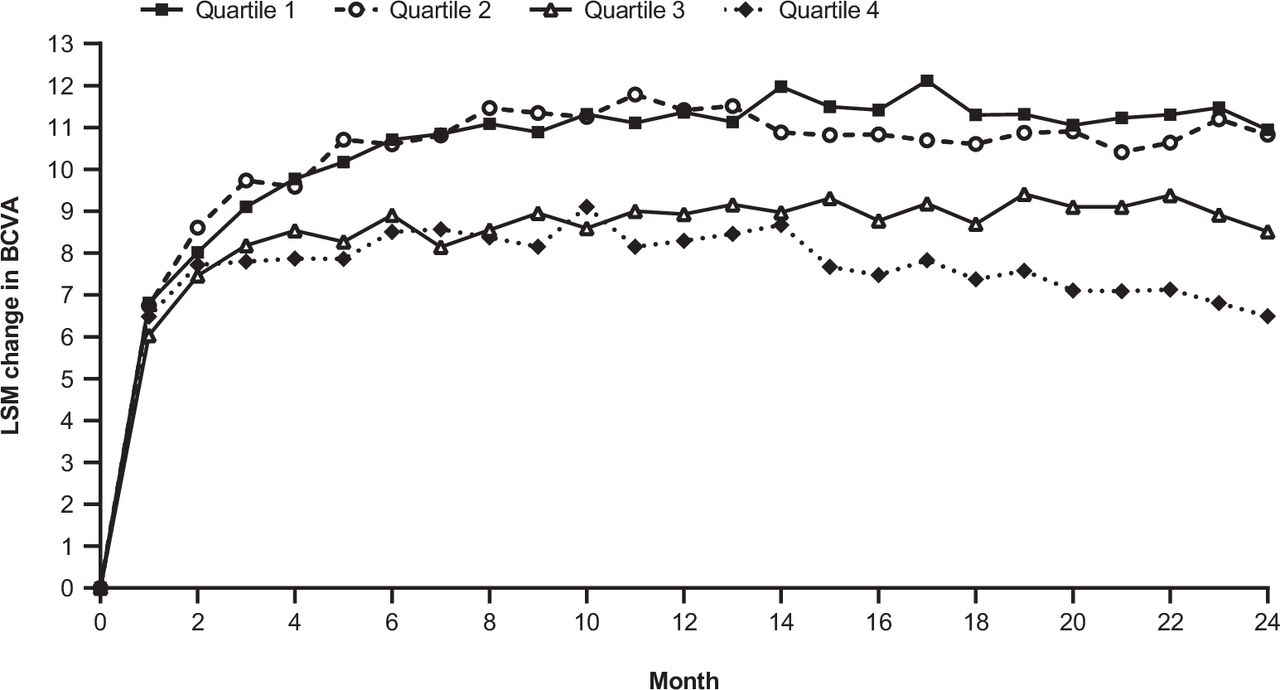
Graphing the change in BCVA over time by fluctuation quartile revealed that separation of the BCVA curves occurred early (figure 5). Patients in quartiles 1 and 2 showed rapid, robust vision gains, whereas those in quartiles 3 and 4 had a lesser response (figure 5).

Least squares mean (LSM) change in best-corrected visual acuity (BCVA) from baseline over time by fluctuation quartile, with quartiles defined by all data (monthly and as-needed (pro re nata) pooled).
In patients in the PRN treatment arm, there was a correlation between larger CFT fluctuations through month 12 and lower gains in BCVA at month 24, with quartile 4 at month 12 having LSM changes from baseline in BCVA of 4.7 (95% CI 1.9 to 7.5) vs 10.4 (95% CI 8.4 to 12.5) in quartile 1. However, in patients in the monthly treatment arm, there was no significant difference in the change from baseline in BCVA at month 24 between patients with no fluctuations at month 12 vs those with fluctuations (10.4 (95% CI 7.5 to 13.4) vs 9.4 (95% CI 7.4 to 11.5)). Finally, there was a correlation between the month 12 fluctuation score vs the month 12 to month 24 fluctuation score in both the PRN (r=0.66 (p<0.01)) and monthly (r=0.43 (p<0.01)) treatment arms.
Discussion
In this post hoc analysis of the HARBOR trial, when looking at the pooled monthly and PRN populations, the patients in quartiles 1, 2 and 3, with the lower CFT fluctuation scores, achieved numerically greater vision gains after 24 months of ranibizumab treatment compared with patients in quartile 4, with the highest fluctuation scores. This association was greater in the PRN-treated patients compared with the monthly-treated patients. As expected, there were fewer patients in quartile 4 from the monthly arm than from the PRN arm because CFT is expected to remain more stable with consistent dosing. The 33 monthly-treated patients in quartile 4 had greater CNV thickness and greater central retinal/lesion thickness at baseline compared with the overall post hoc population. Of note, when quartiles were defined by regimen-specific datasets, monthly patients had lower fluctuation scores than PRN patients. This is expected because the PRN regimen required disease activity to return to qualify for retreatment, which manifested in the increases in retinal thickness between subsequent treatments. Although the higher fluctuation scores are not unexpected in PRN patients, the impact of increasing CFT fluctuations on BCVA scores underscores the importance of the effect of this phenomenon on vision outcomes.
Higher fluctuation scores in inner retina thickness (representing IRF) yielded poorer vision outcomes regardless of regimen; however, fluctuations in SRF height did not impact vision outcomes. Early separation of vision curves plotting change in BCVA from baseline over time by fluctuation quartile suggested a correlation (but not a causation) with fluctuation. Larger CFT fluctuations in quartile 4 at month 12 were shown to be correlated with lower BCVA gains at month 24 in the PRN treatment arm, but not in the monthly arm. Furthermore, the fluctuation score at month 12 was correlated with the month 12 to month 24 fluctuation score in both the PRN and monthly treatment arms.
Our findings are in agreement with a recently published post hoc analysis evaluating data from the CATT and IVAN trials, which reported an association between higher foveal centre point thickness variability and poor vision outcomes, with an LSM (95% CI) difference in ETDRS letters of –6.3 (–8.5 to –4.1) in the quartile with the highest variability (quartile 4) relative to the quartile with the lowest variability (quartile 1).9 This association was also valid for quartiles 2 and 3 relative to quartile 1.9 Notably, despite the methodological differences, the overall association with BCVA outcomes was consistent between the two analyses. The findings from the HAWK and HARRIER analysis10 are also consistent with our observations.
A recent report by Chakravarthy et al evaluated the relationship between retinal thickness fluctuations (IRF, SRF and CST) and visual acuity changes using SD fluctuation quartiles (SD-Q) in patients with nAMD in the anti-VEGF maintenance phase.13 They reported greater vision losses in patients in the higher fluctuation quartiles (SD-Q2, SD-Q3 and SD-Q4) for IRF, SRF and CST compared with those in the lower fluctuation quartile (SD-Q1). An interesting finding from our analysis is that fluctuations in SRF did not impact vision outcomes. Despite the methodological differences, this finding is supported by the report by Chakravarthy et al,13 who concluded that SRF was not a major contributor to the larger and more persistent SD-Q4 fluctuations in retinal thickness in patients with nAMD.
Our findings regarding the relationship between treatment regimens (monthly vs PRN) and CFT fluctuations in this post hoc analysis are to be expected. By design, a reactive PRN regimen in which patients receive anti-VEGF treatment in response to disease reactivation invites larger fluctuations than a fixed, proactive regimen during the course of the treatment, and may result in fewer injections than may be required for optimal vision outcomes.14 However, in the context of this analysis, comparing a fixed monthly with a PRN regimen provided an excellent opportunity to deepen our understanding of the associations between CFT fluctuations and vision outcomes.
Our analysis has several limitations. Although the methodology used to determine and rank CFT fluctuation scores worked well for this analysis, it has not been previously validated. For example, we used a threshold of 50 µm when determining the clinical significance of the CFT changes. Although this is a reasonable threshold to use, it is relatively subjective and remains to be validated. Furthermore, fluctuation quartiles were defined by pooling specific data (eg, pooling monthly and PRN data or, alternatively, pooling only treatment regimen-specific data) and as such do not represent ‘absolute’ thresholds. Patients who may have been included in one quartile may end up in another if quartiles are determined based on monthly, PRN or pooled regimens. Finally, another limitation is that we did not make any statistical adjustments for multiplicity because this analysis was post hoc and therefore not planned before trial initiation.
In conclusion, the findings from our post hoc analysis of data from HARBOR suggest that fluctuations in retinal thickness during anti-VEGF treatment may be associated with treatment response. Patients with the greatest fluctuation scores may still be able to attain vision gains, although less than those among patients with the lowest fluctuation scores, if they receive consistent treatment. Monitoring fluctuations in retinal thickness during treatment may help prognosticate treatment response.
Data availability statement
Data are available on reasonable request. For eligible studies qualified researchers may request access to individual patient level clinical data through a data request platform. At the time of writing, this request platform is Vivli (https://vivli.org/ourmember/roche/). For up-to-date details on Roche’s Global Policy on the Sharing of Clinical Information and how to request access to related clinical study documents, see here: https://go.roche.com/data_sharing. Anonymised records for individual patients across more than one data source external to Roche cannot, and should not, be linked due to a potential increase in risk of patient re-identification.
Ethics statements
Patient consent for publication
Ethics approval
This study involved human participants and was approved by ethics committees at each study site. Participants gave informed consent to participate in the study before taking part.
Acknowledgments
The authors would like to thank Mila Malhotra for valuable input during development of the manuscript.
References
Supplementary material
Supplementary Data
This web only file has been produced by the BMJ Publishing Group from an electronic file supplied by the author(s) and has not been edited for content.
Footnotes
Presented at Data reported in this manuscript were presented in part at the 2020 Association for Research in Vision and Ophthalmology Virtual Annual Meeting and the 2020 American Society of Retina Specialists Virtual Annual Meeting.
Contributors All authors contributed to the study concept and design, acquisition, analysis or interpretation of data, drafting of the manuscript and critical revision of the manuscript for important intellectual content. SB performed the statistical analysis. VS is the guarantor.
Funding Financial support was provided by Genentech, Inc., a member of the Roche Group (South San Francisco, California, USA). The sponsor participated in the design of the study; collection, management, analysis and interpretation of the data; and review and approval of the manuscript for accurate reporting of the data. Funding was provided by Genentech, Inc., a member of the Roche Group, for third-party writing assistance, which was provided by Fiona Nitsche, PhD, CMPP and Luke Carey, PhD, CMPP, of Envision Pharma Group.
Competing interests The author(s) have made the following disclosure(s): VS: consultant for Genentech, Inc.; MD'R, SG and SB: employees of Genentech, Inc.
Provenance and peer review Not commissioned; externally peer reviewed.
Supplemental material This content has been supplied by the author(s). It has not been vetted by BMJ Publishing Group Limited (BMJ) and may not have been peer-reviewed. Any opinions or recommendations discussed are solely those of the author(s) and are not endorsed by BMJ. BMJ disclaims all liability and responsibility arising from any reliance placed on the content. Where the content includes any translated material, BMJ does not warrant the accuracy and reliability of the translations (including but not limited to local regulations, clinical guidelines, terminology, drug names and drug dosages), and is not responsible for any error and/or omissions arising from translation and adaptation or otherwise.