Article Text

Abstract
Purpose To evaluate the minimum number of visual fields (VFs) required to precisely predict future VFs in eyes with retinitis pigmentosa (RP).
Methods A series of 12 VFs (Humphrey Field Analyzer 10–2 test (8.9 years in average) were analysed from 102 eyes of 52 patients with RP. The absolute error to predict the 12th VF using the prior 11 VFs was calculated in a pointwise manner, using the linear regression, and the 95% CI range was determined. Then, using 3–10 initial VFs, next VFs (4th to 11th VFs, respectively) were also predicted. The minimum number of VFs required for the mean absolute prediction error to reach the 95% CI was identified. Similar analyses were iterated for the second and third next VF predictions. Similar analyses were conducted using mean deviation (MD).
Results In the pointwise analysis, the minimum number of VFs required to reach the 95% CI for the 12th VF was five (first and second next VF predictions) and six (third next VF prediction). For the MD analysis, three (first and second next VF predictions) and four (third next VF prediction) VFs were required to reach 95% CI for the 12th VF.
Conclusions The minimum number of VFs required to obtain accurate predictions of the future VF was five or six in the pointwise analysis and three or four in the analysis with MD.
- field of vision
- eye (globe)
- retina
Data availability statement
Data are available upon reasonable request. NA.
This is an open access article distributed in accordance with the Creative Commons Attribution Non Commercial (CC BY-NC 4.0) license, which permits others to distribute, remix, adapt, build upon this work non-commercially, and license their derivative works on different terms, provided the original work is properly cited, appropriate credit is given, any changes made indicated, and the use is non-commercial. See: http://creativecommons.org/licenses/by-nc/4.0/.
Statistics from Altmetric.com
Significance of the study
What is already known about this subject?
The ordinary least square regression is highly sensitive to outliers and accurate assessment of visual field progression is hampered by its variability.
What are the new findings?
The minimum number of visual fields required to obtain accurate predictions of the future visual field was five or six in the pointwise analysis and three or four in the analysis with mean deviation.
How might these results change the focus of research or clinical practice?
Careful consideration is needed for the possible inaccurate assessment of the progression of visual field, when the number of visual fields is small.
Introduction
Retinitis pigmentosa (RP) is a slow, progressive, hereditary retinal disease caused by the loss of photoreceptors.1 2 RP is characterised by nyctalopia and constriction of the visual field (VF), which sometimes progresses in legal blindness. Precise measurement of the VF is important in RP and can be performed using a static automated perimeter, such as the Humphrey Field Analyzer (HFA) (Carl Zeiss Meditec, Dublin, California).3 4 An assessment of central VF, such as the HFA 10–2 test, is particularly important because VF is closely related to visual disability.5 The progression of RP can be quantitatively measured using the HFA 10–2 test,6–8 in contrast to the Goldmann perimetry test. Nonetheless, a detailed investigation regarding the reliability and clinical usefulness of the trend analysis using the HFA 10–2 test in RP has not been made.
In the clinical setting, the prediction of future VFs (using HFA) is usually conducted using a linear trend analysis. Using the ordinary least square regression (OLSLR), the linear trend analysis tracks changes in VF indices over time, such as mean deviation (MD, MD trend analysis) as implemented in the Guided Progression Analysis software on the HFA or pointwise (PW) VF sensitivity. Accurate assessment of VF progression is hampered by VF variability.9 The reliability of VF measurements is inherently affected by a patient’s concentration. Furthermore, the effect of measurement noise cannot be completely avoided, even with reliable indices.10 11 Glaucoma also exhibits chronic and irreversible VF deterioration. The assessment of VF progression for glaucoma is usually carried out using a linear trend analysis of the HFA 24–2 test. We demonstrated that a considerably large number of VFs (approximately 10) are required to accurately predict future VFs, even when predicting relatively near-future VFs (between 6 months and 1.5 years into the future).12 These findings are in agreement with other previous studies.13–16 Thus, careful attention is needed when clinicians assess and predict VF progression in glaucoma based on a small number of VFs. The purpose of the current study was to investigate whether similar findings were observed when applying the linear trend analysis of the HFA 10–2 test results for predicting future VFs in RP.
As widely acknowledged, OLSLR is highly sensitive to outliers, and attempts have been made to overcome this problem. For example, in a robust model, the weight of each data point in the regression is dependent on the size of its residual. Thus, the model is more ‘robust’ to the influence of outliers.17 We investigated the usefulness of applying this approach in glaucoma, however, the improvement in the prediction accuracy was small and only marginally beneficial in the clinical setting.12 In the current study, we investigated the usefulness of a non-linear trend analysis approach (robust and quadratic regressions) in RP to predict future VFs, in comparison with OLSLR.
Method
Subjects and VFs
VF data were retrospectively obtained from 102 eyes in 52 patients with RP. Patients were followed in the glaucoma clinic at the University of Tokyo Hospital and retinal dystrophy clinic at Kyoto University Hospital between 1 February 2005 and 31 January 2020. All patients had at least 12 measurements with the 10–2 HFA test pattern, excluding the initial VF. Diagnosis of RP was given when the following findings were present: (1) typical fundus findings of RP, such as bone spicule pigmentation, arteriolar attenuation and waxy disc pallor; (2) reduction in a-wave and b-wave amplitudes or non-detectable full-field electroretinogram and (3) RP was the only disease causing VF damage. VF measurements were performed using the HFA with the 10–2 programme and the Swedish Interactive Threshold Algorithm Standard. Other inclusion criteria in this study were as follows: (1) no previous ocular surgery except for cataract extraction and intraocular lens implantation, (2) no other diseases of the anterior and posterior segments of the eye that could affect VF, including cataracts, except for clinically insignificant senile cataracts and (3) age at least 20 years. Those with intraocular surgery, including cataract surgery, during the observation period were excluded. Reliability criteria for VFs were applied, including fixation losses of <20% and false-positive responses of <15%. A false-negative rate was not applied as a reliability criterion based on a previous report.10 The VF of the left eye was mirror imaged to that of the right eye for statistical analyses.
Statistical models
The following regression models were used to make predictions, where y represents PW VF sensitivity or MD value and x represents the duration from the initial VF:
ordinary least squares linear regression: y=axe+b
quadratic regression: y=ax2+bx+c
robust regression (M-estimator robust linear regression)18 : yi=α+β1xi1+β2xi2+···+βkxik+εi=xiβ+εi for the ith of n observations, the general M-estimator minimises the objective function:

where the function ρ gives the contribution of each residual to the objective function.19
The quadratic and robust regressions represent various non-linear regression methods, such as exponential, logistic and other robust regressions, based on the results of our previous studies.12 20 21
Statistical analysis
The PW VF sensitivities of the 12th VF (VF12) were predicted using OLSLR with the first 11 (VF1–11), 10 (VF1–10) and 9 VFs (VF1–9) for the first, second and third next VF prediction, respectively, in a PW manner. Absolute prediction accuracy was calculated as the absolute value of the difference between the predicted and the actual sensitivities. The process was reiterated to predict the PW sensitivity of the 11th VF (VF11) using VF1–10, VF1–9 and VF1–8 and the PW sensitivity of VF8, VF9 and VF10 using VF1–7, and so on up to the prediction of VF4 (first next VF prediction), VF5 (second next VF prediction) and VF6 (third next VF prediction). The 95% CI of the absolute prediction error to predict the 12th VF was identified, and the minimum number of VFs for the mean absolute prediction error to reach this 95% CI was identified, following our previous paper.12 Subsequently, the associations between the absolute prediction errors and the values of MD progression rates with 12 VFs and MD values in the initial VF were investigated using the linear mixed model. Among all eyes, 72 eyes (38 patients), 59 eyes (30 patients) and 38 eyes (20 patients) had 13, 14 and 15 VFs, respectively. As subanalyses, prediction error calculation was further conducted using these eyes, up to 15th VF prediction, following our previous paper.12 These analyses were also performed using the quadratic and robust regressions. Subsequently, these analyses were iterated using the MD values in each VF.
All statistical analyses were carried out using the statistical programming language R (V.3.4.3, The R Foundation for Statistical Computing, Vienna, Austria). Linear mixed modelling was used to analyse the relationship between the two values in which patients were treated as a random effect. The linear mixed model is equivalent to ordinary linear regression in that the model describes the relationship between the predictor variables and a single outcome variable. However, standard linear regression analysis assumes that all observations are independent of each other. In the current study, measurements were nested within subjects and, hence, were dependent on each other. Ignoring this grouping of the measurements would result in an underestimation of SEs of regression coefficients. The linear mixed model adjusts for the hierarchical structure of the data, modelling in a way in which measurements are grouped within subjects to prevent the possible bias derived from the nested structure of data.13 14 The comparison between multiple groups was conducted using Dunnett’s test.
Results
Patient demographic information is shown in table 1. The mean±SD of MD in VF1 was −17.1±8.6 dB. The mean±SD interval between VF1 and VF12 was 8.9±2.1 years. The MD progression rate with VF1–12 was −0.51±0.41 dB/year.
Demographic characteristics
When predicting the 12th VF using OLSLR in the PW manner, the 95% CI of the absolute prediction error was 2.4 and 2.9 (first next VF prediction with VF1–11), 2.8 and 3.8 (second next VF prediction with VF1–10) and 3.5 and 4.6 dB (third next VF prediction with VF1–9), respectively (figure 1A–C). The minimum number of VFs required for the mean absolute prediction error to reach this range was 5 (first and second next VF predictions) or 6 (third next VF prediction). In all comparisons, there were no significant differences between the absolute prediction errors with OLSLR and robust regression. On the other hand, the absolute prediction errors with quadratic regression were significantly larger than the prediction errors with OLSLR in most cases (p<0.05, linear mixed model with Dunnett’s test). The predictions of VF13 (72 eyes) using VF1–12, VF1–11 and VF1–10; VF14 (59 eyes) using VF1–13, VF1–12 and VF1–11; and VF15 (38 eyes) using VF1–10, VF1–9 and VF1–8 were conducted. The mean absolute prediction error values were within the range of the 95% CI for the VF12 prediction, except for predicting VF13 using VF1–10.
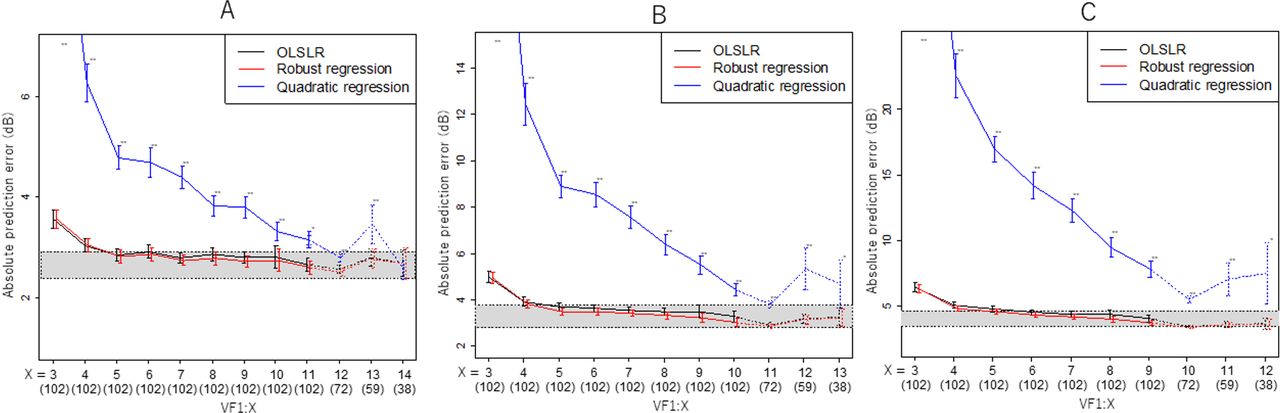
Association between the absolute prediction error and the number of VFs used in the prediction (PW sensitivity). The Y-axis shows the absolute prediction error when predicting the first, second or third next VF. (A) First next VF prediction. The X-axis shows the number of VFs used in the prediction. For instance, X=12 suggests the absolute prediction error when the 12th VF was predicted using VF1–11. Values are illustrated as the mean and SE. Prediction calculations were conducted using 102 eyes up to X=11, 72 eyes for X=12, 59 eyes for X=13, and 38 eyes for X=14. The grey zone shows the 95% CI of the absolute prediction error when predicting VF12 using VF1–11. (B) Second next VF prediction. The X-axis shows the number of VFs used in the prediction. For instance, X=13 suggests the absolute prediction error when the 15th VF was predicted using VF1–13. Values are illustrated as the mean and SE. Prediction calculations were conducted using 102 eyes for up to X=10, 72 eyes for X=11, 59 eyes for X=12, and 38 eyes for X=13. The grey zone shows the 95% CI of the absolute prediction error when predicting VF12 using VF1–10. (C) Third next VF prediction. The X-axis shows the number of VFs used in the prediction. For instance, X=12 suggests the absolute prediction error when the 15th VF was predicted using VF1–12. Values are illustrated as the mean and SE. Prediction calculations were conducted using 102 eyes for up to X=9, 72 eyes for X=10, 59 eyes for X=11, and 38 eyes for X=12. The grey zone shows the 95% CI of the absolute prediction error when predicting VF12 using VF1–9. OLSLR, ordinary least square regression; PW, pointwise; VF, visual field.
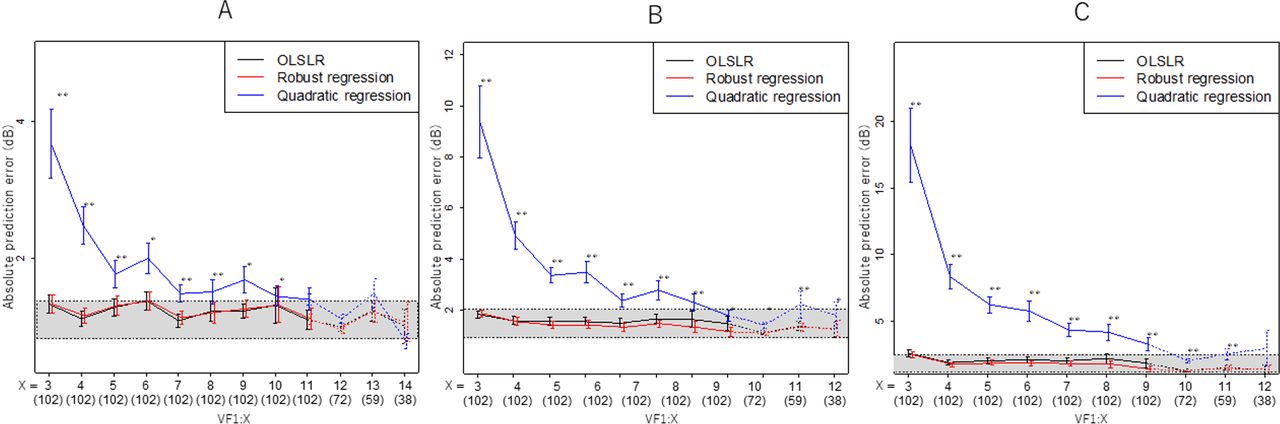
When predicting the 12th VFs using OLSLR with MD values, the 95% CI of the absolute prediction error was 0.82 and 1.4 (first next VF prediction with VF1–11), 0.92 and 2.0 (second next VF prediction with VF1–10) and 1.2 and 2.5 dB (third next VF prediction with VF1–9), respectively, as shown in figure 2A–C. The minimum number of VFs required for the mean absolute prediction error to reach this range was 3 (first and second next VF predictions) or 4 (third next VF prediction). In all comparisons, there were no significant differences between absolute prediction errors using OLSLR and robust regression. On the other hand, the absolute prediction errors using quadratic regression were significantly larger than the prediction errors with OLSLR in most of the cases (p<0.05, linear mixed model with Dunnett’s test). The predictions of VF13 (72 eyes) using VF1–12, VF1–11 and VF1–10; VF14 (59 eyes) using VF1–13, VF1–12 and VF1–11; and VF15 (38 eyes) using VF1–10, VF1–9 and VF1–8 were conducted. The mean absolute prediction error values were within the range of the 95% CI for the VF12 prediction.
Association between the absolute prediction error and the number of VFs used in the prediction (MD). The Y-axis shows the absolute prediction error when predicting the first, second or third next VF. (A) First next VF prediction. The X-axis shows the number of VFs used in the prediction. For instance, X=12 suggests the absolute prediction error when the 12th VF was predicted using VF1–11. Values are illustrated as the mean and SE. Prediction calculations were conducted using 102 eyes for up to X=11, 72 eyes for X=12, 59 eyes for X=13, and 38 eyes for X=14. The grey zone shows the 95% CI of the absolute prediction error when predicting VF12 using VF1–11. (B) Second next VF prediction. The X-axis shows the number of VFs used in the prediction. For instance, X=13 suggests the absolute prediction error when the 15th VF was predicted using VF1–13. Values are illustrated as the mean and SE. Prediction calculations were conducted using 102 eyes for up to X=10, 72 eyes for X=11, 59 eyes for X=12, and 38 eyes for X=13. The grey zone shows the 95% CI of the absolute prediction error when predicting VF12 using VF1–10. (C) Third next VF prediction. The X-axis shows the number of VFs used in the prediction. For instance, X=12 suggests the absolute prediction error when the 15th VF was predicted using VF1–12. Values are illustrated as the mean and SE. Prediction calculations were conducted using 102 eyes for up to X=9, 72 eyes for X=10, 59 eyes for X=11, and 38 eyes for X=12. The grey zone shows the 95% CI of the absolute prediction error when predicting VF12 using VF1–9. OLSLR, ordinary least square regression; PW, pointwise; VF, visual field.
Table 2 shows the association between the absolute prediction errors and the values of the MD progression rate for 12 VFs. No significant association was observed between these values in all investigations (linear mixed model with adjustment for multiple comparisons using Benjamini and Hochberg’s method,22 p>0.05).
The association between the absolute prediction error and progression rate of MD
Table 3 shows the association between the absolute prediction errors and the MD p value in the initial VF. No significant association was observed between these values in all investigations (linear mixed model with adjustment for multiple comparisons using Benjamini and Hochberg’s method,22 p>0.05), except for the prediction of VF9 using VF1–8.
The association between the absolute prediction error and MD value in the initial VF
Discussion
In this study, time series VF data were collected from the eyes of patients with RP, and the relationship between the number of VFs and the prediction accuracy of VF test results was investigated. The accurate prediction of future VFs was accomplished when at least five or six VF records were used, which is much lower than the similar prediction using the HFA 24–2 test in the eyes of patients with glaucoma (approximately 10).12 We observed no merit in using non-linear regression models (quadratic and robust regressions), similar to our previous investigation in patients with glaucoma.12
The accuracy of the prediction of VF progression is largely influenced by VF variability. As a result, the number of VF and the accuracy of prediction are in a trade-off relationship.9 In glaucoma, studies using the HFA 24–2 test suggest that clinicians should acquire 816 23 or 1012 VFs to accurately forecast future progression. In contrast, no investigation has determined the number of VFs needed to accurately forecast disease progression in patients with RP. One reason for this discrepancy may be the difficulty in collecting a long series of VFs from a large number of patients with RP. Glaucoma is the leading cause of irreversible blindness in the world, affecting >60 million people.24 On the other hand, RP affects only 1.4 million people worldwide.25 In the current study, a long series of VFs (12 VFs) were collected from a relatively large number of patients with RP (102 eyes). Using this data set, the 95% CI of the absolute prediction error when predicting the 12th VF using the prior 11 (first next VF prediction), 10 (second next VF prediction) and 9 VFs (third next VF prediction) was between 2.4 and 2.9, 2.8 and 3.8 and 3.5 and 4.6 dB, respectively, for PW VF sensitivities. The mean absolute prediction error values were between these intervals when predicting the first next VF using an initial 5–11 VFs, when predicting the second next VF using an initial 5–11 VFs, and when predicting the third next VF using an initial 6 and 11 VFs (figure 1A–C). We iterated similar analyses using subsets of eyes (between 38 and 72 eyes) with various numbers (from 13 to 15) of maximum VFs obtained. Very similar absolute prediction errors were observed in most cases, suggesting that a different finding is unlikely even if a larger data set with 15 VF records was analysed. The reasons why smaller numbers of VFs are needed to accurately predict future VF in RP with the HFA 10–2 test compared with those in predicting future glaucoma with the HFA 24–2 test (approximately 10 VFs)12 are unclear; however, one reason may be the different courses of the diseases. Intraocular pressure reduction is usually administered in glaucoma. As a result, the progression of the disease can vary according to the treatment status, even in the same eye. However, in RP, the disease usually progresses at a steady rate. In addition, differences in the areas of VF may be important; the variance in VF sensitivity in the central area of the eye is much smaller than in the sensitivity in the peripheral area.26 Future studies are needed to investigate whether similar results are shown in eyes with glaucoma using the HFA 10–2 test.
In contrast to PW analysis, the analyses using MD values resulted in 95% CI for the absolute prediction error when predicting 12th VF using the prior 11 (first next VF prediction), 10 (second next VF prediction) and 9 VFs (third next VF prediction) between 0.82 and 1.4 (first next VF prediction with VF1–11), 0.92 and 2.0 (second next VF prediction with VF1–10) and 1.2 and 2.5 dB (third next VF prediction with VF1–9). The mean absolute prediction error values were between these intervals when predicting the first next VF using initial VFs of 3–11, when predicting the second next VF using VFs of 3–11, and when predicting the third next VF using VFs of 4–11 (figure 2A–C). The prediction errors were within the 95% CI range when subsets of eyes (between 38 and 72 eyes) with various numbers (from 13 to 15) of maximum VFs were used. Thus, fewer VFs were required in the analyses with MD, compared with those in PW analyses. The MD is the averaged VF sensitivity in the whole field. As a result, the MD fluctuates less compared with PW VF sensitivities. Similar to the PW analyses, these values were smaller than those in our previous study (between 5 and 7) in the eyes of patients with glaucoma.12
To date, there are limited treatment options for RP. The importance of accurately assessing VF progression cannot be overstated for the establishment of future treatment. The crucial need for an accurate assessment of VF was demonstrated when vitamin A was considered as a potential treatment for RP, for instance. In a recent meta-analysis, the effectiveness of vitamin A was uncertain because the treatment outcomes varied widely across studies.27–34 One reason for the contradicting results was the different visual function assessments across the studies.34 Even visual acuity was often used for the assessment of visual function. However, visual acuity mainly reflects the retinal function around the fovea and tends to be insensitive to the disease severity.35 In contrast, we recently showed that the structural damage in RP, such as fundus autofluorescence, was more accurately measured by VF sensitivity34 35 using the HFA 10–2 test.36 The current results will be useful when assessing the effects of any candidate treatment on the progression of VF with the HFA 10–2 test. In addition, as suggested in a previous study, visual disability is closely associated with HFA 10–2 test results,5 and the current results will be useful when predicting patients’ future daily lives using the HFA 10–2 test.
The absolute prediction error was not significantly improved using the quadratic regression or the robust regression compared with the OLSLR. This is in agreement with our previous study in patients with glaucoma using the HFA 24–2 test, which found no merit in using the non-linear regression models at the clinical level.12 In the current study, only reliable VFs were investigated (determined as fixation losses of <20% and false-positive responses of <15%). A further study would be needed to assess the usefulness of non-linear regressions in VF series with unreliable VF measurements. However, the merit may only be marginal. All regression models assume that the distribution of VF errors is normally distributed. However, unreliable VFs may not be normally distributed.
The variability of VF tests may be high when VF damage is advanced.37 However, almost no association was observed between the prediction accuracy and disease stage in the initial VF (table 3) and also the rate of VF progression (table 2).
One of the limitations of the present study is that genetic information was not considered. RP is genetically heterogeneous, and genetic testing can direct prognosis and clinical management. For instance, variants in many genes, including ABCA4,38 PRPH239 40 and PROM141 genes, are associated with various phenotypes. A better understanding of the influence of genetics on the VF progression rate would be beneficial. This is particularly important in identifying individuals who could benefit from retinal gene therapy.42 In addition, we did not investigate the effect of macula oedema in the current study, which should be analysed in a future study.
In conclusion, the minimum number of VFs required to obtain accurate predictions of future VF test results in a PW manner was 5 or 6. The prediction error cannot be significantly improved by using other non-linear regression methods.
Data availability statement
Data are available upon reasonable request. NA.
Ethics statements
Patient consent for publication
Ethics approval
This study was approved by the Research Ethics Committee of the Graduate School of Medicine and Faculty of Medicine at the University of Tokyo and Kyoto University. The study complied with the tenets of the Declaration of Helsinki. Written informed consent was given by patients for their information to be stored in the hospital database and used for research. Otherwise, based on the regulations of the Japanese Guidelines for Epidemiologic Study 2008 (issued by the Japanese Government), the study protocols did not require that each patient provide written informed consent. Instead, the protocol was posted at the outpatient clinic and/or website of the department to notify study participants.
References
Footnotes
Contributors Conceptualisation: RA, AO and TI. Data curation: RA, MM and YF. Formal analysis: RA. Methodology: RA and HM. Supervision: All authors. Writing original draft: All authors. Review and editing: All authors. Guarantor: RA
Funding This study was supported in part by grants (numbers 20K09785, 20K18337, 19H01114, 18KK0253 and 20K09784) from the Ministry of Education, Culture, Sports, Science and Technology of Japan and The Translational Research programme; Strategic Promotion for practical application of Innovative medical Technology (TR-SPRINT) from the Japan Agency for Medical Research and Development (AMED); grant JPMJCR19U4 AIP acceleration research from the Japan Science and Technology Agency; and a grant from the Japanese Retinitis Pigmentosa Society (JRPS).
Competing interests None declared.
Patient and public involvement Patients and/or the public were not involved in the design, or conduct, or reporting, or dissemination plans of this research.
Provenance and peer review Not commissioned; externally peer reviewed.