Article Text

Abstract
Objective To investigate the relationship between the preoperative morphology of the foveal avascular zone (FAZ) and postoperative visual function in patients with idiopathic epiretinal membrane (ERM).
Methods and analysis This retrospective study enrolled 36 patients who underwent a unilateral internal limiting membrane peeling with vitrectomy for idiopathic ERM. We measured the area of superficial FAZ in the eyes with ERM and in the contralateral control eyes preoperatively and at 6 months postoperatively using optical coherence tomography (OCT) angiography. The ERM stage was measured using swept-source OCT. We evaluated the FAZ area ratio (preoperative FAZ of the ERM eye/FAZ of the control eye) to indicate the degree of FAZ contraction in the ERM eyes compared with the control eyes. The correlations between the FAZ area ratio and postoperative visual function and changes in macular morphology were assessed.
Results Preoperative mean best-corrected visual acuity (BCVA) significantly improved from the logarithm of the minimum angle of resolution 0.20±0.24 to 0.01±0.13 at 6 months postoperatively (p<0.01). The mean area of the FAZ increased significantly from 0.06±0.07 mm2 preoperatively to 0.09±0.07 mm2 after vitrectomy (p<0.01). FAZ area ratio showed significant negative correlations with changes in BCVA (r=−0.44, p<0.01) and the ERM stages (r=−0.56, p<0.01).
Conclusion The FAZ is reduced as ERM progresses and enlarges after vitrectomy. The FAZ area ratio based on preoperative FAZ may predict postoperative visual acuity.
- retina
- treatment surgery
This is an open access article distributed in accordance with the Creative Commons Attribution Non Commercial (CC BY-NC 4.0) license, which permits others to distribute, remix, adapt, build upon this work non-commercially, and license their derivative works on different terms, provided the original work is properly cited, appropriate credit is given, any changes made indicated, and the use is non-commercial. See: http://creativecommons.org/licenses/by-nc/4.0/.
Statistics from Altmetric.com
Key messages
What is already known about this subject?
In the epiretinal membrane (ERM), preoperative impairment of macular laminar structure correlates with postoperative visual function.
What are the new findings?
The degree of preoperative foveal avascular zone (FAZ) contraction in the ERM eye relative to the preoperative contralateral eye correlates with the degree of postoperative visual improvement.
How might these results change the focus of research or clinical practice?
The preoperative FAZ could be an indicator of visual prognosis and can help determine patients’ readiness for surgery.
Introduction
Epiretinal membrane (ERM) is a common macular disease that causes fibro cellular proliferation of the internal limiting membrane (ILM), leading to macular morphological disturbance, metamorphopsia and loss of vision. The incidence of ERM is 12.1% among Asians, and the risk increases with age and long axial length.1 Treatment involves vitrectomy to reduce traction on the retinal surface caused by ERM and to improve macular morphology and restore visual function.2 3 The ILM is peeled during surgery to prevent the recurrence of ERM.4 Since the 1990s, optical coherence tomography (OCT) has been indicated for the diagnosis of macular diseases.5 OCT enables detailed observation of the retinal structures and correlation of visual acuity with impairment of the outer retinal layer; for example, the morphologies of the ellipsoid zone and interdigitation zone in the central fovea were first reported as prognostic factors for ERM.6–10 Furthermore, OCT has been used to show the correlation between structural changes and metamorphopsia such as the appearance and thickening of an ectopic inner retinal layer in the fovea due to ERM traction,11–15 and changes in the inner retinal layer affecting the pathway of blood vessels in this layer.12 16 Although the relationship between the ERM-associated visual function of the outer and inner layers has been reported using OCT, there is no consensus on the severity of ERM and optimal timing of surgery.14 Recently, OCT angiography (OCTA) has emerged as a minimally invasive method that enables detailed observation of the retinal blood vessels. It is widely used to evaluate diseases characterised by damage to the retinal blood vessels, such as branch retinal vein occlusion and diabetic retinopathy. It also helps assess the morphology of the foveal avascular zone (FAZ), a circular non-vascular area found in the macula in such diseases.17 18 Although the FAZ enlarges after ERM surgery,19 the differences between preoperative and postoperative FAZ morphology and visual function are unclear. Therefore, in this study, we retrospectively investigated the changes that occurred in the FAZ after vitrectomy for ERM and evaluated their relationship with visual function and macular morphology.
Materials and methods
Study recruitment/population
All patients underwent unilateral 25G-ILM or 27G-ILM peeling combined with pars plane vitrectomy for idiopathic ERM with normal contralateral eyes from November 2017 to February 2020 at the Niigata University Hospital. All subjects completed at least 6 months of follow-up. Exclusion criteria were secondary or bilateral ERM, intense myopia with an ocular axis greater than 26.5 mm, age younger than 20 years, a history of ocular surgery other than cataract removal, postoperative complications such as retinal detachment or endophthalmitis that required reoperation, and diseases that impair the quality of OCT images (eg, cataract of more than Emery-Little classification grade III, glaucoma, diabetic retinopathy). All patients underwent comprehensive ophthalmological evaluations, including measurement of best-corrected visual acuity (BCVA), metamorphopsia test (M-CHARTS; Inami, Tokyo, Japan), slit-lamp biomicroscopy, swept-source OCT (SS-OCT) and OCTA. All the tests required for the analysis were performed before surgery and at three and 6 months after surgery. The patients’ normal contralateral eyes were evaluated as controls because the morphology of the FAZ may be affected by age.20
OCTA measurement of the FAZ
We analysed the FAZ from the OCTA scans of 3×3 mm areas centred on the fovea obtained using the Cirrus HD-OCT 5000 scanner (Zeiss Meditec, Dublin, California, USA). We measured the FAZ for the superficial layers, lying between the ILM and the inner plexiform layer, which were automatically displayed by the built-in software of the OCTA device. Blurred OCTA images were excluded from the analysis even if motion-correction technology was used.
Each image was checked by two fully trained examiners (HY and HT). If the FAZ required correction, the measurements were made manually. Two fully trained examiners (HY and HT) who were blinded to patient details interpreted the macular microstructure from the OCTA and SS-OCT images. Images were, and measurements were acquired preoperatively for both the eyes and at 6 months postoperatively for the ERM eyes.
FAZ area ratio of the FAZ
The FAZ in both eyes of healthy adults is of the same size.21 Using the fellow eye as control, we defined the FAZ area ratio as the ratio of the FAZ area of the preoperative ERM and control eyes.
FAZ area ratio=preoperative FAZ of the ERM eye/FAZ of the control eye (figure 1).

Representative images from OCTA and swept-source OCTA. Representative images from a woman in her early 60s with ERM stage 3. Images of the FAZ (yellow area on images) and measurement range (purple dotted line, the internal limiting membrane to the inner plexiform layer) of (A) the control eye, where the preoperative FAZ was 0.20 mm2; (B) the eye with ERM, where the preoperative FAZ was 0.03 mm2, and the FAZ area ratio was 0.15; and (C) the eye with ERM 6 months postoperatively, when the postoperative FAZ was 0.06 mm2. (D) Preoperative macular morphology indicated ERM stage 3. (E) Postoperative macular morphology. ERM, epiretinal membrane; FAZ, foveal avascular zone; OCTA, optical coherence tomography angiography.
SS-OCT evaluation
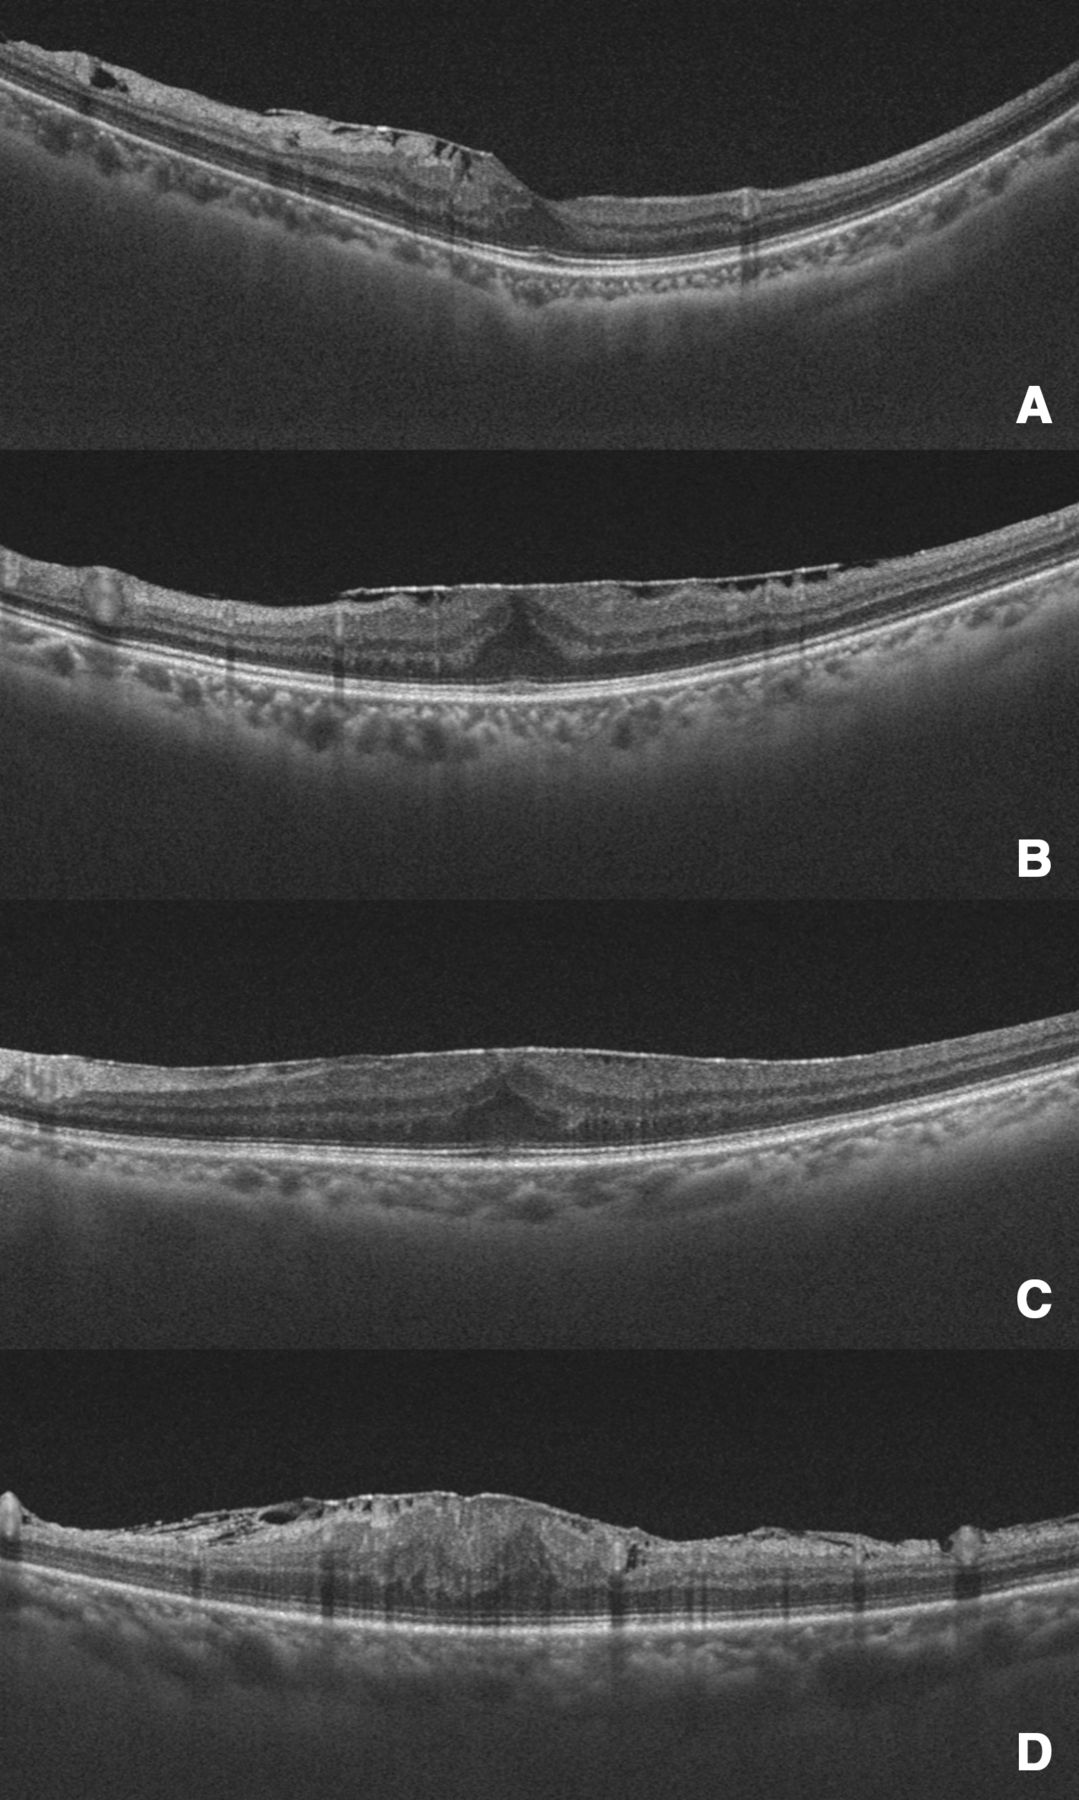
We analysed the morphology of macular using the SS-OCT scanner (DRI OCT one Topcon, Tokyo, Japan). We evaluated the preoperative ERM stage based on the 12 mm radial scan mode images using the criteria suggested by Govetto et al14 (figure 2).
Representative images from different epiretinal membrane stages. (A) Stage 1 shows the presence of the foveal pit and well-defined retinal layers, (B) stage 2 shows a loss of the foveal pit but with well-defined retinal layers, (C) stage 3 has the features of stage 2 with ectopic inner foveal layers and (D) stage 4 shows loss of the foveal pit with ectopic inner foveal layers and disrupted retinal layers.
Correlation of the FAZ area ratio with visual function and ERM stage
We examined the correlation of the FAZ area ratio with preoperative and postoperative visual acuity, changes in BCVA, horizontal and vertical scores of M-CHARTS and the ERM stage.
Vitrectomy with ILM peeling
All surgeries were performed at our hospital by one of five experienced vitreoretinal surgeons (HY, HT, HH, NM and HN). The ERM and ILM were removed using standard 3-port 25-gauge or 27-gauge pars plana vitrectomy. We first performed phacoemulsification and implantation of a posterior-chamber intraocular lens for all phakic eyes. Core vitrectomy and injection of triamcinolone acetonide (TA) into the vitreous cavity were performed, creating a posterior vitreous detachment in cases where there was no detachment. Next, the ERM and ILM in the macula were stained using TA or 0.05% indocyanine green and peeled up to the vascular arcades. Fluid-gas exchange was performed where intraoperative retinal breaks occurred.
Statistical analysis
We compared the mean scores and calculated the SD for visual acuity, M-CHARTS score, and retinal microstructure before surgery and 6 months after surgery. BCVA was converted to the logarithm of the minimum angle of resolution (logMAR) using decimal visual acuity values. We used the Early Treatment Diabetic Retinopathy Study (ETDRS) letter score for preoperative and postoperative visual acuity changes. The Wilcoxon signed-rank test was used to compare preoperative and postoperative data. The correlations of BCVA, M-CHARTS score, ERM stage and changes in BCVA, with the FAZ area ratio, were analysed using Spearman’s correlation coefficient. All statistical analyses were performed using SPSS V.25.0, and p values of <0.05 were considered statistically significant.
Results
We enrolled 36 participants in this study. Table 1 shows the baseline clinical characteristics and visual acuity in patients with ERM.
Baseline clinical characteristics of patients with epiretinal membrane
Visual function and morphology before and 6 months after vitrectomy
Table 2 details the visual functions and morphology of the ERM eyes before and 6 months after vitrectomy. The mean BCVA and vertical and horizontal M-CHARTS scores significantly improved 6 months after surgery compared with their preoperative values (p<0.01). The FAZ of the ERM increased significantly after vitrectomy. Figure 1 shows a representative case of ERM stage 3 in which the FAZ was contracted compared with the contralateral eye (FAZ area ratio, 0.15) preoperatively. However, postoperatively, the FAZ enlarged.
Visual function and morphology before and 6 months after vitrectomy
Correlations between the FAZ area ratio and visual function
Table 3 shows the correlations between the FAZ area ratio and visual function. The FAZ area ratio showed a significant negative correlation with changes in the ETDRS letter score (r=−0.44, p<0.01), preoperative visual acuity and the ERM stage. However, it had no significant correlation with the vertical or horizontal M-CHARTS score and postoperative visual acuity.
Correlations between the FAZ area ratio and visual function
Discussion
Vitrectomy with ILM peeling for ERM can improve visual acuity and horizontal and vertical metamorphopsia. Furthermore, FAZ was significantly enlarged postoperatively in this cohort. These findings stand in contrast to those of a Japanese study by Okawa et al, involving 20 patients, wherein no significant postoperative enlargement of the FAZ was reported.22 The lack of FAZ enlargement was believed to be due to the contraction of the retina after surgery due to ILM peeling. Compared with our present findings, the mean preoperative visual acuity in their study22 was better, suggesting mild FAZ contraction, which could explain the lack of its enlargement. In this study, most eyes with no postoperative FAZ enlargement were ERM stage 2 or below, suggesting that the postoperative FAZ enlargement depended on the preoperative severity of ERM. The preoperative FAZ area was smaller in all ERM eyes compared with the corresponding control eyes. However, 6 months postoperatively, the FAZ area was significantly enlarged, yet remained contracted compared with the control eyes. The negative correlation between the FAZ area ratio and ERM stage (table 3) suggests that the morphology of the retina changes both vertically and horizontally due to the force of afferent contraction caused by ERM. Vertical morphological changes involve changes in the structure of the retinal layer, including the appearance of the ectopic inner retinal layers in the fovea or disruption of the retinal layers, as ERM progresses. Horizontal changes are a result of contraction of the retinal surface and include contraction of the FAZ or retinal folds. Govetto et al reported a significant correlation between the ERM stage and preoperative and postoperative visual acuity, attributed to the development of an ectopic inner foveal layer as ERM progressed, which caused damage to the photoreceptor cells and outer retinal layers.14 23 However, we found that the FAZ area ratio showed a significant negative correlation with preoperative visual acuity, but not with postoperative visual acuity. Overall, we found that the mean postoperative visual acuity was good, which could explain the lack of its correlation with the FAZ area ratio. Further evaluation of cases with greater variation in ERM stages is necessary and warranted to confirm our findings.
We identified a significant negative correlation between the FAZ area ratio and degree of improvement in visual acuity after surgery (table 3). The FAZ area ratio also correlated with the degree of improvement in visual acuity for the entire ERM stage. Although an association between the ERM stage and visual outcomes has been reported,14 23 in our study, a higher preoperative FAZ contraction rate, that is, a lower FAZ area ratio was associated with a more significant improvement in visual acuity. Thus, we propose that the FAZ area ratio may be an indicator of visual prognosis and may help determine the patients’ readiness for surgery. ERM may disrupt the ellipsoid zone and affect the prognosis of visual acuity.8 In this study, we detected the disruption of the ellipsoid zone in one patient with ERM stage 4. The risk of the ellipsoid zone disruption increases as the ERM stage progresses,14 and a smaller FAZ area ratio (more contracted FAZ) is associated with increased mechanical stress on the outer layer of the retina. Therefore, the removal of this stress by surgery may have significantly improved the patients’ visual acuity in this study. This suggests that in cases where the ERM is only associated with FAZ contraction but has not yet progressed to ellipsoid disruption, surgery can significantly improve the visual acuity.
ERM causes afferent contractions in the macula and structural changes in the inner retinal layer11–15; the latter believed to be due to polarisation of Muller cells, which affects the position of the photoreceptor cells and leads to visual dysfunction such as metamorphopsia and aniseikonia.13 Several studies have reported correlations between the intraretinal granular layer thickening and preoperative and postoperative metamorphopsia.11 13 15 Vessels in the superficial retina are located in the ganglion cells and nerve fibre layers, whereas those in the deeper layers are located in the inner nuclear layer.14 This would suggest that metamorphopsia involves changes in retinal vascularisation; however, we did not observe a correlation between the change in the FAZ and metamorphopsia or between the FAZ area ratio and postoperative M-CHARTS score. Kitagawa et al reported a lack of correlation between the area of the superficial-layer and deep-layer FAZ and postoperative metamorphopsia and minimal postoperative FAZ enlargement.19 Detailed segmentation of the layer structure is difficult using the Cirrus HD-OCT 5000 scanner; therefore, we analysed only the superficial-layer vascular network of the retina (ILM-IPL) and not the deep-layer vascular network. This may be why we did not observe a correlation between the change in the FAZ and metamorphopsia. On the other hand, it has been reported that aniseikonia, which is the main symptom of ERM as well as metamorphosia, correlated with FAZ area ratio.24 Future studies with a larger number of patients and using equipment with the ability to analyse the deep retinal vascular network in detail, particularly in cases that exhibit large enlargements of the FAZ, are needed to clarify this point. Chen et al reported that afferent traction of the macula due to ERM impairs visual function by creating an imbalance in which the density of vessels is increased in the inner retinal layer of the fovea and decreased in the parafovea. Surgical release of traction was reported to correct the imbalance and improve visual acuity.25 The relationship of vascular density/imbalance with visual function warrants further investigation in the future.
This study has some limitations that should be acknowledged. First, this was a retrospective study with a small number of cases and a short follow-up period. Second, because ERM involves disruption of the retina’s layered structure, blurred images are removed, but segmentation errors may have occurred during the FAZ analysis. In the future, more cases should be analysed using OCTA, which enables more precise segmentation of the structures, including the deep retinal vessels.
Conclusion
The FAZ gradually reduced as ERM progressed and enlarged significantly after vitrectomy. The FAZ area ratio based on the preoperative FAZ is an indicator of postoperative visual acuity.
Acknowledgments
We would like to thank Editage for English language editing.
References
Footnotes
Contributors Conceptualisation: HY, HT. Data curation: HY, HT. Formal analysis: HY, HT. Investigation: HY, HT. Methodology: HY, HT. Project administration: HT, TF. Resources: HY, HT, EU, HH, NM, HN, TF. Software: HY. Supervision: HT, TF. Validation: HY, HT, EU, HH, NM, HN, TF. Visualisation: HY. Writing—original conscription: HY. Writing—review and editing: HT.
Funding The authors have not declared a specific grant for this research from any funding agency in the public, commercial or not-for-profit sectors.
Competing interests None declared.
Patient and public involvement Patients and/or the public were not involved in the design, or conduct, or reporting, or dissemination plans of this research.
Patient consent for publication Not required.
Ethics approval This study and all its protocols (2017-0300) were approved by the Research Ethics Committee of the Niigata University Hospital and followed the tenets of the Declaration of Helsinki. Written informed consent was obtained from all participants before enrolment, and they were informed about the use of their data. Patients or the public were not involved in the design, conduct, reporting or dissemination of our research.
Provenance and peer review Not commissioned; externally peer reviewed.