Article Text

Abstract
Objective Meibomian gland dysfunction (MGD) is a primary cause of dry eye disease. Analysis of MGD, its severity, shapes and variation in the acini of the meibomian glands (MGs) is receiving much attention in ophthalmology clinics. Existing methods for diagnosing, detection and analysing meibomianitis are not capable to quantify the irregularities to IR (infrared) images of MG area such as light reflection, interglands and intraglands boundaries, the improper focus of the light and positioning, and eyelid eversion.
Methods and analysis We proposed a model that is based on adversarial learning that is, conditional generative adversarial network that can overcome these blatant challenges. The generator of the model learns the mapping from the IR images of the MG to a confidence map specifying the probabilities of being a pixel of MG. The discriminative part of the model is responsible to penalise the mismatch between the IR images of the MG and confidence map. Furthermore, the adversarial learning assists the generator to produce a qualitative confidence map which is transformed into binary images with the help of fixed thresholding to fulfil the segmentation of MG. We identified MGs and interglands boundaries from IR images.
Results This method is evaluated by meiboscoring, grading, Pearson correlation and Bland-Altman analysis. We also judged the quality of our method through average Pompeiu-Hausdorff distance, and Aggregated Jaccard Index.
Conclusions This technique provides a significant improvement in the quantification of the irregularities to IR. This technique has outperformed the state-of-art results for the detection and analysis of the dropout area of MGD.
- imaging
- vision
- retina
- iris
This is an open access article distributed in accordance with the Creative Commons Attribution Non Commercial (CC BY-NC 4.0) license, which permits others to distribute, remix, adapt, build upon this work non-commercially, and license their derivative works on different terms, provided the original work is properly cited, appropriate credit is given, any changes made indicated, and the use is non-commercial. See: http://creativecommons.org/licenses/by-nc/4.0/.
Statistics from Altmetric.com
Key message
What is already known about this subject?
Meibomian gland dysfunction (MGD) is a primary cause of dry eye disease. Detection, quantification and analysis of meibomian gland (MG) is required.
What are the new findings?
The proposed method can quantify and analyse MG better than existing automatic methods.
How might these results change the focus of research or clinical practice?
The results show that automatic analysis of the MGD is on par with the manual analyses methods.
Introduction
Meibomian or glandulae tarsales refers to particular sebaceous glands along the rims of eyelids. There are about 30–40 meibomian glands (MGs) in the upper eyelid and 20–30 in the lower eyelid. These glands secrete oil known as meibum over the ocular surface of the eye to stabilise the tear film in order to keep the surface of the eye wet, comfortable and maintain the surface for visual acuity. Meibomianitis is the obstruction or alteration in location, morphology of the MGs, and meibocyte depletion so that they are unable to secrete meibum into tears. This attributed waning of quantity and quality of their excretion and deficiency in tear’s film lipid layer as a result tears get evaporated too rapidly which lead to a condition known as the evaporative dry eye.1 2 Meibomianitis often contributed to dry eye and blepharitis. Besides this, it leads to the formation of free fatty acid which causes punctate keratopathy. Meibomianitis is often observed in women. The factors that contribute to this disease are age, hormones, allergic conjunctivitis, high cholesterol and triglycerides, autoimmune diseases like rosacea, lupus and arthritis. Healthy glands give a visual appearance like a grapes-cluster attached to a central stalk. MG is composed of acinar cells with a central duct that opens at eyelid margin on to the mucocutaneous junction. Illumination of lid margins reveals anatomical variations in normal and abnormal meibomian gland dysfunction (MGD). Healthy individuals show grapes like acini clusters that make longer MG. While MGD patients possess laxity or enlargement of the glands as well as gland dropout and atrophied glands.
Accurately diagnosing meibomianitis, its severity, and variations in the acini of the MG is very significant in the clinical setting. The binocular slit-lamp is a non-invasive standard diagnostic procedure that allows a stereoscopic magnified view of the anterior and posterior structure of eyes that is, cornea, iris, eyelid, conjunctiva, natural crystalline lens and sclera. Typical dyes like fluorescein, rose bengal and lissamine green, reveals some features of the ocular surface. Topical vital stains are very helpful in determining the tear and ocular surface abnormalities related to MGD. Lipid layer interferometry is a method that is used for diagnosing the presence and severity of MGD and analyse the tear stability by measuring the thickness or depth of the lipid layer and by imaging the surface contour of the tear film.
Meibometry is a method for quantifying the meibum level at the eyelid margin.3–5 Studies have revealed MGD alter the basal meibum level. A meibum’s sample from the eyelid margin is transferred to a special tape. The specialised tap transparency alters when exposed to meibum. The basal meibum level is analysed photometrically by measuring the level of variation in the transparency of specialised tap. However, this technique is vulnerable to inconsistent quantification due to apparent diffuse or focal association of MGD in the given eyelid.
Meibography is an in vivo and specialised imaging technique used for assessing the morphology of MGs.6–9 It was first introduced by Tapie in 1977 who used ultraviolet wood light to fluoresce meibomian ducts. The meibography and posterior eyelid biopsy can directly observe the architecture of MG. Meibography is an in vivo, a non-invasive analysis that allows the microscopic and gross analysis of the architecture of MG. In contrast to this, a biopsy is ex vivo, an invasive analysis, and patients are reluctant to undergo such procedures.
Meibography images are analysed for the quantification of the MG architecture. Meibography is divided into two types that is, contact and non-contact. The contact method involves the application of direct light on to the skin for partial lid eversion and transillumination of eyelid pursued by imaging with the specific camera.10 Non-contact meibography is faster, user friendly. It also tries to overcome the problem of lid manipulation and patient uneasiness.11 This practice provides a greater view of the surface area of the eye as compared with the everted eyelid. As a result, it needs less number of images to merge and create a panoramic view. In Arita et al,12 the authors introduced an advance mobile pen-shape system for meibography. It is capable of taking images and videos of MGs by using infrared LED (light emitting diode). Advance technologies have already been introduced with the capability to determine the microscopic level features of MG that is, optical coherence, infrared and laser confocal meibography.
MGs images are created using meibography. Healthy and normal MGs appear on infrared meibography as hypoilluminescent grapes like clusters, duct and underlying tarsus are hyperilluminescent.6 Abnormal glands are characterised by a dilated duct, torturous and enlarged gland size.13 A thorough examination of meibographic images is required for assessment and comparison of the eyelid. Grading is done in order to record the treatment and progression in MGs. In infrared meibography, meiboscoring and meibograding are done to quantify MD morphology. Sirius corneal topographic device along with Phoenix-Meibography imaging software is used for non-contact meibographic analysis.14 This analysis provides data for pupillography, anterior chamber depth, corneal and lens thickness, elevation, curvature, and corneal surface over the diameter of 12 mm. Phoenix system provides the data for dropout by percentage and group the dropout by a scale within an area highlighted by freehand tools.
Accurate gland and intergland segmentation is vital for automated diagnosis. Automated assessment needs precise detection of glands, interglands and midline boundaries. In Prabhu et al,15 the authors performed segmentation of MG from IR images based on deep neural networks. They enhance the quality of MG IR images by CLAHE (contrast limited adaptive histogram equalisation). They employed the U-net network which uses the self-learnt features to differentiate between healthy and MGD affected eyes. They evaluate their performance against various clinically relevant metrics and concluded that the automatic segmentation of MGs is very close to the results derived from the ground truth.16 Developed an algorithm based on the pyramid scene parsing network17 to segment the MG atrophy regions and eyelid from meibographic images. A dataset composed of 706 meibography images annotated with atrophy regions and eyelid, were used for this study. They reported 95.6% on an average meiboscore grading accuracy, surpassed the leading clinical investigator and clinical team by 16% and 40.6%, respectively. Their models achieved an accuracy of 95.4% and 97.6% for atrophy and eyelid segmentation. Sachiko et al18 experimented with nine different deep neural network models (InceptionV3, DenseNet-201, DenseNet-169 and VGG16) to automatically classify the healthy and obstructive MG from vivo laser confocal microscopy images. The DenseNet-201 produced the best results. They constructed ensemble deep learning models and reported an improvement in the results.
We aimed to employ such algorithms to detect MG from IR images, enhance images in such a way that it becomes easier to examine the MG structure. In this study, we focused to develop a new detection method based on applied artificial neural network that is, CGAN (conditional generative adversarial neural network) to evaluate the MG’s loss in SIRIUS infrared meibographic photographs and made a comparison with manual analysis and automated adopted approaches.
Automatic MG analysis
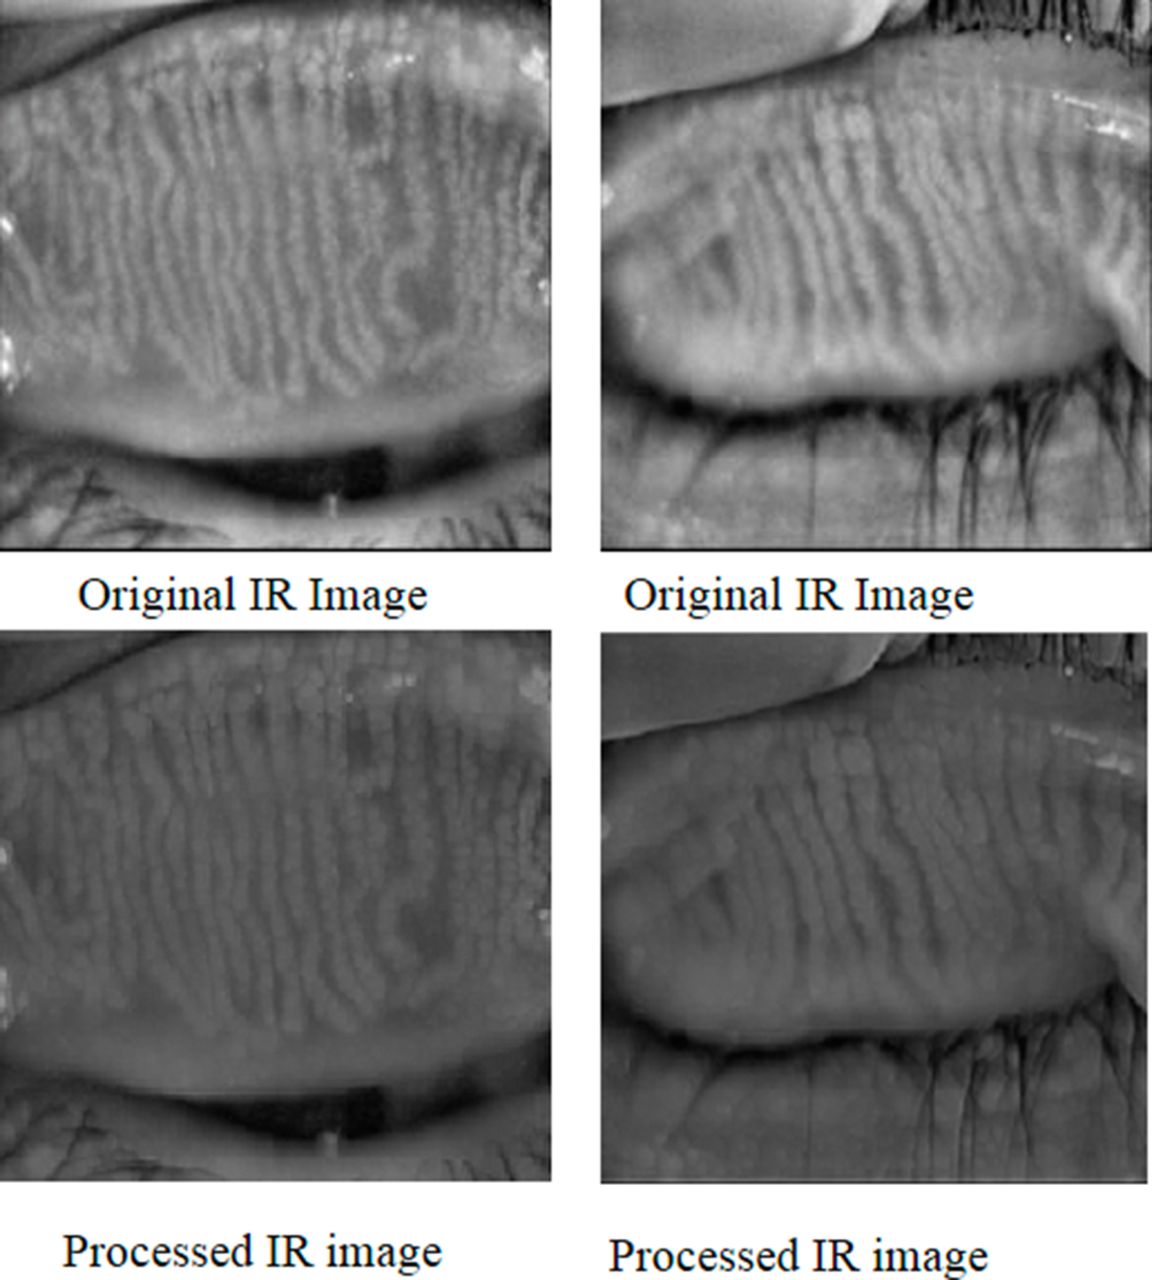
The IR images of the inner eyelids shown in figure 1 make automatic detection of the MGs a very challenging task due to various features that is, specular reflections, wet and smooth surface, low contrast of, among gland and non-gland regions, non-uniform illuminations and several other ocular surface irregularities. In spite of all these the glandular regions have higher brightness and reflectance than the adjacent non-glandular area. Because of these irregularities, conventional procedures that is, threshold, region based, edge based method and so on are inappropriate for segmenting the glandular, non-glandular and inner-glandular regions.

Shows original and processed IR images of inner eyelids. IR, infrared.
Generative adversarial neural network
Ian Goodfellow in 2014 developed a class of artificial neural networks that are known as generative adversarial networks (GANs). GANs are basically two networks pitting against each other (thus the ‘adversarial’). GANs have the potential to mimic any data distribution and create worlds eerily in any domain that is prose, speech, images, music and so on like ours. GANs are a very active area of research and there are various implementation of GANs that is, CGANs, vanilla GAN, deep convolutional generative adversarial networks and super resolution GANs and so on. GANs can be broken down into two pieces that is, generator and the discriminator. Both of them are neural networks and run in a competitive fashion during the training phase. The generator tries to find the data distribution and the discriminator tries to estimate the probability of input data. Both generator and discriminator required training simultaneously, need parameter adjustment for generator and discriminator to minimise the  , and
, and  . The GANs are developed as a mini-max game in which the discriminator wants to minimise its reward
  and the generator wants to maximise its loss. Its mathematical dynamics are represented by equation 1.
 (1)
(1)
g, d represent the generator and discriminator,  is the value function,
  shows data distribution,
  represents prior noise distribution and x is data in equation 1. We employed supervised a deep conditional generative adversarial neural network which is based on empirical knowledge from very popular GAN.19
CGAN for detection
The challenging task in MG detection is the segmentation of glands boundaries, and various features that is, specular reflections, wet and smooth surface, low contrast of, among gland and non-gland regions, non-uniform illuminations and several other ocular surface irregularities. The convolutional neural network tends to minimise pixel-wise loss. A misclassified pixel is not so significant for the overall loss but leads to various MG segmented as one. Contour prediction,20 distance map regression21 methods tried to mitigate this problem. In order to enforce spatial contiguity, conditional random fields (CRFs) are widely used for image segmentation problems as a post-processing step.22 A combination of CNN (convolutional neural network) and CRFs models have been employed to explore context-aware and global CNN training but this approach is limited to pair-wise CRFs and second-order potential, while higher order statistics are very useful in segmentation of images.23 24 Adversarial training has the capability to incorporate the higher-order consistency (not limited to unary or pair-wise like CRFs). These models have field-of-view which is a larger image portion that can incorporate higher-order potentials that cannot be enforced by CRF through a pair-wise term. Adversarial models have the ability to learn appropriate loss which can avoid manually engineered loss function.25 Adversarial models learn loss functions by recognising the output as actual or not while training the network to lessen this learnt loss. Usually, the output pixel is treated conditionally independent from other pixels, while CGAN considers a larger receptive field and can learn the context-aware loss.
The proposed CGAN learn mapping M for MG segmentation in which M can accept MG images to their segmentation masks. For training the CGAN for the purpose of MG semantic segmentation with paired data, we employed model with objective function comprises loss function LGAN and per-pixel loss function L1 to castigate both the segmentation errors and pixel’s configuration. The CGAN’s adversarial loss is similar to cycle GAN in which the discriminator network Dm and segmentation network M play a min–max game in order to maximise and minimise the objective, respectively as in equation 2.
 (2)
(2)
The loss of the adversarial network can be construed as structure loss in which M is criticised if the pixel’s configuration is unrealistic in the predicted mask. As the data is in the form of pair, discriminator Dm can see both the MG and predicted mask. The objective of the proposed CGAN can be represented by equation 3.
 (3)
(3)
An additional loss term L1 is employed for stabilising the GAN and to minimise the absolute difference between the predicted output and ground truth. Mathematical dynamics are shown in equation 4.
 (4)
(4)
The objective of the proposed model is represented by following equation 5.
 (5)
(5)
The discriminator Dm works on patch level instead of the entire image and castigate the structure at the patch level. This method draws the attention of the adversarial nets on the parts of the image in which the MGs boundaries and edges are likely to be missed. In the case of overlapping patches, the same MGs of the image take part in the learnt loss many times in various neighbouring environments and contexts. We employed spectral normalisation26 in order to improve the GAN stability which leads to very efficient gradient flow. We used this normalisation technique generator. The proposed model poses the MG segmentation as an image to image translation problems (regression) instead of a classification problem. This facilitates us to learn the complex loss during training between the output and ground truth. The proposed CGAN was trained with the help of gradient penalty and spectral normalisation for MG segmentation. To guide the generator for better prediction we added an extra loss term to the objective loss make the prediction as close to possible to the ground-truth.
Materials and methods
Dataset and preprocessing
We tested the Proposed Model on the MG dataset which is composed of 112 MG images. The training was performed using 90 MG-dataset images of size 640×640. Images were taken with SIRIUS 3D Rotating Scheimpflug Topography system both from lower and upper eyelid with proper focus and eyelid eversion. The examination of all the patients was conducted at the LRBT eye hospital Mansehra. One hundred and twelve patients (46% man and 54% woman) with MGD were diagnosed between June 2017 and August 2019. Patient’s demographics are described in table 1.
Shows most of the patients (72%) with meibomian gland dysfunction were between 40 and 85 years of age, 2% of the patients were between 1% and 20% years and 45% between 21 and 40 years
We used Wallis filter to the raw MG images to enhance the low contrast areas in the image before manual and automatic analysis. The Wallis filter is a particular adaptive filter that produces an edge crispening and local contrast enhancement, by applying an operator which is spatially variant. This kind of filter is particularly useful, for instance, when images present both bright and shadow regions. In order to remove noise, we applied the Gaussian filter that enhances the contrast level and flattens different exposures to achieve similar brightness. We subtracted the resultant MG image from the raw MG image and then applied the Gaussian filter again. We repeated the same process (ie, Wallis filter followed by image subtraction from normalised image) to further reduce contrast inconsistency. Resultant IR images after the application of Gaussian and Wallis filters are shown in figure 1.
Architectural detail
The GAN architecture is composed of a generator and a discriminator. The network takes an input (image) and generates an estimated output. It is designed with empirical understanding from extensively used CGAN (shown in figure 2). The generator is composed of 2 stride-2 convolutions, 12 residual block, 2 functionally constrained convolutions along with stride of  . We employed reflection padding to reduce artefacts. The discriminator is a normal (and well understood) classification model which is composed of three layers and an output of size 70×70 with an ambition to recognise whether the overlapping patches are actual or not. A patch level discriminator has fewer parameters and more comfortably applicable to numerous size images. It has been observed that more residual block is required for large size images for efficient convergence. Spectral normalisation is employed to stabilise the GAN training.
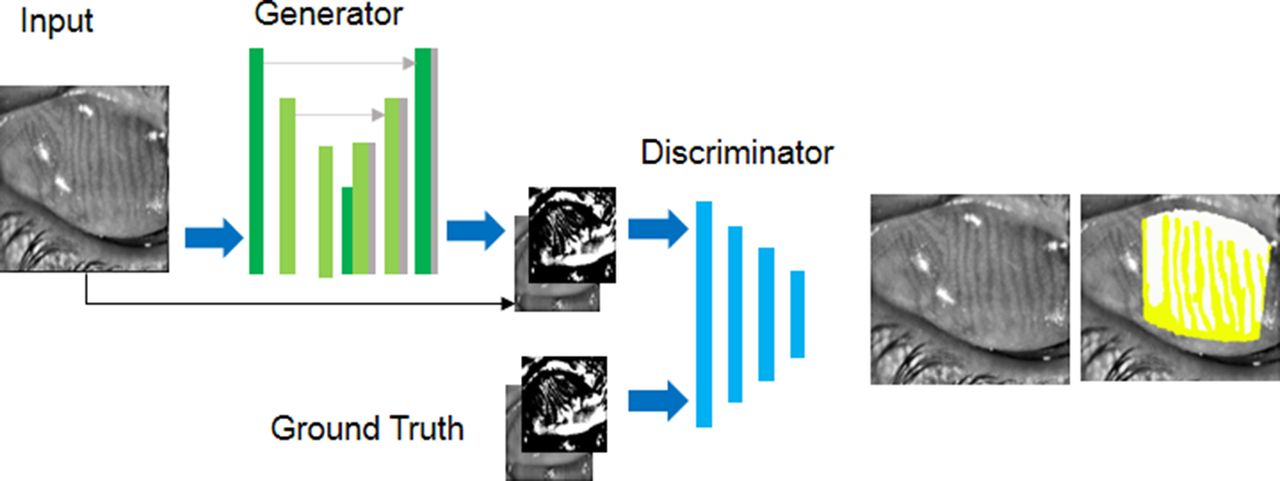
Architecture of proposed conditional generative adversarial network for meibomian gland dysfunction analysis.
Training detail
To evaluate the performance of proposed CGAN we tested the model on MG-dataset, and tasks which include vision task that is, segmentation and graphic task that is, photo-generation. We first made a comparison between the manual and previously adopted automated methods. Finally, we applied our CGAN which demonstrates the advantages of using CGAN for the said problem. For this purpose, we provide annotated MG-dataset images to CGAN. The network was trained from scratch. We used spectral normalisation26 that provides stability to GAN during training. We employed a mini-batch size of 1, the learning rate is 0.0002 for Adam optimiser set for 150 epochs and decay to zero for the rest of the epochs (400 epochs). The training was performed using 90 MG-dataset images of size 640×640. Images were taken SIRIUS 3D Rotating Scheimpflug Topography system both from lower and upper eyelid with proper focus and eyelid eversion. We evaluated the model using 22 images from MG-dataset. For training, we applied random jittering, and to solve the objective loss function we used Adam optimiser. The network was trained from scratch and Gaussian distribution and SD of mean 0 and 0.02, respectively were used for weight initialisation. The discriminator used randomly selected 64 patches from the segmented output and ground-truth. We trained the model on GTX 750 Ti GPU (graphical processing unit) and used the PyTorch library V.0.4.0 which is publically available at Github link https://github.com/pytorch/pytorch. Similarly, code for MGD segmentation is available in online (https://github.com/zakirk2012/cGAN-MGD-segmention).
MGs segmentation
For MG segmentation we employed an encoder–decoder architecture. We added skip connections following the U-net27 general shape, from the encoder to decoder in the generator that is, between the  and the
  layer where n represents numbers of layers and each connection simply concatenates the corresponding layers in the encoder and decoder for the generator. Convolution is used at the end of the decoder to map output segmentation mask pursued by tanh like non-linearities. For the decoder, we used rectified linear units (ReLUs) and applied leaky-ReLUs (leaky ReLUs) for encoder with a slope of 0.2. Markovian discriminator with leaky ReLU and slope of 0.2 and output of 70×70 employed for MG segmentation.
Evaluation metrics and performance measures
To evaluate the visual quality of our work on MG-dataset we employed different techniques. For quantitative analysis, we tried to evaluate model using average Pompeiu-Hausdorff distance (aHD), Aggregated Jaccard Index (AJI) and F1 Score. A criterion for the MG segmentation method should penalise pixel and object level errors that is, over segmentation, false detection of MG, missed detection of annotated objects. Finally, we objectively performed an analysis of MG-GAN and area of the dropout was determined using below mentioned grading scheme28 to justify the performance of our method.
Average Pompeiu-Hausdorff distance
aHD determine how far two subsets of a metric space are from each other. In the case of MG segmentation, it determines the greatest of all the distance from the point in the ground-truth and to the nearest point in the predicted mask. Mathematical dynamics are represented by the following equation.,
 (6)
(6)
 (7)
(7)
Where
The lower values of aHD show that two segmentation masks are close to each other. We calculated aHD for MGD shown in table 2.
Provides comparison of the evaluation metric
Aggregated Jaccard Index
The Jaccard index also called as Jaccard similarity coefficient is a quantitative analysis employed for evaluating the similarity and dissimilarity of sample sets. It extends the global Jaccard index that can determine the aggregated union and aggregated intersection cardinality in the region of interest (ROI). Mathematically it is represented as
 (8)
(8)
Where 
 is the ground truth
  shows prediction and
  represents connected components. Higher values of AJI indicate better performance of the model. The values estimated for MGD analysis represented in table 2.
F1 score
F1 is a function of precision and recall. Mathematical dynamics are represented by the following equation
 (9)
(9)
The higher value of the F1 score implies a good intersection between the predicted value and ground-truth. F1 score for MGD is demonstrated in table 2.
Dropout area and ROI selection
We employed MG-GAN for automatic Selection of the ROI consist of MGs and dropout area (DOA) as shown in figure 3. For automatic identification of MG and DOA, we trained MG-GAN on circumscribed MG images. These images have glands and dropout areas isolated and demarcated by clinicians through hand tools. MG-GAN can extract discriminative features and used these for representation learning, editing and synthesising high-quality images. We generated bounded MGD images and performed various comparative and statistical analyses to justify our results which are discussed briefly below.

Some meibographic images taken from both upper and lower eyelids and analysed with the four automatic and manual detection methods. The green region for manual analysis shows glands region and red represent loss area, while in case of automatic analysis methods white region represents gland area and colour regions represent loss area. Results revealed that the automatic detection method percentage results are almost on par with the manual analysis. In manual analyses, the analyser while putting dots or lines around the glands is more likely to skip some minor regions between the glands while the automatic analysis considers this region in the analysis. The cause of this difference is due to scare tissues and light reflection on the images and system classify them as meibomian glands area. We can see from figure 3 that MG-GAN outperformed state of the art detection methods for MG detection. CGAN, conditional adversarial neural network; GAN, generative adversarialnetwork; MG-GAN, meibomian gland-generativeadversarial network.
Manual analysis and grading
The manual analysis involves marking the borders of tarsus in order to cover at least 90% area of lower and upper eyelids and delineate the MGs by placing dots around the grapes like clusters. As shown in figure 3, the green part represents the area of MGs, and red shows the loss area. After circumscription of MGs, the Phoenix software system generates the measurement of dropout within the area delineated by the freehand tool. Both scale and percentage are used for dropout measurement. According to grading policy grade 0 is assigned for 0 loss, grade I for 1%–25%, grade II for 25%–50%, grade III for 50%–75% and grade IV for 75% and above loss.11 The percentage for loss area and time for analysis for each image is recorded.
Table 3 illustrates the distribution of grades achieved by auto and manual analysis. It is depicted from the table that 45% images from MG-test set belong to grade I and 45% were for grade II. Ten per cent images belong to III and 0% fall in grade IV in manual analysis. As presented in table 3 in automatic analysis 25% and 35% images from test set fall in grade I, 65%, and 55% images in grade II, 10% in grade III, and 0 images in grade IV, respectively for clinician I and II in the automatic analysis.
Distribution of grades
Statistical analysis
We performed statistical analysis with SPSS software available commercially. Mean±SD is used to express data. Shapiro-Wilk test29 is used for verification of normal variable distribution. We performed a comparison of MG-GAN and manual analysis by paired sample t-test. We employed Kappa k analysis30 and Bland-Altman31 to evaluate the agreements between measurements. Pearson correlation analysis32 employed depending on the distribution of variables. Statistically, a p value great than 0.05 is considered as a significant one.
Results
Our proposed method (MG-GAN) finds the ratio of the total MG area relative to the entire analysis area in all subjects as shown in table 4.
Provides manual and automatic analysis of MG using paired-sample t-test
MGs dropout grading base on kappa (k) analysis
Pearson correlation
Pearson correlation is extensively used in pattern recognition, image processing and statistical analysis.32 We performed the Pearson correlation test in order to find the correlation or comparison between manual analysis and automatic analysis of MGs performed by two clinicians, respectively. The test results yields a correlation coefficient of r=0.962, p<0.001 between the automatic and manual analysis by clinician I as in figure 4A. For the clinician II, the test yielded a correlation coefficient of r=0.968, p<0.001 as illustrated in figure 4B.
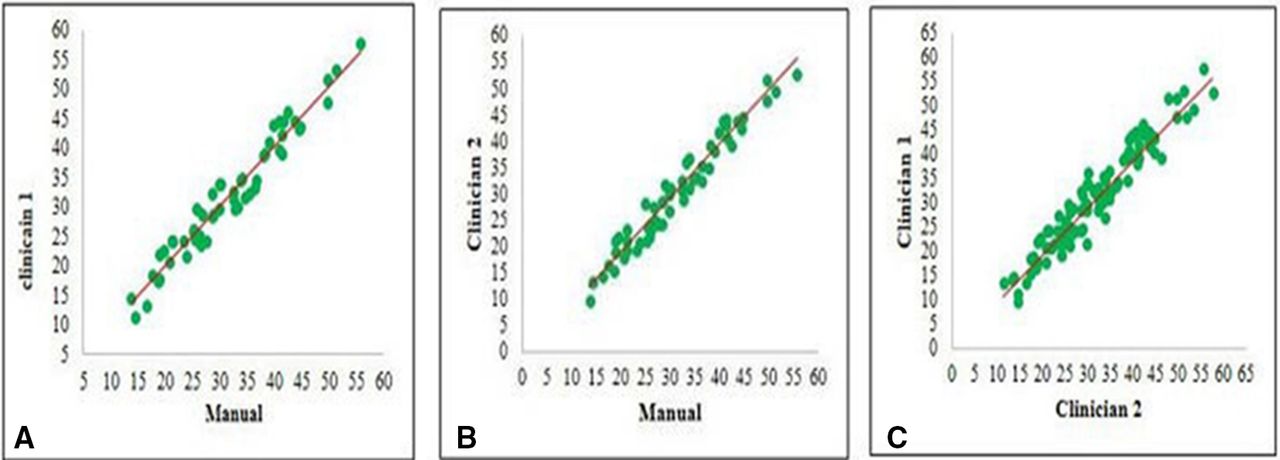
(A) Manual versus meibomian gland-generative adversarial network (MG-GAN) (clinician I) (B) Manual versus MG-GAN (clinician II) (C) clinician I versus clinician I.
Bland-Altman analysis
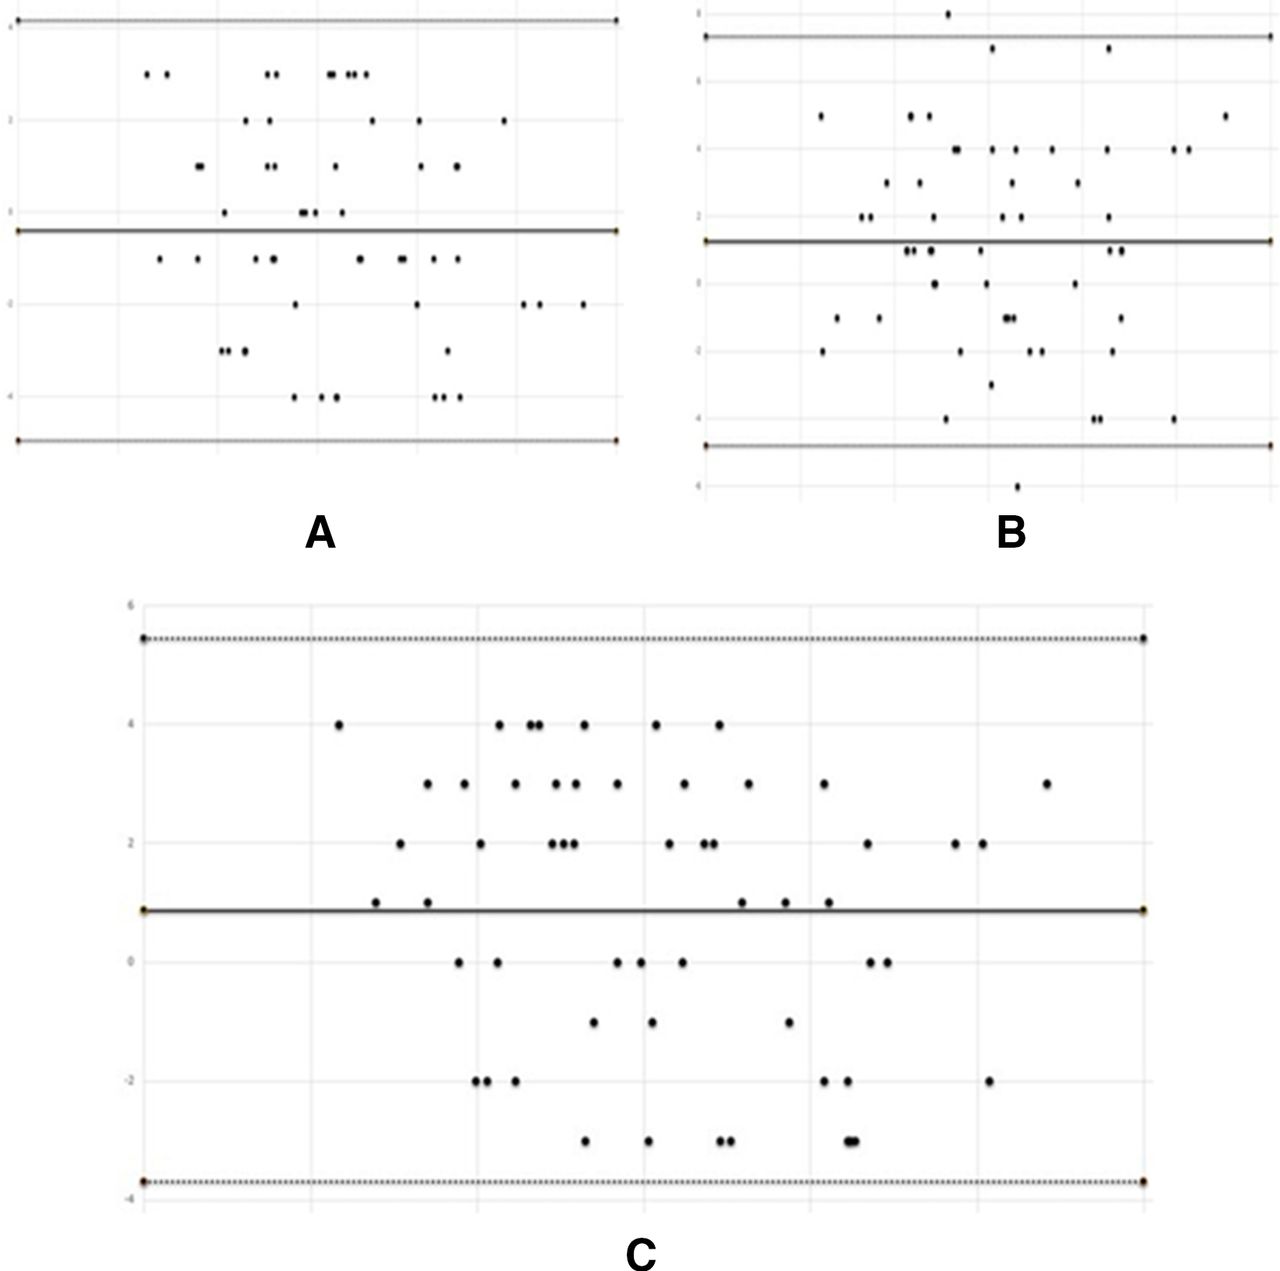
We performed the Bland-Altman analysis31 to measure the consistency between the suggested method (MG-GAN) and manual analysis method by constructing a limit of the agreement as shown in table 5. We extensively evaluated the mean difference or limit of agreement. We measured limit of agreement between manual analysis and MG-GAN by clinician I (see figure 5A) and concluded 96% mean difference between above mention method found to span from −4.95% to 4.16% with an MD of −0.39±2.33 (CCC=0.83) and 95% mean difference between manual analysis and clinician II (see figure 5B) spans from −3.69% to 5.44% with an MD of 0.87±2.32 (CCC=0.848). The 95% mean difference between clinician I and clinician II (see figure 5C) was found to span from −4.81% to 7.35% with an MD of 1.27%±3.10 (CCC=0.97) and −2.79% to 12.80% with an MD of 5%±3.10 (CCC=0.868) for MG-GAN test results obtained by clinician I on 2 days consecutive.
Limit of agreement plot showing the consistency between manual and meibomian gland-generative adversarial network analysis. The average is plotted along x-axis and mean difference along y-axis (A) manual versus clinician I, (B) manual versus clinician II and (C) clinician I versus clinician II.
Demonstrate the Bland-Altman analysis value of k and relative strength of agreement is interpreted as <0.20: poor, 0.21–0.40: fair, 0.41–0.60: moderate, 0.61–0.80: good, >0.81 very good
Discussion
This study demonstrates the objective analysis and automatic identification of the area of the MGs in non-contrast meibographic images. Various studies demonstrated subjective analysis of MG area loss.33 34 Therefore, an objective analysis of MG loss would be very advantageous for the evaluation of sophisticated pathological changes of MGs. Current research describes the MG analysis with the help of J software35 in which the examiner manually defines the gland area of each patient which results in inter-observer variability. In Pult and Riede-Pult,36 authors demonstrated an automatic analysis of the area of the MGs and identify healthy and unhealthy glands but sometimes includes spaces among the neighbouring MG and provides such parameter as the central length of detected MG which need not be part of the MGD.
Our analysis method automatically defines the measurement area and analyse the contours of each MG. This is very useful for the identification of local and subtle variations in MG. It is based on an adversarial pipeline which has a field of view that represents a larger portion of the image rather than just super-pixel or neighbouring pixels. Due to the larger receptive field, it catches more global information. It can capture higher-order statistical consistency that is neither enforced in pixel-wise loss nor measured in CRF using pairwise loss. This makes the model context-aware so that the results are best. The adversarial loss in the CGAN is similar to cycle-GAN. The generator and discriminator component of the proposed model play a minimax game in order to minimise the objective as describes in equation 3. The additional loss term (see equation 4) brings the output closer to ground truth and stabilises the model during training. During the training of the discriminator, the gradient loss is propagated back to the generator to update the parameters. The generator and discriminator are trained alternatively until the discriminator is not able to easily distinguish between ground truth and predicted masks.
Our results indicate that the ratio of the area of the MGs to the entire area decreases substantially as the meiboscore increases. Analysis indicates a profound correlation between the objective measurement and subjective grading of the MG area. Robin et al19 demonstrate the MGD severity and coexistence of many pathological changes, distortion, shorting, narrowing, enlargement and dropout. They concluded that measurement of the MG area may not detect MGD alone in some cases because there is a possibility of enlargement of MG in early diagnosis and shortening and distortion in severe cases. A semi-quantitative scoring system is introduced in Arita et al11 to measure and grade MG’s morphological changes. Grades are assigned based on the involvement of eyelids in pathological changes. Grade 0 is assigned for no eyelid involvement, grade I for 33%, grade II for 34%–66%, grade III for 67% or greater involvement of eyelid in MGD. We made a comparison of total MG area to the entire area of the eyelids with meiboscore.
Meiboscoring system is not suitable for follow-up examinations because the eye might be in the same grade even after treatment and improvement in the MG loss area that is, from 60% to 30%. Therefore, examiners should use the MG loss area percentage despite of grades in their follow-up examinations and comparison of healthy and unhealthy eyes. It is very convenient to take an image of the MG by Sirius Topography while it takes 10–20 min by Phoenix software to circumscribe the MG area by putting lines or dots along the edges of glands and measure the loss area. It is very arduous when the ducts are located non-linearly.
In this article, we proposed a method that can analyse the MGs images (IR images) automatically and compared it with traditional image processing method (adaptive thresholding) and state of the art segmentation methods, that is, Mask R-CNN, GAN, U-net and FCN. It is based on CGAN where we condition on an input image and generate the corresponding output segmented image. GANs have been used very successfully in various medical imaging applications, that is, detection, segmentation and generations. We applied Wallis and Gaussian filter to enhance the low contrast areas in the MG images. We trained the model using an adversarial pipeline which has a large receptive field and captures more global information. We employed long term residual connection to ease model training. A comparison is made with manual and automatic analysis methods and concluded that our approach is very close to manual analysis and outperformed all other automatic analysis methods. We have also applied an end-to-end network based on adversarial learning to MG segmentation that uses CRF to capture higher-order potential. The employed GAN uses FCN to classify MG images at the pixel level. GANs need competition to improve the performance between generator and discriminator. This unguided competition induced instability during training, that is, convergence to local extreme as a result model collapse. In order to contemplate the validity of the MG-GAN analysis, we performed various statistical analyses. MG-GAN analysis represents a very good relation with manual analysis (r=0.96) (p<0.001). The Bland-Altman analysis revealed a 96% limit of agreement between the manual our auto analysis by the clinician (I) was between −4.95% and 4.16% (CCC=0.83) and between −3.69% and 5.44% (CCC=0.848) for the clinician (II) shown in table 5. We observed fair to good agreement between manual and automatic analysis. Intraoperator and interoperator agreements found excellent. We gauge the performance of our model using aHD (average Pompeiu-Hausdorff distance) and AJI and noticed premising results shown in table 3.
The job of the discriminator D is to evaluate the segmented masks generated by the generator G. The generator G of the proposed model is a combination of an encoder to learn the intrinsic features that is, edges, shape, gradients, texture, and so on, and a decoder to learn how to delineate the binary masks. The adversarial loss enables the generator to learn the input at high frequencies (fine-grained details) which contributes to sharp and realistic binary masks. The additional loss term (equation 4) acts as an optimiser to fit the discriminator D to minimise the generated mask predication and maximise the real mask predication. To analyse the significance of discriminator scores, we have done two experiments. First, the proposed model is trained without additional loss term (equation 4) and the predicted segments are ranked on the basis obtained score of the discriminator D. In the second we trained generator G with additional loss term mentioned in equation 4, and predicted segments are ranked based on the score obtained by D. We have observed the strong consistency between the score of discriminator and dice score in the second experiment (Pearson coefficient of r=0.98, p<0.001).
We have observed certain limitations of the proposed method. It quantifies the irregularities to MG areas like light reflection, the improper focus of the light and positioning, and eyelid eversion. In future studies, our focus is to avoid these potential biases by improving the algorithm to automatically identify these reflections. Based on this analysis we concluded that this fully automated system is easy, fast and robust and reduces human effort and time in the analysis of MGD. We have observed very well interoperator and intraoperator reproducibility and an excellent correlation between the automatic and manual procedures. In this research, we proposed a more improved, automatic and objective analysis method based on adversarial learning for the accurate detection, segmentation and analysis of MGs. The proposed technique overcomes the limitation of previous assessment techniques for the MGs. It enables ophthalmology clinics in a more precise way to evaluate the dropout area of MG and sophisticated pathological changes in MGs. It is very helpful in the characterisation of MG and reduces the time associated with the analysis of MG.
References
Footnotes
Contributors ZKK and AIU conceived the overall concept and formulated the study designs. SHS and AQ analysed the data and wrote the article. AR wrote the computational code and performed experiments. SG assisted in the analysis and interpretation of the results.
Funding The authors have not declared a specific grant for this research from any funding agency in the public, commercial or not-for-profit sectors.
Competing interests None declared.
Patient consent for publication Not required.
Ethics approval Patients were not directly involved in this study. The study was conducted after the approval of LRBT Eye Hospital Mansehra, Pakistan.
Provenance and peer review Not commissioned; externally peer reviewed.