Article Text

Abstract
Objective To identify the degree of loss of the circumpapillary retinal nerve fibre layer (cpRNFL), the layer from the macular RNFL to the inner plexiform layer (mGCL++), circumpapillary (cpVD) and macular vascular density (mVD), Pulsar perimetry and standard perimetry in early glaucoma.
Methods In this cross-sectional study, one eye from each of 96 healthy controls and 90 eyes with open-angle glaucoma were measured with cpRNFL, mGCL++, cpVD, mVD, Pulsar perimetry with Octopus P32 test (Pulsar) and standard perimetry with Humphrey field analyser 24-2 test (HFA). For direct comparison, all parameters were converted to relative change values adjusted in both their dynamic range and age-corrected normal value.
Results The degree of loss in mGCL++ (−24.7%) and cpRNFL (−25.8%) was greater than that in mVD (−17.3%), cpVD (−14.9%), Pulsar (−10.1%) and HFA (−5.9%) (each p<0.01); the degree of loss in mVD and cpVD was greater than that in Pulsar and HFA (each p<0.01); and the degree of loss in Pulsar was greater than that in HFA (p<0.01). The discrimination ability between glaucomatous and healthy eyes (area under the curve) was higher for mGCL++ (0.90) and cpRNFL (0.93) than for mVD (0.78), cpVD (0.78), Pulsar (0.78) and HFA (0.79).
Conclusion The degree of loss of cpRNFL and mGCL++ thickness preceded by approximately 7%–10% and 15%–20% compared with the micro-VD and visual fields in early glaucoma, respectively.
Trial registration number UMIN Clinical Trials Registry (http://www.umin.ac.jp/; R000046076 UMIN000040372).
- diagnostic tests/investigation
- glaucoma
- imaging
- optic nerve
Data availability statement
No data are available.
This is an open access article distributed in accordance with the Creative Commons Attribution Non Commercial (CC BY-NC 4.0) license, which permits others to distribute, remix, adapt, build upon this work non-commercially, and license their derivative works on different terms, provided the original work is properly cited, appropriate credit is given, any changes made indicated, and the use is non-commercial. See: http://creativecommons.org/licenses/by-nc/4.0/.
Statistics from Altmetric.com
WHAT IS ALREADY KNOWN ON THIS TOPIC
Changes in the tissue thickness, microvascular density and specific perimetry are observed before standard automated perimetry in early glaucoma. However, the degree of these losses remains to be quantified. Additionally, the discrimination ability between glaucomatous and healthy eyes among tissue thickness, microvascular density and specific perimetry is also unclear.
WHAT THIS STUDY ADDS
The degree of loss in tissue thickness was the highest in early glaucoma and the discrimination ability between glaucomatous and healthy eyes was also highest in tissue thickness, suggesting that tissue thickness measurements by optical coherence tomography might be useful for detecting early glaucoma.
HOW THIS STUDY MIGHT AFFECT RESEARCH, PRACTICE OR POLICY
This study will help to elucidate the pathological condition in eyes with early glaucoma.
Introduction
Measurements of circumpapillary retinal nerve fibre layer (cpRNFL) or macular ganglion cell layer (mGCL) tissue thickness by optical coherence tomography (OCT) and specific perimetry measurements, including frequency doubling technology (FDT), short wavelength automated perimetry (SWAP), Flicker perimetry and Pulsar perimetry, have been considered indices of the structural and functional changes in early glaucoma.1–5 The process from the onset of glaucoma to the occurrence of structural and functional changes is expressed as the so-called glaucomatous continuum, and it has been proposed that changes in the glaucomatous continuum occur initially in the structure before function.6 However, in the clinical setting, some patients have evidence of glaucomatous optic neuropathy without a detectable visual field abnormality, and others have a glaucomatous visual field without detectable structural abnormality. The current general concept is that glaucoma is not necessarily a continuous process.
The recently developed OCT-based angiography (OCT-A) also detects the structural changes of early glaucoma.7 OCT-A has enabled the assessment of microvascular density (VD) and its quantification using indices.8 9 Previous studies reported that, in early glaucoma, the degree of loss in the macular ganglion cell complex (mGCC) layer was greater than that in macular micro-VD.7 However, in approximately one-third of cases, the relative loss in the macular micro-VD was greater than that of tissue thickness of mGCL10 or mGCC.7 10 Therefore, the relationship between VD and tissue thickness in early glaucoma remains to be clarified because, to date, the macular and circumpapillary regions have not been thoroughly investigated. In particular, there is a difference between the circumpapillary VD (cpVD), analysed within the ellipse area except the optic disc and cpRNFL thickness, and the analysed thickness of all axons distal to the measured cylinder at 3.4 mm diameter from the disc centre. Therefore, the cpVD, closer to the region of the cpRNFL, should be analysed for an accurate evaluation.
Pulsar perimetry detects early glaucoma faster than standard automated perimetry (SAP) and as accurately as FDT11 or Flicker perimetry3; however, its sensitivity decreases after cpRNFL or mGCC thinning.3 4 Pulsar is a flicker stimulus displaying a ring pattern with concentric circles and different contrast levels in a counter phase. This stimulus is similar to a frequency-doubling stimulus. Previously, frequency-doubling stimuli were assumed to isolate the magnocellular component of ganglion cells,12 whereas a recent study reported that SAP stimuli were superior to frequency-doubling stimuli at preferentially stimulating the magnocellular component of ganglion cells relative to the parvocellular component of ganglion cells.13 The differences between results measured with SAP and frequency-doubling stimuli may reflect the larger stimulus size and smaller contrast range for frequency-doubling stimuli.14–16 The decline of Pulsar sensitivity was greater compared with SAP sensitivity3 11; however, tissue thinning or decrease in micro-VD might be expected to decrease the Pulsar sensitivity. The relationship between micro-VD and specific perimetries in early glaucoma still largely remains unclear.
According to previous studies, changes in the tissue thickness, micro-VD and specific perimetry are observed before SAP in early glaucoma, but the degree of these losses remains to be quantified. This study aimed to identify the degree of loss of tissue thickness, micro-VD, pulsar and SAP, and evaluate their discrimination ability between glaucomatous and healthy eyes in early glaucoma.
Methods
This cross-sectional study was registered in the UMIN Clinical Trials Registry (http://www.umin.ac.jp/) under the unique trial number R000046076 UMIN000040372 (date of registration: 12 May 2020). The data were obtained between July 2020 and May 2021.17
Participants
One eye from each of 100 patients with early open-angle glaucoma and 100 healthy controls were included in this cross-sectional study.17 All participants underwent comprehensive ophthalmic examinations before OCT; OCT-A; and visual field measurements, such as biomicroscopy, gonioscopy, funduscopy, intraocular pressure (IOP), refraction, axial length measurements and best-corrected visual acuity tests. Healthy controls were recruited among the medical staff at Kitasato University Hospital or the ‘healthy’ eye of patients with unilateral retinal disease, such as age-related macular degeneration, retinal vein occlusion, epiretinal membrane or retinal detachment.
The inclusion criteria were as follows17: age 40–79 years; IOP ≤21 mm Hg for controls and ≤30 mm Hg for patients with glaucoma; spherical equivalent −8 to 5 dioptres and astigmatism ≤2 dioptres; axial length 22–28 mm; and best-corrected visual acuity ≤0 in logMAR. The following criteria were required for patients with open-angle glaucoma: gonioscopically wide-open angles and the presence of typical glaucomatous changes in the optic nerve head, including rim thinning, rim notch or RNFL defects, and a mean deviation (MD) ≥−6 dB with a Humphrey field analyser (HFA) 24-2 or 30-2 programme. The following criteria were considered for healthy controls: no abnormal findings except for clinically insignificant senile cataract on biomicroscopy and funduscopy and normal HFA test results of 24-2 or 30-2 according to Anderson and Patella’s criteria.18
Exclusion criteria included potential secondary ocular hypertension and other systemic or ocular disorders that could affect the study results. Eyes with a history of refractive surgery and multifocal intraocular lens were also excluded. If both eyes of a patient met the above criteria, one eye was randomly chosen.
OCT imaging
OCT imaging was performed using the Swept Source OCT (DRI OCT Triton, Topcon, Tokyo, Japan) without pupil dilation. The device has an acquisition speed of 100 000 A-scans/s. The measurements were performed with an eye-tracking system in the optic disc with horizontal and macular vertical raster scan modes consisting of 512×128 pixel scan density in a 6×6 mm square scan area and 7×7 mm square scan area, respectively. A circular (3.4 mm diameter) region centred on the optic disc in the optic disc scan and a square area (6×6 mm) in the macular scan were analysed in each scan protocol (figure 1A and C). Ocular magnification adjustment was performed for all scans based on the manufacturer’s instructions. The reliability criteria for both optic disc and macular scan modes included an image quality index >40.
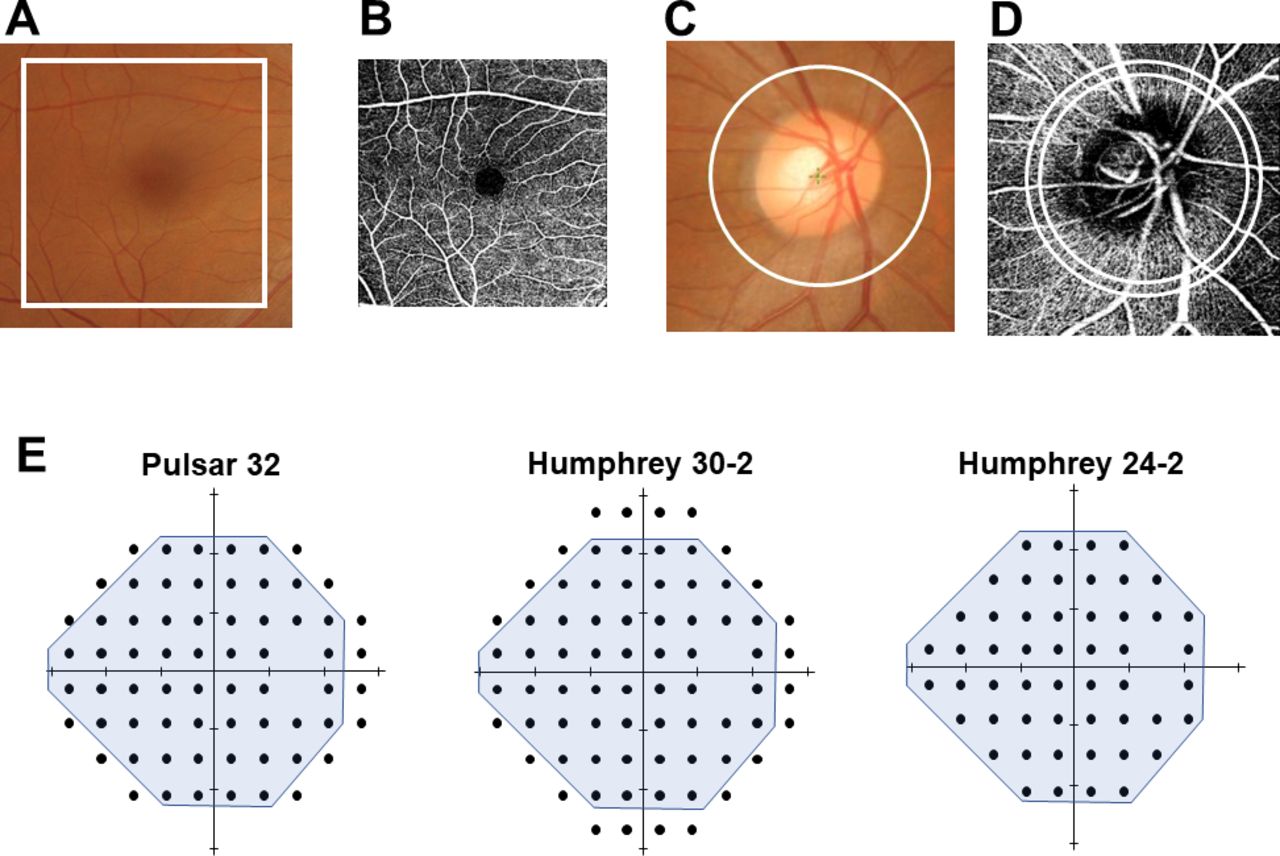
Analysis region for tissue thickness, microvascular density and visual field measurements. The analysis area of the macular complex layer from the retinal nerve fibre layer (RNFL) to the inner plexiform layer (mGCL++, A), macular vascular density (mVD, B), circumpapillary RNFL (cpRNFL, C) and circumpapillary VD (cpVD, D) is drawn in white. In the macular scan, an area of 6×6 mm was analysed for mGCL++ (A) and mVD (B). In the optic disc scan, a circular region of 3.4 mm diameter from the disc centre was analysed in the cpRNFL (C), whereas the annulus region between the two 3.2 and 3.6 mm diameter concentric circles centred on the disc was analysed for cpVD (D). For the visual field measurement, the mean sensitivity value of the test points corresponding to the 24-2 test points was used for the analysis (E).
For both disc and macular scans, the thickness of RNFL, GCL plus inner plexiform layer (GCL+), RNFL plus GCL+ (GCL++) and the total retina was calculated based on the autoalignment mode in the device software. In this study, we analysed only the macular GCL++ (mGCL++) and cpRNFL, considering the correlation with both micro-VD and the visual field.
OCT-A imaging
OCT-A imaging was also performed using the Swept Source OCT (DRI OCT Triton) without pupil dilation. Imaging was performed with an eye-tracking system in the optic disc with horizontal and macular horizontal raster scan modes consisting of a 320×320 pixel scan density in a 4.5×4.5 mm scan area and 6×6 mm scan area, respectively. All scanned areas of 6×6 mm were analysed to calculate the macular VD (mVD, figure 1B), and the annulus region between the two concentric circles (3.2 mm and 3.6 mm diameter, respectively) centred on the optic disc was analysed to calculate cpVD corresponding to the cpRNFL measurement region (figure 1D). Ocular magnification was not corrected for any scans in OCT-A imaging because it is not allowed by OCT-A. The reliability criteria for OCT-A imaging included an image quality index >40. Two-dimensional OCT-A images were derived using the following predefined axial slabs in the device software:
Macular scan
Superficial: from 2.6 µm below the internal limiting membrane (ILM) to 15.6 µm below the inner plexiform layer plus the inner nuclear layer (IPL/INL).
Deep: from 15.6 µm below IPL/INL to 70.2 µm below IPL/INL.
Outer retina: from 70.2 µm below the IPL/INL to the Bruch membrane (BM).
Choriocapillaris: from the BM to 10.4 µm below the BM.
Optic disc scan
Nerve head: from the top position on the B-scan to 130 µm below the ILM.
Vitreous: from the top position on the B-scan to 49.4 µm below the ILM.
Radial peripapillary capillary: from the top on the B-scan to 70.2 µm below the ILM.
Choroid disc: from 130.0 µm below ILM to 390.0 µm below BM.
In this study, the superficial and nerve head layers were represented as mVD and cpVD, respectively, considering the correlation between both tissue thicknesses and the visual field. All OCT-A images were exported as TIFF files and analysed using the free image analysis software ImageJ (V.1.53e, Wayne Rasband and contributors, National Institute of Health, USA). First, OCT-A images were set to 8-bit colour and binarised with the Otsu autothresholding algorithm method to white and black areas.19 The micro-VD was defined as the percentage of white areas occupied by the vessels in a defined area.
Poor-quality images with poor clarity, motion artefacts, irregular vessel patterns or disc boundaries, weak signals due to vitreous opacity or segmentation errors were excluded from the OCT and OCT-A analyses. The judgement was performed by two reviewers (KH and MK), and the images were excluded when the two reviewers disagreed.
Visual field measurement
SAP measurements were performed using the HFA (Carl Zeiss Meditec) 24-2 or 30-2 test (Swedish Interactive Threshold Algorithm Standard and Goldmann size III stimulus). Only reliable visual fields were used for analysis, defined as fixation losses <20%, false-positive responses <15% and false-negative responses <33%.20 Mean sensitivity (MS) values corresponding to the HFA 24-2 test points were used for statistical analyses because we included participants who underwent the HFA 24-2 or 30-2 programme (figure 1E).
Specific perimetry measurements were performed using the OCTOPUS Pulsar 32P test (Tendency Oriented Perimetry algorithm). Details on the Pulsar 32P test were previously described.3 21 Briefly, the Pulsar 32P test point is the original OCTOPUS 32 test point programme with a 6-degree interval, but with four points at the superior and inferior sides removed because of limitations of the field angle of the monitor. The stimulus consisted of a circular sinusoidal 5° diameter grating pattern presented for 500 ms. The stimulus underwent a counterphase pulse motion at 10 Hz, where both spatial resolution (0.5–6.3 cycle/degree on a 12-step log scale) and contrast (3%–100% on a 32-step log scale) were simultaneously modified. Threshold sensitivity is expressed in spatial resolution contrast units (src). Only reliable visual field test results were used for analysis and defined as the mean value of false-positive and false-negative responses <33%. The MS value corresponding to the 24-2 test points was used for statistical analyses (figure 1E).
Statistical analysis
The distribution of continuous variables was assessed using histograms and Shapiro-Wilk tests. All continuous data are presented as the means and 95% CIs. Differences within the factors were compared using paired t-tests when data were normally distributed and Wilcoxon signed-rank sum tests in any other case. Group differences were compared using the unpaired t-test when data were normally distributed or the Mann-Whitney U test in any other case. The Χ2 test was applied for the comparison of categorical variables. The p value for the multiple paired test was adjusted with the Holm method.22
The units and dynamic range differ among tissue thickness (μm), micro-VD (%), Pulsar MS (src) and HFA MS (dB). For direct comparison, and based on previous studies, the relative loss values were adjusted within the dynamic range using the following formula7 10 23 24:

where measurement value is the raw measurement value, age corrected normal value is the value adjusted for age, and dynamic range is the calculated upper 97.5th percentile value from the controls and lower 2.5th percentile value from the age-matched 23 eyes of 23 patients with advanced glaucoma with MD ≤−12 dB (age 58.2±10.2 years, axial length of 25.1±1.6 mm, best-corrected visual acuity in logMAR of −0.093±0.092 and MD of −16.7±4.4 dB, range −29.1 to −12.0 dB). The dynamic range of the visual field sensitivity was calculated from 0 to the upper 97.5 percentile value from the controls because the floor value was 0. A negative value of relative loss indicated that the measurement value was lower than the age-corrected normal value. The discrimination ability between glaucomatous and healthy eyes was evaluated using the area under the curve (AUC) calculated with receiver operating characteristic analysis, and AUCs were compared with the pairwise DeLong test adjusted with the Holm method.22 All analyses were performed using the statistical programming language R (R V.3.5.0; R Foundation for Statistical Computing, Vienna, Austria).
Results
In total, 4 eyes of 4 healthy controls (2 eyes with low image quality with OCT or OCT-A measurement due to a small pupil or vitreous opacity; 1 eye with high fixation loss with Humphrey 24-2; 1 eye with congenital optic disc hypoplasia) and 10 eyes of 10 patients with glaucoma (6 eyes with high fixation loss or false-positive Humphrey 24-2 and 4 eyes with low image quality with OCT or OCT-A measurement due to a small pupil or vitreous opacity) were excluded. Therefore, 96 eyes of 96 healthy controls and 90 eyes of 90 patients with glaucoma were ultimately included in the analysis. Participants’ demographic and ocular data are presented in table 1. No significant differences were observed in the participants’ demographic and ocular data between the healthy controls and patients with glaucoma. The mean HFA MD in patients with glaucoma was −1.9 dB. Measurements of mGCL++, cpRNFL, mVD, cpVD, Pulsar, and HFA in the controls and patients with glaucoma are presented in table 2. The signal strength, mGCL++, cpRNFL, mVD and cpVD measurements were significantly lower in patients with glaucoma than in controls (all p<0.05). The age-related decline values and (dynamic ranges) were −0.10 µm/year (61.0–120.2 µm) in mGCL++, −0.16 µm/year (39.6–116.8 µm) in cpRNFL, −0.043%/year (25.7%–36.2%) in mVD, −0.13%/year (19.5%–44.6%) in cpVD, −0.099 src/year (0–23.7 src) in Pulsar and −0.077 dB/year (0–32.6 dB) in HFA. These values were used to calculate the relative loss values.
Participants’ demographic and ocular data
Measurement value of the tissue thickness, vascular density, and visual field sensitivity in controls and patients with glaucoma
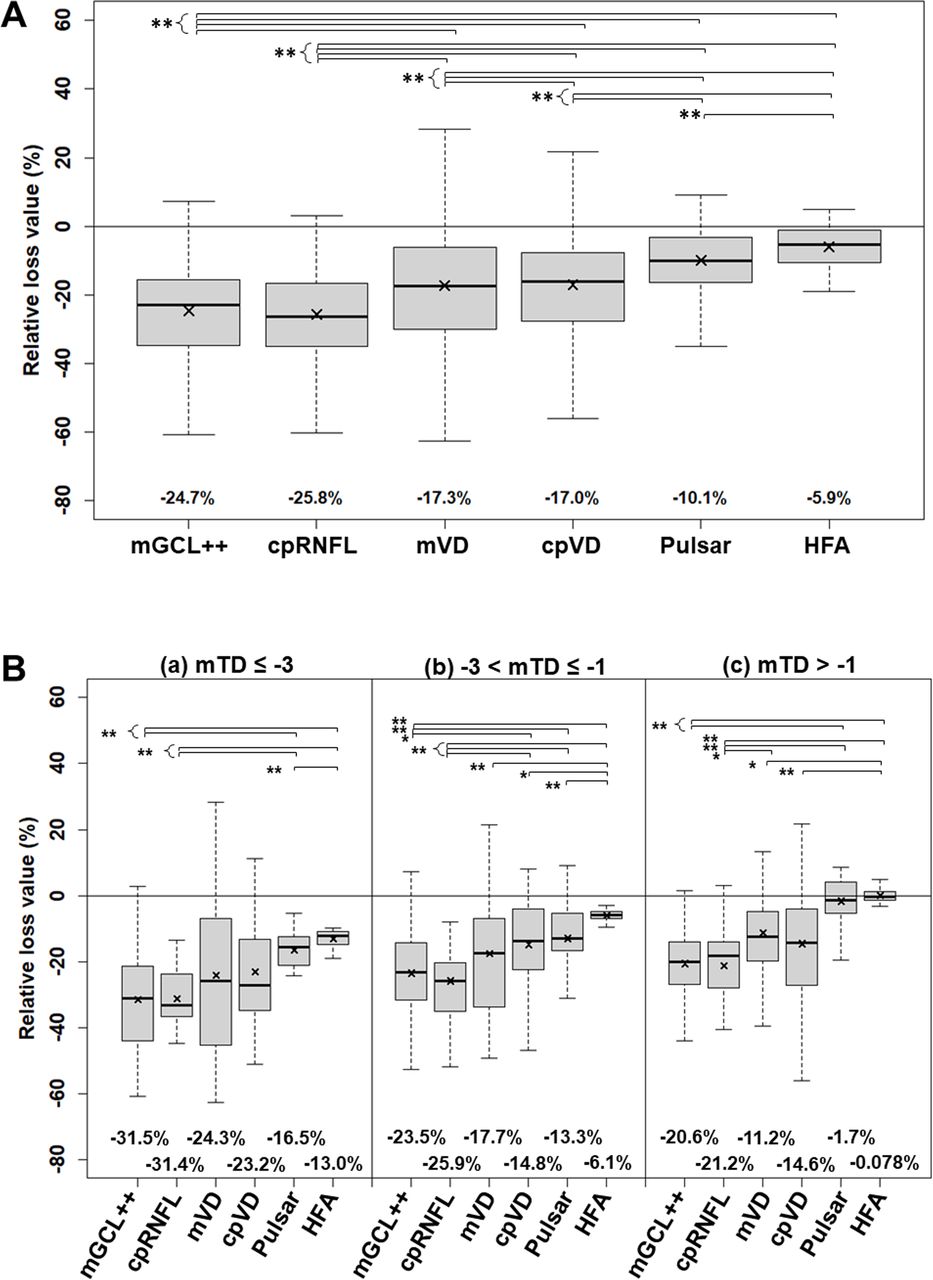
The mean relative losses from the age-corrected normal value and dynamic range in the tissue thickness, VD and visual field sensitivity are presented in figure 2A. The mGCL++ (−24.7%) and cpRNFL (−25.8%) measurements significantly decreased compared with mVD (−17.3%), cpVD (−17.0%), Pulsar (−10.1%) and HFA (−5.9%) (all p<0.01). The mVD (−17.3%) and cpVD (−17.0%) significantly decreased compared with Pulsar (−10.1%) and HFA (−5.9%) (all p<0.01), and Pulsar (−10.1%) significantly decreased compared with HFA (−5.9%) (p<0.01). The results for all patients with glaucoma divided into three groups with mean total deviation less than −3 dB (a), between −1 dB and −3 dB (b), and greater than −1 dB are also shown in figure 2B.
Relative loss from age-corrected normal value adjusted with dynamic range of tissue thickness, microvascular density and visual field sensitivity. The figure shows the box plot (median, IQR and 1.5×IQR) with the mean value (x) in (A) total patients with glaucoma and (B) total patients with glaucoma divided into three groups with mean total deviation (mTD) worse than −3 dB (a), between −1 dB and −3 dB (b), and better than −1 dB (c). The mean relative loss values appear under each graph. P values less than 0.05 and 0.01 corrected with the Holm method are expressed as * and **, respectively. cpRNFL, circumpapillary RNFL; cpVD, circumpapillary VD; HFA, Humphrey field analyser; mGCL++, macular complex layer from the retinal nerve fibre layer (RNFL) to the inner plexiform layer; mVD, macular vascular density.
The AUCs and detailed statistics of each parameter are presented in table 3. The discrimination ability between glaucomatous and healthy eyes was significantly higher for mGCL++ (AUC=0.90) and cpRNFL (AUC=0.93) than for mVD (AUC=0.78), cpVD (AUC=0.78), Pulsar (AUC=0.78) and HFA (AUC=0.79) (all p<0.05). AUC values were comparable among mVD (AUC=0.78), cpVD (AUC=0.78), Pulsar (AUC=0.78) and HFA (AUC=0.79).
Discrimination ability between the glaucomatous and healthy eyes by tissue thickness, vascular density and visual field sensitivity (Se)
Discussion
The tissue thickness of the cpRNFL and mGCL++ demonstrated the highest relative loss in early glaucoma, followed by micro-VD, specific perimetry and SAP. Previous studies have reported tissue thinning between the RNFL and IPL at the macular region,7 25 26 with cpRNFL26–28 appearing before the decreasing retinal sensitivity measured with specific perimetry, including FDT,29 30 SWAP,31 Flicker2 or Pulsar3 11 perimetry, and before its detection by SAP. The difference between normal and suspected glaucoma or early glaucoma has been compared using measurement values or assessed using AUC values. Although measurements such as the tissue thickness, micro-VD and visual field sensitivity have similar sensitivity to detect an abnormality and measurement variability, the degree of differences among the tissue thickness, micro-VD and visual field sensitivity cannot be directly compared because of their different units and dynamic ranges. Therefore, for an accurate and direct comparison, they should be converted to relative loss values.
Moghimi et al reported a floor value where no further structural change could be detected, neither in tissue thickness nor in micro-VD.32 The dynamic range adjusted with the floor value in their study was 43.9 µm for the cpRNFL, 22.8 µm for the GCC (corresponding to GCL++ in this study), 16.7% for the perifoveal VD and 18.8% for the cpVD. The dynamic range in our study was 59.0 µm for cpRNFL, 77.2 µm for GCL++, 10.5% for mVD and 25.1% for cpVD, thus differing from Moghimi et al’s report,32 potentially owing to differences in the measurement device, analysis area and method. However, the dynamic range of the micro-VD was narrower than the tissue thickness, suggesting that adjusting for the dynamic range is required for an accurate and direct comparison of the degree of loss among the tissue thickness, micro-VD and visual field sensitivity. Although the data in our study were obtained with a cross-sectional design, the degree of relative tissue thickness loss adjusted by the dynamic range for the GCL++ (−24.7%) and cpRNFL (−25.8%) revealed significantly more relative loss than the visual field, including Pulsar (−10.1%) and HFA (−5.9%), and the Pulsar also demonstrated more relative loss compared with HFA.
According to the vascular theory of glaucoma, optic nerve damage is caused by reduced ocular blood flow, potentially leading to axonal ischaemia.33 Supporting this assumption, Shiga et al,34 using laser flow speckle flowgraphy, reported a significantly reduced ocular blood flow (mean blur rate) in patients with preperimetric glaucoma (11.8±2.4, arbitrary unit) compared with normal subjects (13.5±2.6, arbitrary unit); cpRNFL was also significantly reduced in patients with preperimetric glaucoma (80.00±8.80 µm) compared with normal subjects (92.56±6.19 µm). Although it was not calculated in the above paper,34 when the effect size, representing the extent of differences, was calculated based on the above results,34 the cpRNFL (effect size d was 1.7) was larger than the ocular blood flow (effect size d was 0.68). Thus, the destruction of neural tissue in glaucoma may be greater than vascular dysfunction only on the retinal surface or optic nerve head.
Micro-VD loss in the macular or circumpapillary regions is a sign of an early glaucoma change.7 25 26 35–37 Hou et al7 detected both mGCC thinning and micro-VD loss in the whole macular region in early glaucoma, although the relative loss of mGCC (9.8%–9.9%) was greater than that of micro-VD (6.6%–6.9%) in early glaucoma. Wang et al25 reported a greater relative loss of GCC (22.0%) than mVD (15.4%) using a similar protocol. This study also demonstrated a higher relative loss in GCL++ (−24.7%) than in mVD (−17.3%). The degree of thinning of the macular tissue was larger than that of micro-VD in early glaucoma. However, previous studies did not compare the cpVD and cpRNFL regions.7 25 Here, the relative loss value of the cpRNFL (−25.8%) was also higher than that of cpVD (−17.0%). These results clearly showed that the degree of tissue thickness loss in both macular and circumpapillary regions was larger than that of micro-VD in early glaucoma. However, only morphological changes in the surface layer of the retina were measured both in previous studies7 25 and in this study. In this study, morphological changes in the deeper layers at the very early stage of glaucoma were not measured.
A previous in vivo study in non-human primates with experimental glaucoma reported a substantial loss of anterior orbital optic nerve axons (~10%–15%) before the appearance of RNFL thinning with OCT.38 Additionally, cpRNFL retardance, represented by birefringent changes in the ordered structural array of cytoskeletal proteins within its axons, measured using scanning laser polarimetry, occurred before cpRNFL thinning in both cross-sectional39 and longitudinal40 studies. However, morphological changes occurring at a very early stage of glaucoma could not be demonstrated with our study design.
Another novelty of our study was the evaluation of the degree of loss in specific perimetry. Pulsar perimetry, following a similar principle as FDT,34 has been used to propose that, in its early stages, glaucoma may predominantly damage the magnocellular retinal ganglion cells projecting into the magnocellular layers of the lateral geniculate nucleus.4 11 41 Accordingly, we hypothesised that the degree of loss in the Pulsar would be more similar to the tissue thickness than to the micro-VD; however, we observed that the degree of loss in the tissue thickness (−25.8% to −21.2%) and micro-VD (−17.3% to −17.0%) was larger than that in the Pulsar (−10.1%). Regarding detectability, Pulsar (AUC=0.78) was comparable with micro-VDs (AUC=0.78) and standard perimetry (AUC=0.78). A previous study also reported no significant difference in the diagnostic performance between SAP and matrix FDT.42 This may be attributed to the fact that only the magnocellular pathway is not significantly attenuated at the very early stages of glaucoma or that the Pulsar stimulus may reflect the magnocellular component of the ganglion cells, which has a minor redundancy in the human retina, as well as the parvocellular component of the ganglion cells, which is highly redundant in the human retina.
Previous studies reported that cpVD (AUC=0.86–0.93) demonstrated better discriminative ability than mVD (AUC=0.71–0.87) for differentiating between early glaucoma and normal eyes,43–45 whereas one study reported more prominent mVD damage in the peripheral area.26 In our study, the AUC was 0.78 for both mVD and cpVD. The discrimination ability between the previous studies43–45 and our study may be attributed to the difference in analysis areas. Regarding the circumpapillary region, in previous reports, the region of interest consisting of two circles was either wide (inner circle: 2 mm diameter; outer circle: 6 mm diameter)43 or small (inner circle: BM opening; outer circle: 0.75 mm outwards from the inner circle)26 44 45 compared with the current study (inner circle: 3.2 mm, outer circle: 3.6 mm). In the macular region, the region of interest in a previous study was smaller (a 1.5 mm-wide circular annulus centred on the macula captured with 3×3 mm)44 45 than that in this study (a 6×6 mm square centred on the macula). However, the AUC value within the same analysis region was comparable between a previous study (AUC=0.77)26 and our study (AUC=0.78), suggesting the need for standardisation of the analysis area in micro-VD measurements.
There were limitations in the current study. First, of the 90 eyes in patients with glaucoma, 74 used at least prostaglandin eye drops. A previous study reported that VD increased due to IOP lowering with prostaglandin eye drops,46 suggesting that this may have influenced the small relative loss in micro-VDs compared with the tissue thickness of cpRNFL and mGCL++. Accurate comparisons would be needed in eyes without eye drops. Second, the inclusion criterion for patients with glaucoma was the presence of typical glaucomatous changes in the optic nerve head. Therefore, the degree of relative loss in structural changes may have been greater than that in functional changes. Third, it was not possible to match the analysis area of OCT and OCT-A imaging by correcting the ocular magnification because the scan size was different between OCT and OCT-A imaging.
In conclusion, although the data were obtained with a cross-sectional design, the dynamic range-adjusted loss in early glaucoma was higher in the tissue thickness change, followed by micro-VD and retinal sensitivity changes with specific perimetry and later with SAP. Discrimination ability between glaucomatous and healthy eyes was also the highest in tissue thickness and comparable between the micro-VD and visual fields.
Data availability statement
No data are available.
Ethics statements
Patient consent for publication
Ethics approval
This cross-sectional study was approved by the Research Ethics Committee of the Kitasato University Hospital (B20-064) and was performed according to the tenets of the Declaration of Helsinki. All participants provided written informed consent.
References
Footnotes
Contributors Research design—KH, JY, KN, JK, MK and NS. Data acquisition—KH, JY and KN. Data analysis—KH and JK. First Draft of Manuscript: KH. Critical Revision of Manuscript: KH, JY, KN, JK, MK and NS. Acts as Garantor of Work: KH.
Funding This study was supported by the Suda Memorial Research Grant for glaucoma treatment, Tokyo, Japan; the Research Grant-in-aid of Kitasato University, Kanagawa, Japan; and Alcon Japan research grants, Tokyo, Japan.
Competing interests NS received financial support for the research from RE MEDICAL.
Patient and public involvement Patients and/or the public were not involved in the design, or conduct, or reporting, or dissemination plans of this research.
Provenance and peer review Not commissioned; externally peer reviewed.
© Author(s) (or their employer(s)) 2023. Re-use permitted under CC BY-NC. No commercial re-use. See rights and permissions. Published by BMJ.