- 1 Shiley Eye Institute, University of California, San Diego, La Jolla, California, USA
- 2 Department of Advanced Medicine, Division of Ophthalmology, National Center for Geriatrics and Gerontology, Obu, Japan
- 3 Section of National Institute for Longevity Sciences Longitudinal Study of Aging, National Center for Geriatrics and Gerontology, Obu, Japan
- 4 Faculty of Health and Medical Science, Aichi Shukutoku University, Nagakute, Japan
- 5 Graduate School of Nutritional Sciences, Nagoya University of Arts and Sciences, Nisshin, Japan
- Correspondence to Dr Hideki Fukuoka; hfukuoka{at}ncgg.go.jp
- Received 21 June 2016
- Revised 6 March 2017
- Accepted 5 June 2017
Abstract
Background/aims To assess a relationship between vertical cup-to-disc ratio (VCDR), which is a useful tool to assist in the diagnosis of glaucoma in the early to medium-advanced stages, and intraocular pressure (IOP), central corneal thickness (CCT), body mass index (BMI) and body fat percentage (BFP).
Methods The data were collected from general populations living in the centre of Japan who had participated in the third wave of the National Institute for Longevity Sciences — Longitudinal Study of Aging. VCDR was set in the general linear mixed model as objective variables with adjustment for age and optic disc area. Explanatory variables were IOP, CCT, BMI and BFP.
Results 2819 eyes with no surgical history (788 men, 739 women; average age, 59.6±11.7 years) were included in the multivariate analysis. VCDR significantly increased with a low BMI in men (estimated effect=−0.0059, p=0.0426). Meanwhile, VCDR significantly increased with a high IOP (estimated effect=0.0125, p<0.0001) and a thin CCT (estimated effect=−0.4229, p=0.0425) in women. There was no significant relationship of VCDR with IOP, CCT and BFP in men and with BMI and BFP in women. Only the relationship between IOP and VCDR in women would be statistically significant after applying Bonferroni's correction for multiple comparisons, under the assumption that each analysis was not independent.
Conclusions This study demonstrated the different association with VCDR and other factors by sex. A low BMI in men and a high IOP and a thin CCT in women were indicated to be a risk factor of a greater VCDR. Meanwhile BFP was not a significant factor of a greater VCDR in both sexes.
- vertical cup-to-disc ratio
- intraocular pressure
- central corneal thickness
- body mass index
- body fat percentage
Key messages
Glaucoma is a multifactorial disorder of the eye and the leading cause of blindness worldwide, posing a major public health challenge. As such, it is important to assess the relationship between anthropometric measures and vertical cup-to-disc ratio (VCDR).
This study demonstrated different associations between VCDR and other factors, stratified by sex.
These results include important findings that may help to clarify the reason for higher proportions of normal tension glaucoma around Asia, and to find novel therapeutic options in other countries for refractory glaucoma in which the visual field defect worsens despite treatment with topical and/or surgical therapy. Moreover, these results may shed light on the different mechanisms leading to glaucoma in men and women.
Introduction
Glaucoma, a multifactorial optic neuropathy for which the leading aetiology is high intraocular pressure (IOP), is the main cause of irreversible visual loss, which ultimately leads to blindness.1 In a large population-based study, it was found that the relative risk of glaucoma optic nerve damage was 13 times higher for an IOP of 22–29 mm Hg and 39 times higher for an IOP of more than 30 mm Hg in comparison to an IOP of less than or equal to 15 mm Hg.2 It is important in the early stages of glaucoma to detect ophthalmic structural changes, particularly in the retinal ganglion cell complex and the optic disc because the visual field defects in glaucoma are often detected only after 20% of the axons are lost.3 Also, the vertical cup-to-disc ratio (VCDR) is a very useful clinical measurement for detecting glaucoma because it increases earlier than the horizontal cup-to-disc ratio, especially in the early to moderate glaucoma stages.4
IOP, which is believed to be a major risk factor for glaucoma and also the only modifiable one, can be influenced by central corneal thickness (CCT). Systolic blood pressure and body mass index (BMI) were also reported to have a positive correlation to IOP.5–7 Additionally, positive associations between BMI and blood pressure have been documented in several ethnicities.8 Several reports suggest that a high BMI protects against glaucoma, whereas a low BMI has a possibly greater risk factor.9–11 They hypothesised that higher circulating oestrogen and other paracrine factors, which fatty tissue produces, bind to oestrogen receptors expressed on retinal ganglion cells and may lead to neuroprotection.
The interrelations between IOP, CCT, BMI, body fat percentage (BFP) and VCDR are complex. It is important to assess the relation between anthropometric measures and VCDR. However, few cross-sectional and prospective studies have been conducted that include BMI and BFP. The objective of this study is to clarify the relationship between VCDR and IOP, CCT, BMI or BFP (after adjusting for age, optic disc area, systolic blood pressure and diastolic blood pressure, all of which are influential factors in the middle-aged and elderly Japanese population.)
Methods
Study design and participants
Study participants were selected from the third wave examination (May 2002–June 2004) of the National Institute for Longevity Sciences — Longitudinal Study of Aging (NILS-LSA). The NILS-LSA is a longitudinal, dynamic prospective cohort study that includes medical, physiological, nutritional and psychological examinations. A total of 2378 men and women between the age of 40 and 84 (inclusively) were randomly selected from a central region of Japan: Obu and Higashiura. Obu, which possesses the characteristics of an urban area, and Higashiura, which possesses the characteristics of a rural area, are located in the prefecture of Aichi. We selected 1428 right eyes with no surgical history (736 men, 692 women; average age, 59.3±11.7 years) for univariate analysis and 2819 eyes with no surgical history (788 men, 739 women; average age, 59.6±11.7 years) for multivariate analysis in order to remove the impacts of any ophthalmic surgery.
Ocular parameters
CCT was obtained with specular microscope (SP-2000; Topcon Corporation, Tokyo, Japan). VCDR and optic disc area were assessed using the Heidelberg Retina Tomograph II (HRT; Heidelberg Engineering, Heidelberg, Germany). IOP of each eye was measured three times from 09:00 to 12:00 using a non-contact tonometer (NT-3000, Nidek Technologies, Gamagori, Japan).
Other parameters
Blood pressure was measured at the upper right arm in a sitting position. Height and weight were measured with a lightweight examination gown, but without shoes. BFP was measured by dual-energy X-ray absorptiometry scanners (QDR4500A; Hologic, Bedford, Massachusetts, USA). BMI was calculated by dividing the square of the height (square metres) from the weight (kilograms).
Statistical analysis
The data were processed and analysed using the Statistical Analysis System (SAS V.9.3). We used four age groups (40s, 50s, 60s, 70s) from the fourth decade group (40–49) to the seventh decade group (70 and older). Differences in VCDR, IOP, CCT, optic disc area, BMI, BFP, systolic blood pressure and diastolic blood pressure between men and women were tested by two-sample Student's t-test. VCDR was classified by cup-to-disc ratio (CDR) classes (CD1, VCDR <0.3; CD2, 0.3 ≤ VCDR <0.6; CD3, 0.6 ≤ VCDR <0.7; CD4, 0.7 ≤ VCDR <0.9; CD5, 0.9 ≤ VCDR).12 13 Only the right eye data of each subject were evaluated in this analysis. To analyse the association between CD1 to CD3 classes and age groups, cross-tabulation, χ2 tests and residual analysis were carried out in the order named. CD4 and CD5 groups were excluded in the analysis because χ2 tests require that there are at least five data points in the class. In addition, the stratified table including age groups and CDR classes was analysed using the Cochran-Mantel-Haenszel statistic.
Then VCDR was analysed using a general linear mixed model, a type of statistical analysis used for repeated measurements and binomial values of a single individual. Both eye data of each subject were evaluated in this analysis. The analysis was applied using the SAS procedure PROC MIXED with RANDOM INTERCEPT/SUB=ID. Explanatory variables were IOP, CCT, BMI and BFP. The data were analysed by sex and adjusted for age, optic disc area, systolic blood pressure and diastolic blood pressure. Also, predicted VCDR was calculated using the ESTIMATE command as IOP, CCT, BMI and BFP were varied from the average to the average ± SD. We applied Bonferroni's correction for multiple comparisons under the assumption that each analysis was not independent. The level of significance in all analyses was set at p<0.05.
Results
Figure 1 shows the proportion of age groups in each CDR class. The highest proportions of CD1, CD2, CD3, CD4 and CD5 were 27.1% (found in the fourth decade group), 30% (in the fifth decade group), 31% (in the sixth and seventh decade groups), 54.8% (in the seventh decade group) and 100% (in the seventh decade group), respectively. In χ2 tests and residual analysis, there was a significantly lower proportion of seventh decade participants and a higher proportion of fourth and sixth decade participants in CD1. There was a significantly lower proportion of seventh decade participants and a higher proportion of fifth decade participants in CD2, and a significantly lower proportion of fourth, fifth and sixth decade participants, as well as a higher proportion of seventh decade participants in CD3. There were no significant differences between the observation values and the expected values of the fifth decade participants in CD1, and of the fourth and sixth decade participants in CD2. Greater CDR classes are linked to significantly older age groups (p<0.0001, Cochran-Mantel-Haenszel test).

The proportion of age groups in each cup-to-disc ratio (CDR) class. From the results of residual analysis, white arrowheads pointing up (△) indicate that observation value is significantly more than the expectation value, while black arrowheads pointing down (▼) indicate that observation value is significantly less than expectation value.
Mean values of IOP, CCT, VCDR, optic disc area, BMI, BFP, systolic blood pressure and diastolic blood pressure were summarised by age group and gender (table 1).
Mean values ±SD of VCDR, IOP, CCT, optic disc area, BMI, systolic blood pressure, diastolic blood pressure and BFP
VCDR of men in the fifth and seventh decade groups was significantly greater than that of women in the corresponding groups. In the fourth and fifth decade groups, IOP and CCT were significantly greater for men than for women. Disc area was significantly greater for men than for women in only the seventh decade group. BMI, systolic blood pressure and diastolic blood pressure were significantly greater for men than for women in the fourth to sixth decade groups. On the other hand, BFP was significantly less for men than for women among all decade groups.
The relationship between VCDR and IOP, CCT, BFP or BMI by gender was analysed in a general linear mixed model after being adjusted for age, systolic and diastolic blood pressure, and optic disc area (table 2).
Statistical results of the relationship between vertical cup-to-disc ratio (VCDR) and several explanatory valuables by sex in general linear mixed model analysis after adjusting for age, optic disc area, systolic blood pressure and diastolic blood pressure
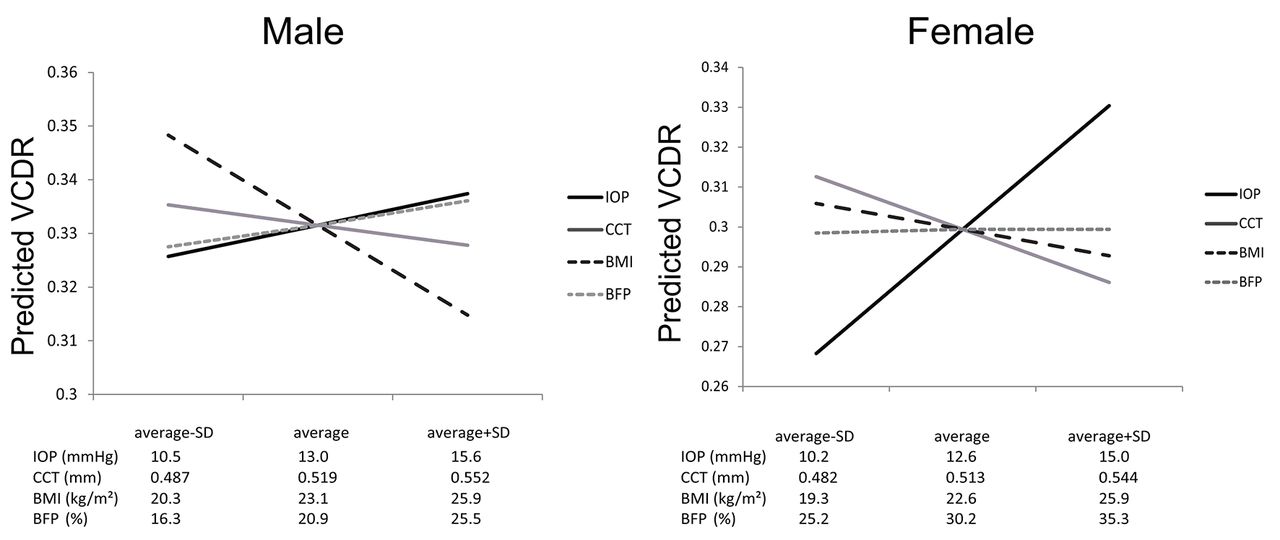
VCDR significantly increased with a low BMI among men. Meanwhile, VCDR significantly increased with a thin CCT and a high IOP among women. No significant relationship was found between VCDR and CCT, IOP or BFP among men, as well as VCDR and BMI or BFP among women. However, only the relationship between IOP and VCDR in women would be statistically significant after applying Bonferroni's correction for multiple comparisons under the assumption that each analysis was not independent. Figure 2 shows the predicted VCDR after being adjusted for age, optic disc area and systolic and diastolic blood pressure when each of the explanatory variables varied from average to average ±SD. The predicted VCDR has a positive trend against IOP and a negative trend against CCT and BMI. We have added the analysis to see whether the significant association of greater VCDR is with BMI and also with weight and height because BMI is a ratio of weight and height. However neither height nor weight was found to be a significant determinant of greater VCDR after adjusting for age, gender and disc area in a stepwise multiple regression analysis.
Predicted vertical cup-to-disc ratio (VCDR) when each of the explanatory variables, intraocular pressure (IOP), central corneal thickness (CCT), body mass index (BMI) and body fat percentage (BFP), was varied from average to average ±SD, as calculated by linear mixed model by sex.
Discussion
Glaucoma is a major public health problem and the leading cause of blindness across the world and a progressive optic neuropathy characterised by both ocular morphological changes, such as optic nerve disc cupping or loss of retinal ganglion cell, and ocular functional changes, such as visual field defects that correspond with the loss of the area of the optic neuronal rim. Some of the risk factors for primary open-angle glaucoma (POAG), such as high IOP,14 advancing age,15 sex,16 family history,17 myopia,18 race,19 high systolic blood pressure, low diastolic blood pressure20 and diabetes mellitus,21 have been widely investigated and described. Considered a multifactorial disorder, several theories for the pathogenesis of glaucomatous optic neuropathy have been described as a mechanical compression,22 a vascular23 and a genetic theory.24
Specific examination of the optic disc is a very important part of the assessment in patients with glaucoma. There is a push for more objective optic disc assessment, such as the HRT, ocular coherence tomography and GDx nerve fibre analyser. HRT is an established imaging device that creates both accurate and reproducible measurements of optical nerve head parameters, including VCDR, for the diagnosis and monitoring of glaucoma.25 VCDR was classified by five CDR classes, including 0.7 (VCDR >97.5th percentile), the value that was used as glaucoma diagnosis according to the International Society of Geographical and Epidemiological Ophthalmology criteria.13 There was a higher proportion of older groups and a lower proportion of younger groups in the upper CDR class. Conversely there was a lower proportion of older groups and a higher proportion of younger groups in the lower CDR class. Overall there was a significant positive relationship between CDR class and age group.
In univariate analysis, IOP and CCT were significantly greater for men than for women in the fourth and fifth decade groups. IOP is influenced by many factors, such as CCT and corneal biomechanical properties.26 CCT especially has a significant influence on IOP measurement. It has been reported that thinner corneas result in artificially lower IOP readings and that thicker corneas cause artificially high IOP readings. This is because the thick cornea has greater resistance to corneal shape distortion against external pressure than the thinner cornea, leading to the projected IOP reading being less than the real IOP in a thin CCT.27
IOP, BMI, systolic blood pressure and diastolic blood pressure were significantly greater for men than for women in the fourth and fifth decade groups. Pasquale et al reported that BMI had a significantly positive relation with IOP after adjusting for several parameters.9 Previous reports explained that increasing intraorbital fat tissue caused a high intraorbital pressure, an increase in episcleral venous pressure and a consequent decrease in outflow facility. As a result, IOP may increase. Obesity increases blood viscosity through increasing red cell count, haemoglobin and haematocrit, as well as consequently increased outflow resistance of episcleral veins, resulting in increased IOP.28 29 Elevated blood pressure increases IOP by increasing ciliary artery pressure and ultrafiltration of the aqueous humour.30 31 In addition, some studies have documented positive associations between BMI and blood pressure in several ethnicities.8
VCDR and optic disc area were significantly greater for men than for women in the seventh decade group. Several researchers reported positive association between VCDR and optic disc area in normal and glaucomatous eyes.32–34 Because several factors are intricately related to each other, multivariate analyses were performed using linear mixed model adjusted for age, optic disc area and blood pressure.
In multivariate analysis, only BMI was a significant VCDR-related factor in men after adjusting for age, optic disc area and blood pressure. Even though BMI is a number based on weight and height, neither height nor weight was found to be a significant determinant of greater VCDR after adjusting for age, gender and disc area in a stepwise multiple regression analysis. Further studies will be needed in order to explore this relationship and the meaning of BMI. In contrast, IOP and CCT were significant VCDR-related factors in women after adjusting for age, optic disc area and blood pressure. Several authors described that CCT was significantly thinner in normal tension glaucoma (NTG) than in POAG or normal subjects.35 36 At a glance, BMI and CCT were negatively related to VCDR, while IOP was positively related to VCDR (figure 2). A large epidemiological study suggested that the significant factors of elevated VCDR were increased age, being male, higher IOP, lower diastolic blood pressure, lower BMI and previous cataract surgery.37 Previous studies suggested that higher IOP was the most significant factor of elevated VCDR. However, our data suggested that the most significant factor of elevated VCDR was IOP in women, but BMI in men. For this possible reason, a large population-based epidemiological study reported that the Japanese population seems to have a higher incidence rate of NTG.38 39 NTG is a common form of POAG and considered a mechanism shared with both conditions.40 However, IOP seems to be a relatively lower potential factor in NTG than in POAG. A low BMI may be related to NTG for men. Pasquale et al 9 reported that higher BMI among women was associated with a low risk of NTG (IOP ≤21 mm Hg). Also, a population-based study in Singapore found that men generally had greater VCDR than women and that lower BMI among both sexes was associated with greater VCDR.37 These studies hypothesised that higher oestrogen levels from fatty tissue may lead to neuroprotection. On the other hand, some researchers revealed a statistically significant correlation between elevated cerebrospinal fluid pressure (CSFP) levels and higher BMI.41 42 They concluded that a depressed CSFP caused by low BMI might be a potential risk factor for NTG. We speculated that in men BMI levels are inversely related to glaucoma because BMI is inversely related to VCDR. Our hypothesis is that CSFP levels, not oestrogen levels from body fat tissue, affect VCDR since we could not find out the relationship between VCDR and BFP in our multivariate analysis.
IOP may be a relatively low risk factor in NTG compared with POAG, though. Considering the possible mechanism of a translaminar pressure gradient and treatment difficulties in NTG, we believe there must be other factors contributing.
In conclusion, we observed a significant negative relationship between VCDR and BMI for men and VCDR and CCT for women, as well as a significant positive relationship between VCDR and IOP for women in a large population-based study. Male participants with higher BMI had elevated VCDR than those with lower BMI. Female participants with thinner CCT had elevated VCDR than those with thicker CCT. Also, female participants with higher IOP had elevated VCDR than those with lower IOP. These are important findings that may help to clarify the reason for higher proportions of NTG in Asia (including Japan) and to find novel therapeutic options for refractory glaucoma in which the visual field defect worsens despite treatment with topical and/or surgical therapy. Moreover, it may shed light on the different mechanisms leading to glaucoma in men and women.
Footnotes
Acknowledgements This research was performed in accordance with the tenets of the Declaration of Helsinki. Prior informed consent was obtained from all participants.
Contributors HF and HS: Conception and design of study. HF: Analysis and interpretation, writing the article and literature search. CT: Critical revision of the article and statistical expertise. FA: Final approval of the article. RO: Data collection, and provision of materials, patients or resources. HS: Administrative, technical or logistic support.
Funding This work was supported in part by grants from the Research Fund for Longevity Sciences from the National Center for Geriatrics and Gerontology, Japan (25-22).
Competing interests None declared.
Ethics approval The NILS-LSA was approved by the ethics committee of the National Center for Geriatrics and Gerontology.
Provenance and peer review Not commissioned; externally peer reviewed.
This is an Open Access article distributed in accordance with the Creative Commons Attribution Non Commercial (CC BY-NC 4.0) license, which permits others to distribute, remix, adapt, build upon this work non-commercially, and license their derivative works on different terms, provided the original work is properly cited and the use is non-commercial. See: http://creativecommons.org/licenses/by-nc/4.0/
References
- 1.
- 2.
- 3.
- 4.
- 5.
- 6.
- 7.
- 8.
- 9.
- 10.
- 11.
- 12.
- 13.
- 14.
- 15.
- 16.
- 17.
- 18.
- 19.
- 20.
- 21.
- 22.
- 23.
- 24.
- 25.
- 26.
- 27.
- 28.
- 29.
- 30.
- 31.
- 32.
- 33.
- 34.
- 35.
- 36.
- 37.
- 38.
- 39.
- 40.
- 41.
- 42.