Article Text

Abstract
Objective Few studies have examined how levels of activity intensity fluctuate throughout later life in older adults and no study has identified correlates of sustained activity levels in this age group. The aim of the present analysis was to investigate stability of activity over a 10-year period and identify potential correlates of sustained activity levels in older adults.
Design Analyses of data from the English Longitudinal Study of Ageing. Participant-reported physical activity data were collected in 2002 (baseline), 2004, 2006, 2008, 2010 and 2012. Participant age, sex, smoking, depressive symptoms, work status, wealth, and long-standing illness were recorded at baseline. Multiple logistic regression was used to examine associations between baseline exposure variables and persistent physical activity (reporting moderate and/or vigorous physical activity at least once a week at all 6 assessments over the 10-year time period).
Results A total of 5022 participants (mean age 61 years; 2114 male) were included in the analyses. There was reasonable stability in the physical activity measure over the 6 time points (Cronbach's α 0.85). There was an overall trend for increasing levels of inactivity and a reduction in vigorous activity. Age, female sex, having ever smoked, long-standing illness, arthritis, obesity, and depressive symptoms were associated with a lower likelihood of being persistently active (defined as reporting moderate and/or vigorous physical activity at least once a week over all 6 assessment points). Those with greater wealth were 4 times more likely to be persistently active.
Conclusions In the present analyses time spent in vigorous-intensity activity declined in later life. A range of sociodemographic and biomedical factors were associated with being persistently active in older adults.
- EPIDEMIOLOGY
- PUBLIC HEALTH
- SOCIAL MEDICINE
This is an Open Access article distributed in accordance with the Creative Commons Attribution Non Commercial (CC BY-NC 4.0) license, which permits others to distribute, remix, adapt, build upon this work non-commercially, and license their derivative works on different terms, provided the original work is properly cited and the use is non-commercial. See: http://creativecommons.org/licenses/by-nc/4.0/
Statistics from Altmetric.com
Strengths and limitations of this study
The English Longitudinal Study of Ageing presents a unique opportunity to examine patterns in physical activity behaviour since data have been collected every 2 years over a 10-year period using the same instrument.
We found an overall trend for increasing levels of inactivity and reducing vigorous activity in older people.
Increasing age, female sex, having ever smoked, long-standing illness, arthritis, obesity, and depressive symptoms were associated with a lower likelihood of being persistently active. Those with greater wealth were four times more likely to be persistently active.
These data are crucial in helping inform interventions to boost activity as well as promote long-term maintenance of physical activity over time.
Participants lost to follow-up were older and less active at baseline, thus the levels of persistent activity over 10 years may be overestimated.
Introduction
In older adults (50 years and over) regular participation in physical activity has been found to be associated with reduction in risk of cardiovascular disease, diabetes, and certain cancers, as well as the prevention of falls, and greater independence.1–6 However, despite these benefits in this age group physical activity levels are low. In the ‘oldest old’ British adults (75+ years), only 1 in 10 men and 1 in 20 women meet the physical activity guidelines.7
Previous studies have investigated levels of physical activity and sedentary time across the life course in young, middle-aged and older-aged adults and found that in general physical activity levels decrease with age and sedentary time increases.8–10 However, to date, studies have not investigated how levels of activity intensity fluctuate throughout later life in older adults. It is plausible to assume that as individuals age physical activity levels of a moderate-to-high intensity will decrease, owing to a decrease in functional fitness. It is also likely that as individuals age through later life, discretionary time will increase that may be spent in sedentary leisure activities, such as television viewing.11 In support, data suggests that adults aged 65 years and over watch more television than any other age group (http://www.stakeholders.ofcom.org.uk). Understanding whether there is natural fluctuation in physical activity in this age group is important for intervention assessment.
To date, few interventions have been carried out to increase physical activity levels in older adults, and effects are usually limited and short-lived.12 To design effective interventions to increase physical activity levels in this age group correlates of sustained physical activity behaviour need to be identified and understood. Modifiable (eg, physical environmental) correlates provide mechanisms via which behaviour change might be achieved, and non-modifiable (eg, demographics) correlates indicate which groups are most at risk and so most in need of intervention.
Physical activity correlates in adult (18 years and over) populations, have been well established.13 ,14 However, such correlates in older adults are less explored and evidence has tended to come from cross-sectional studies that limit our ability to understand associations with longer term physical activity adherence. Factors that tend to be associated with higher physical activity levels in older adults include male sex, younger age, being married, having higher levels of education, income and socioeconomic status (SES), having better physical health, body mass index (BMI) and waist circumference, having lower levels of chronic disease and depression.15–17 Moreover, in a recent systematic review it was found that exercise and leisure time physical activity increased after the retirement transition.18 Another cross-sectional study in 1566 men aged 71–91 years residing in the UK found that those who were depressed, smoked, were obese or suffered more chronic health conditions spent more of the day in prolonged sedentary spells.19 Currently it is not known if the identified correlates are associated with sustained physical activity or sedentary behaviour as individuals’ age through later life. Understanding how these correlates influence sustained activity levels as one ages is essential for the long-term success of interventions. The English Longitudinal Study of Ageing (ELSA) presents a unique opportunity to examine patterns in physical activity behaviour since data have been collected every 2 years over a 10-year period using the same instrument. The aim of the present analysis was to investigate stability of activity over a 10-year period and identify potential correlates of sustained activity levels in a sample of older adults residing in England.
Methods and procedures
ELSA is a cohort containing a nationally representative sample of the English population living in household and consists of males and females born on or before the 29 February 1952.20 The sample was drawn using multistage stratified probability sampling with postcode sectors selected at the first stage and household addresses selected at the second stage. The overall response rate was 70% at the household level and 67% at the individual level. For the purpose of the present analyses data collected at wave 1 (2002) were used to derive exposure variables and data collected at wave 2 (2004), wave 3 (2006), wave 4 (2008), wave 5 (2010) and wave 6 (2012) were used to derive the outcome variable.
Outcome variable: physical activity level
At each time point participants were asked how often they took part in vigorous-intensity (eg, running/jogging, swimming, cycling, aerobics/gym workout, tennis, and digging with a spade), moderate-intensity (gardening, cleaning the car, walking at moderate pace, dancing) and low-intensity (laundry and home repairs) physical activity, using prompt cards with different activities to help them interpret different physical activity intensities. Response options were: more than once a week, once a week, one to three times a month, and hardly ever/never. At each time point physical activity was further categorised into four categories classified as: inactive; only light activity at least once a week (but no moderate or vigorous); moderate activity at least once a week (but no vigorous), and vigorous activity at least once a week. These thresholds were chosen based on previous work in ELSA demonstrating robust dose–response associations with mortality.21 The main outcome of interest was ‘persistently active,’ defined as reporting moderate and/or vigorous physical activity (MVPA) at least once a week over all six assessment points. The physical activity measure used in ELSA has demonstrated convergent validity in grading a plethora of psychosocial, physical and biochemical risk factors in previous work.22–24
Exposure variables
Exposure variables were selected as they have been previously identified as cross-sectional correlates of older adult physical activity15–19 and collected in ELSA. Participants reported their age and sex. Trained interviewers asked questions on cigarette smoking (never, previous or current), depressive symptoms (using the 8-item Centre of Epidemiological Studies Depression Scale), work status (employed, retired or other (permanent sickness leave, home maker or unemployed seeking work)) and long-standing illness (yes/no). Wealth was used as our measure of SES, as this has been shown to best capture the material resources available to older adults.25 Wealth was calculated as net of debt and included the total value of the participant's home (excluding mortgage), financial assets such as savings, business assets, and physical wealth such as artwork or jewellery. Trained research nurses measured participants’ height and weight (while participants wore light clothing). BMI was calculated in kg/m2.
Analyses
Characteristics of the study population at baseline were analysed using descriptive statistics. We examined stability of the physical activity measure across time using reliability analysis (Cronbach's α). Multiple logistic regression was used to examine the association between baseline exposure variables and persistent physical activity. All analyses were conducted using SPSS V.22.
Results
Interviews at baseline (2002–2003) were carried out with 11 391 individuals (5186 men and 6205 women). Over the follow-up period there were 1896 deaths, and 4473 participants did not provide data for one or more of the follow-up assessments. Thus, the analytic sample comprised 5022 (2114 men, 2908 women) participants who provided complete physical activity data from all six waves of assessment, representing 44.1% of the total baseline sample. Compared with the analytic sample, those lost to follow-up were older (61.3 vs 66.2 years, p=0.001), reported higher levels of baseline physical inactivity (5.7% vs 13.9%, p=0.001) and higher prevalence of long-standing illness (51.1% vs 59.2%, p=0.001).
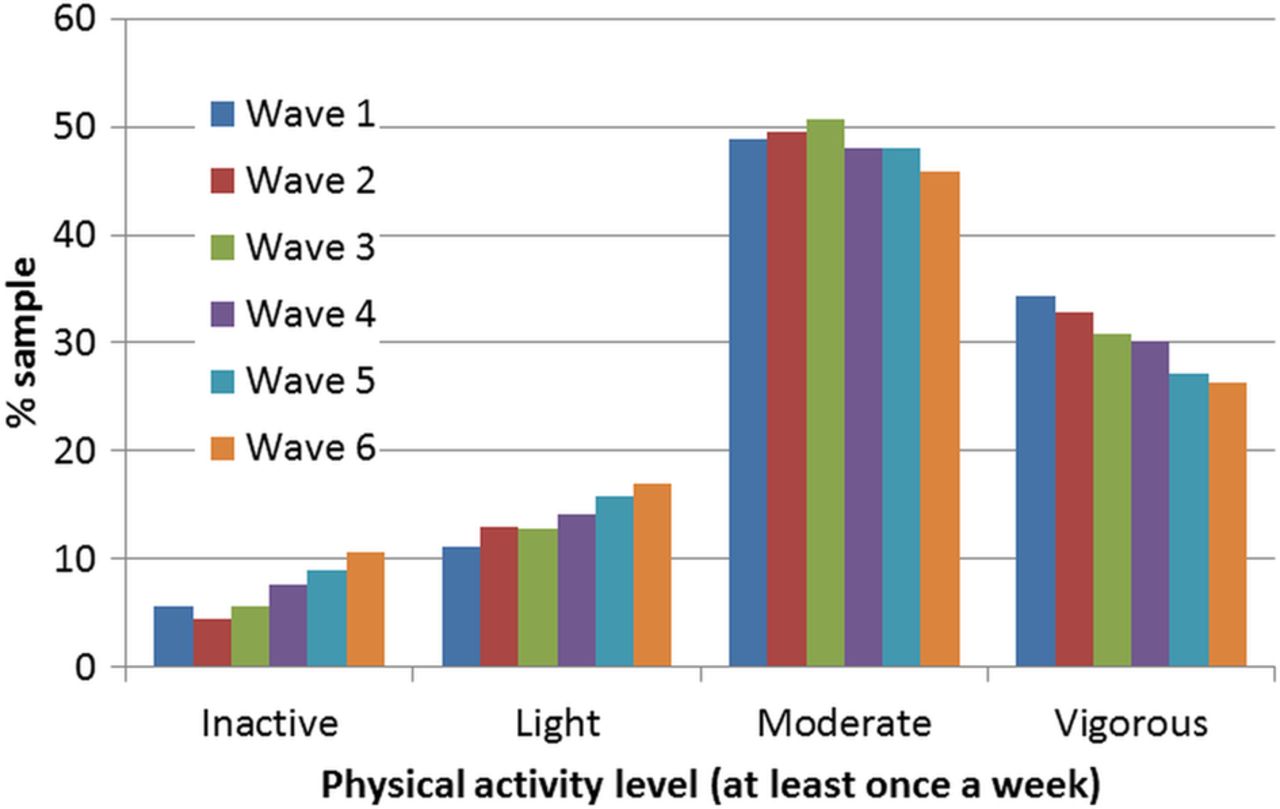
At baseline, 5.7% of the sample reported no regular physical activity, 11.1% reported only light activity at least once a week, and moderate and vigorous intensity activity was reported in 48.8% and 34.4%, respectively. There was reasonable stability in the physical activity measure over the six waves of assessment (Cronbach's α=0.85). However, there was an overall trend for increasing levels of inactivity and a reduction in vigorous activity (see figure 1). Just under half (49%) of the sample were defined as persistently active (reporting moderate and/or vigorous physical activity at least once a week over all 6 assessment points); 3.7% could be defined as persistently low active (inactive or only light activity over all 6 assessment points); the remainder were inconsistent and fluctuated between the different physical activity categories. The persistently active tended to be younger, employed, more likely to be men and in the highest wealth quintile, less likely to have smoked, have depressive symptoms, a long-standing illness or obesity (see table 1).
Baseline characteristics in relation to 10-year physical activity pattern
Patterns in physical activity behaviour across 10 years (2002–2012) in older adults (n=5022).
In multivariable adjusted models age, female sex, ever smoker, long-standing illness, arthritis, obesity, and depressive symptoms were associated with a lower likelihood of being persistently active (table 2). Whereas greater wealth was associated with over four times higher odds of being persistently active. In a crude unadjusted model employment was associated with over a twofold increased odds (OR=2.36, 95% CI 2.08 to 2.67) of being persistently active, although was attenuated to the null in the final adjusted model.
Predictors of being persistently active over 10 years
Discussion
Patterns of physical activity
This is the first study to investigate the stability of physical activity in older English adults over a 10-year period. The ELSA study design enabled us to uniquely track physical activity levels every 2 years over a 10-year period in the same individuals. In this study we defined ‘persistently active,’ as reporting moderate and/or vigorous physical activity (MVPA) at least once a week over all six assessment points. Findings suggest in this age group physical activity levels are fairly stable. However, we have identified a trend for inactivity and light activity to increase and moderate and vigorous activity to decrease as people age. This somewhat supports previous research, for example, in a population sample of elderly adults residing in Serbia the level of physical activity was found to typically decrease with age.8 In our sample of older English adults it may be that moderate or vigorous intensity physical activity are being replaced by those of a lighter intensity, as in general one's perception of their ability to participate in moderate and vigorous activities in later life may change. This is likely owing to a decrease in levels of functional fitness, such as reductions in muscle strength, flexibility, agility and endurance.26 Given the important health benefits of regular participation in moderate intensity physical activity interventions that prevent a displacement of MVPA with light activity or inactivity may be useful. Such an intervention may aim to promote those activities of a moderate intensity that do not necessarily require high levels of functional fitness (eg, brisk walking), such interventions may yield long-lasting effects.
Correlates of sustained activity levels
This is also the first study to investigate correlates of sustained physical activity over a 10-year period in a sample of older English adults. The present analyses found that females, smokers, and those who have a long-standing illness, depressive symptoms, arthritis and were obese were less likely to be persistently active over 10 years. This supports and adds to previous cross-sectional research that has shown that these correlates, and those that are similar (eg, those studies that have used different measures of SES), are associated with lower levels of physical activity when measured at a single point in time.15–17 Those who fall into any of these categories may be at greatest risk of not being persistently active and interventions may be best targeted at these specific populations. Also in support of previous cross-sectional literature, participants who had greater wealth were much more likely to be persistently physically activity over a 10-year period. It is reasonable to assume that those who have greater wealth have more disposable income to spend on leisure activities as oppose to choosing cheaper alternative sedentary leisure activities, such as television viewing. Less wealth may also reflect adverse socioeconomic position across the life course (ie, childhood socioeconomic position, adult socioeconomic position and area of residence) that has been associated with an increased cumulative risk of low physical activity in older women.27
In contrast to previous literature in final adjusted models no significant differences were present between those who were employed and those who were retired.18 One plausible explanation is that some retired participants continue to undertake paid and unpaid work (eg, voluntary work, caring for sick spouse/family) that may have diluted the true association between ‘not working owing to retirement’ and ‘working.’
Implications for physical activity promotion
Our data have important implications for physical activity promotion. First, by highlighting the demographics of those at greatest risk of not being persistently active, our data point to specific populations at whom interventions may be most fruitfully targeted. Tailoring intervention to at-risk groups can be effective. Interventions targeting low-income groups have been shown to increase physical activity, and have the potential to benefit disadvantage populations more than other groups.28 Interventions tailored to specific health conditions can increase activity and also have positive effects on pain and physical functioning.29 Second, our data reveal variability in physical activity engagement over time; approximately half of the sample were not consistently active over the 10-year study period. This speaks to the need for interventions to boost activity as well as promote long-term maintenance of activity over time.
Strengths and limitations
The clear strengths of the present analysis include its longitudinal design over a 10-year period, (incorporating the same physical activity questions at each follow-up), and its large population-based sample of older adults in England. However, several limitations should also be noted. The data are based on self-report, although participants are likely to systematically overestimate their activity thus it is unlikely that this would have influenced the trends over time we have observed. Moreover, the self-reported physical activity variable has previously been shown to be moderately correlated with objectively assessed hours per day of moderate-vigorous intensity activity (Spearman's r=0.21, p=0.020).22 Based on the information gathered in ELSA we were unable to define the recommended physical activity threshold (2.5 h MVPA per week). However, we do believe the chosen threshold is meaningful regarding health outcomes in this cohort, as supported by our previous work.21 ,22 ,30 ,31 Participants lost to follow-up were older and less active at baseline, thus in combination with over-reporting bias, the levels of persistent activity over 10 years may be overestimated. Another limitation includes the lack of potential modifiable correlates collected in this study. Further research that identifies modifiable correlates of physical activity trends in older adults is warranted.
Conclusion
In this sample of older English adults moderate and vigorous intensity activities decreased with age whereas light activity and inactivity steadily increased. A range of sociodemographic and biomedical factors was associated with being persistently active over 10 years. These data are crucial in order to inform the design of interventions to boost activity as well as promote long-term maintenance of activity over time.
References
Footnotes
Contributors LS drafted the paper. LS, BG, AF and MH contributed to the concept and design of the study and critical revision of the manuscript.
Funding The data was made available through the UK Data Archive. ELSA was developed by a team of researchers based at University College London, the Institute of Fiscal Studies and the National Centre for Social Research. The funding was provided by the National Institute on Ageing in the USA (grants 2R01AG7644-01A1 and 2R01AG017644) and a consortium of UK government departments coordinated by the Office of National Statistics. LS was supported by the National Institute for Health Research's School for Public Health Research. MH was supported by the British Heart Foundation (RE/10/005/28296). AF was supported by a Cancer Research UK programme (grant number C1418/A141).
Competing interests None declared.
Patient consent Obtained.
Ethics approval In accordance with the University College London Research Ethic Committee guidance, ethical approval was not required to perform secondary analyses on anonymous health surveillance survey data.
Provenance and peer review Not commissioned; externally peer reviewed.
Data sharing statement No additional data are available.