Article Text

Abstract
AIMS The vertical cup/disc ratio (CDR) has long been used in the assessment of the glaucoma suspect, though the wide range of CDR values in the normal population limits its use. Cup size is related physiologically to disc size and pathologically to glaucomatous damage. Disc size can be measured at the slit lamp as the vertical disc diameter (DD). The ability of the CDR, in relation to DD, to identify glaucomatous optic discs was investigated.
METHODS 88 normal, 53 early glaucoma, and 59 ocular hypertensive subjects underwent stereoscopic optic disc photography and clinical biometry. Photographs were analysed in a masked fashion by computer assisted planimetry. The relation between vertical cup diameter and DD was explored by linear regression, and expressed in terms of CDR. The upper limit of normal was defined by the 95% prediction intervals of this regression (method 1) and by the upper 97.5 percentile for CDR (method 2). The sensitivity and specificity of CDR to identify an optic disc as glaucomatous was tested with these disc size dependent and disc size independent cut offs in small, medium, and large discs.
RESULTS The CDR was related to DD by the equation CDR = (−1.31 + (1.194 × DD))/DD. The sensitivity in small, medium, and large discs was 80%, 60%, and 38% respectively for method 1 and 33%, 67%, and 63% respectively for method 2. Specificity was 98.9% (method 1) and 97.7% (method 2).
CONCLUSIONS The CDR, relative to disc size, is useful clinically, especially to assist in identifying small glaucomatous discs.
- cup/disc ratio
- glaucoma
- imaging
Statistics from Altmetric.com
Primary open angle glaucoma is a progressive optic neuropathy and its development is associated with loss of tissue in the neuroretinal rim of the optic disc and a consequent increase in the size of the optic cup. It is possible to quantify the areas of the optic disc, neuroretinal rim, and optic cup by computer aided analysis of optic disc photographs (planimetry)1 2 or by more recently available imaging techniques, such as scanning laser ophthalmoscopy,3 video-ophthalmography,4 and simultaneous stereo optic disc photography with digital photogrammetry.5 However, only the most fortunate of clinicians has access to these methods for routine clinical work, and optic disc evaluation is usually performed at the slit lamp.
The pattern of neuroretinal rim loss, and cup enlargement may take the form of focal or diffuse change, or both in combination.6Focal change, with the loss of the physiological shape of the neuroretinal rim,2 7 is identified by careful clinical examination. Diffuse change, with maintenance of the physiological rim shape, is much more difficult to identify. It is in these cases that quantification of the neuroretinal rim area or cup size is useful. Methods have been described to estimate the area of the neuroretinal rim during ophthalmoscopic examination, but several measurements and calculations8 or additional equipment9 are required. Clinical estimation of the size of the cup remains the simplest and most frequently performed assessment of the optic disc in the diagnosis and follow up of the glaucoma suspect. The estimation of the size of the cup is usually made by comparison with the size of the disc, and given as the ratio of the vertical diameter of the cup to the vertical diameter of the disc (vertical cup/disc ratio or CDR).10-13 This ratio has only limited value in the identification of glaucomatous optic discs because there is a wide variation in the size of the cup in the normal population.2 14-17 This variability arises largely because of the physiological relation between optic disc size and cup size,2 16 17 so that large optic discs have a large cup, and small discs should have a small, or absent, cup. The difficulty that the clinician has when seeing a patient referred with a large cup is to decide whether the cup is physiological in a large disc, or pathological in a small or normal sized disc. Similarly, a small cup in an ocular hypertensive patient may be pathological if the disc is small.
Recent papers have demonstrated that it is possible to measure the size of the optic disc at the slit lamp with a variety of lenses.8 18-20 The purpose of this study was to determine whether the vertical cup/disc ratio, in relation to optic disc size, is a useful measure to identify patients with early glaucoma.
Methods
SUBJECTS
Three groups of subjects, normal controls, patients with early glaucomatous field defects, and ocular hypertensive patients, were recruited prospectively as part of a study on the treatment of ocular hypertensive patients and the early detection of glaucoma (approved by the hospital advisory research committee). All subjects gave informed consent to the investigations performed, and each had the following: medical and ocular history, slit lamp biomicroscopy, clinical assessment of the vertical CDR, tonometry, fundus examination, visual field testing, and optic disc photography.
Normal subjects
Eighty eight subjects recruited were friends or spouses of patients attending the ocular hypertension clinic at Moorfields Eye Hospital (n = 40), hospital staff (n = 16), or volunteers responding to advertisements on the hospital notice boards and in a pensioners’ magazine (n = 32). Restriction criteria were: white ethnic group, ametropia <6 dioptres, visual acuity of 20/30 or better, normal visual fields, intraocular pressure of <21 mm Hg, no previous ocular history involving the posterior segment, and no family history of glaucoma involving a first degree relative. All subjects performing a normal field test were included irrespective of optic disc appearance. One eye was included in the study, chosen at random if both were eligible.
Glaucoma patients
Fifty three subjects were taken from the hospital’s general glaucoma clinic (n = 39) and from the ocular hypertension clinic (n = 14). The former group were referred to the study on the basis of visual field defect and ocular hypertension only and the latter group were patients with ocular hypertension who developed reproducible visual field defects while under review. Restriction criteria were: white ethnic group, ametropia <6 dioptres, visual acuity of 20/30 or better, a visual field defect reproduced on at least three successive occasions, open anterior chamber angle, intraocular pressure >21 mm Hg at diagnosis and no other posterior segment eye disease. One eye was included in the study, chosen at random if both were eligible.
Ocular hypertensive subjects
Subjects referred to Moorfields Eye Hospital with raised intraocular pressure were evaluated in the ocular hypertension clinic. Fifty nine consecutive patients were entered into this part of the study. Restriction criteria were: white ethnic group, ametropia <6 dioptres, visual acuity of 20/30 or better, normal visual fields, intraocular pressure of ⩾25 mm Hg before entry into the treatment trial, and no previous ocular history involving the posterior segment. All subjects performing a normal field test at entry to the treatment trial were included irrespective of optic disc appearance. One eye was included in the study, chosen at random if both were eligible.
VISUAL FIELD TESTING
All visual field testing was performed using the Humphrey field analyser 24-2 program. Reliability criteria applied were: fixation losses <30%, false positive responses <15%, and false negative responses <30%.
A normal visual field was taken to be one in which the retinal sensitivity at all locations was better than the eccentricity related thresholds given in the Advanced Glaucoma Intervention Study (AGIS) protocol.21
A glaucomatous visual field was taken to be one in which a defect was reproduced on three successive occasions at the same location. Only patients scoring 1–5 (early glaucoma) on the AGIS protocol were included.
Visual fields were assessed by an independent glaucoma expert without access to clinical information, so that optic disc assessment did not form part of the diagnostic criteria.
OPTIC DISC PHOTOGRAPHY AND PLANIMETRY
Subjects’ pupils were dilated with 1% tropicamide. Keratometry readings, taken with a calibrated Javal-Schiotz keratometer, and spectacle refraction were used to correct for ocular magnification using a Littmann algorithm.22 23 Photographs of the optic disc were taken with the Canon CF60U at the 30 degree setting. Four sequential photographs of each eye were taken, with a lateral shift in camera position after two pictures, to obtain a stereo effect when the images are viewed stereoscopically. The camera is not of a telecentric design, and the camera magnification for differing degrees of ametropia was calculated by photographing a target of known dimensions in a model eye set at varying degrees of ametropia.24
Photographs were analysed by computer assisted planimetry using thedisc-data, Thot Informatique (Pr Bechtoile, Angers, France) program. The technique, and repeatability of measurements in this unit, has been reported previously.25
The optic disc photographs of the control subjects and glaucoma patients were added to those of the ocular hypertensive patients and then examined in a masked fashion by one experienced observer (DG-H).
Optic disc anatomy was defined according to the following conventions26 27: the area of the disc was defined as the area within Elschnig’s ring, the cup was defined on the basis of contour, not pallor, and the neuroretinal rim/optic cup border was taken as the level at which the slope of the rim steepens. Vessels were considered to be part of the cup if there was no underlying rim tissue. Change in direction of vessels in the optic disc was used as a guide to the neuroretinal rim edge in those photographs where the stereo impression was not good.
The output of the disc-data program includes optic disc, cup, and neuroretinal rim areas for the whole disc and for individual 30 degree segments, the vertical and horizontal diameters of optic disc and cup, and vertical and horizontal CDR.
CLINICAL EVALUATION OF THE CDR
The evaluation of the vertical CDR was performed by the same clinician for all subjects (observer 1), and a subset of 30 ocular hypertensive patients were re-examined 4 months later by a second clinician (observer 2), without reference to the previous examination. Examination was performed at a Haag-Streit slit lamp with a Volk 90D lens, and the same criteria to define the optic disc and cup were used as with the planimetric examination.
The vertical CDR was taken to be the longest vertical cup diameter divided by the longest vertical disc diameter.12 13Estimates were made to the nearest 0.05.
STATISTICAL ANALYSIS
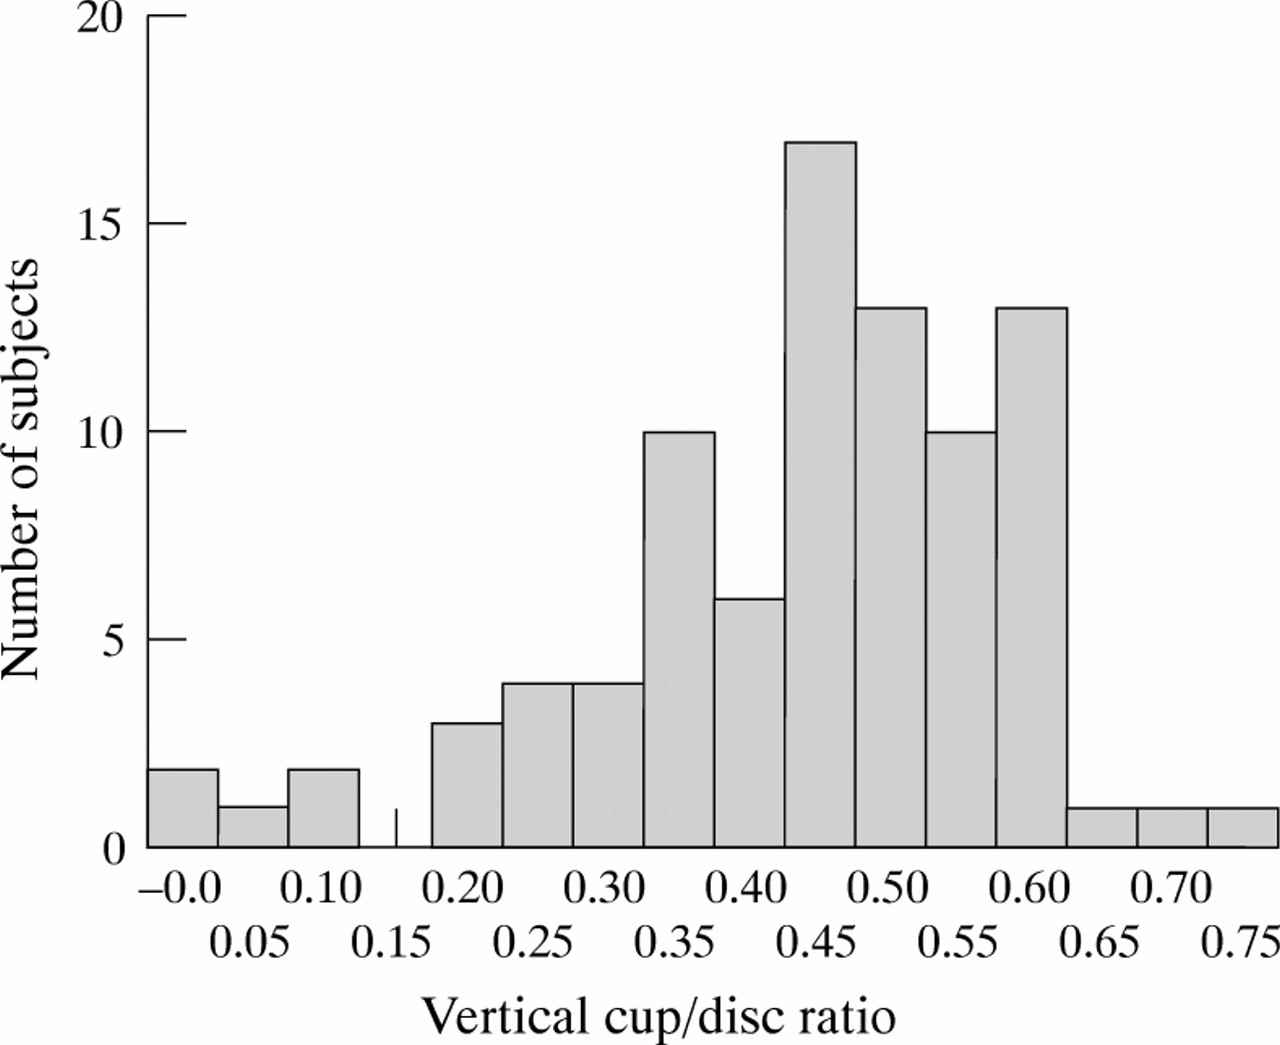
Statistical analysis was performed with the aid of the softwarespss for Windows (Version 7.0). Multiple linear regression analysis was performed on the control group data, with vertical cup diameter as the dependent variable, and vertical optic disc diameter, age, sex, eye side, intraocular pressure, refraction, and keratometry as independent variables. An equation for the relation between CDR and vertical disc diameter was derived from the regression analysis between vertical optic cup diameter and vertical optic disc diameter. The 95% prediction intervals of the analysis were used to define the normal range. For comparison, a normal range was defined that did not take into account the size of the optic disc. The values for vertical CDR are not normally distributed (Fig 1), so an empirical cut off for the upper limit of normal was taken as the 97.5 percentile.

Distribution of cup/disc ratio values in the control group.
The data from the glaucoma group were used to establish the sensitivity of the methods.
The data from the ocular hypertensive subjects were used to estimate agreement between planimetric and clinical estimates of CDR, and also clinical interobserver agreement.
Results
The study population characteristics are summarised in Table 1.
Summary of subject characteristics
Multiple linear regression analysis of the planimetry data from the control group demonstrated a strong relation between the vertical cup diameter and the vertical optic disc diameter (T = 8.14, p <0.000 ) and a weaker relation with age (T = 2.04, p = 0.045), theR 2 value for the regression was 0.45, p <0.000. The equation for the regression line is
vertical cup diameter =−1.537 + (1.204 × DD) + (0.0037 × age)
Optic cup diameter was not found to be related to sex, eye side, intraocular pressure, refraction, or keratometry. Optic disc diameter was not related to age.
The relation between cup and disc diameter is shown graphically in Figure 2. Omitting age as a variable, linear regression gives the following equation (R 2 = 0.42, p <0.000):
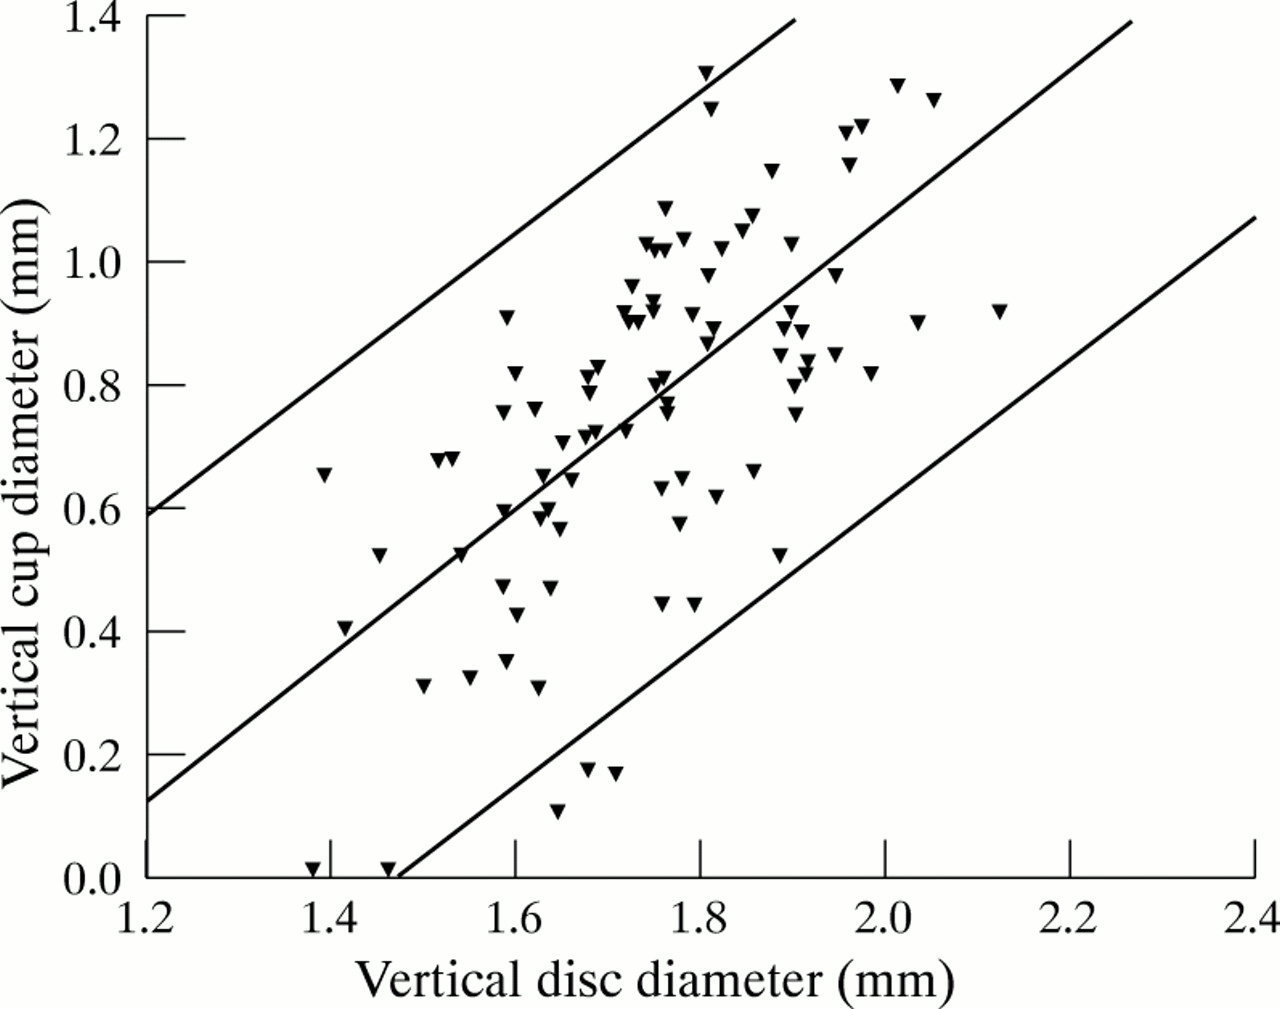
Plot of vertical cup diameter against vertical disc diameter. Mean (regression line) (R2 = 0.42, p <0.000) and 95% prediction intervals shown.
vertical cup diameter = −1.31 + (1.194 × DD)
The upper limit of normal (95% prediction intervals) is expressed by
vertical cup diameter = −0.87 + (1.193 × DD)
The vertical CDR (Fig 3) may, therefore, be expressed by

Plot of vertical cup/disc ratio against vertical disc diameter. (A) Control subjects. (B) Glaucoma patients. Solid line, mean (disc size dependent); broken line, upper limit of normal (disc size dependent); dotted line, upper limit of normal (disc size independent).(The vertical disc diameter is calculated from measurements of optic disc photographs using the Littmann correction for ocular magnification. When measuring the optic disc at the slit lamp, the correction factor for the 78 D lens is 1.11 and for the 90 D lens 1.39 (unpublished data presented at Glaucoma Society (UK & Eire) Annual Meeting, November 1996)).
vertical CDR = (−1.31 + (1.194 × DD))/ DD
and the upper limit of normal (95% prediction intervals), by
vertical CDR = (−0.87 + (1.193 × DD)) /DD
Using this equation, the sensitivity and specificity of the CDR to identify glaucomatous discs was 62.3% and 98.9% respectively. This compares with the cut off of the upper 97.5 percentile (0.682) which gives a sensitivity of 56.6% and specificity of 97.7%. The sensitivity and specificity for different cut off values of CDR is shown in Table 2. The sensitivity to identify discs as glaucomatous varies according to disc size. The two methods are compared in three disc size groups (small, lower quartile; medium, middle quartiles; large, upper quartile) and the results are given in Table 3.
Sensitivity and specificity to identify optic discs as abnormal at different cut off values for cup/disc ratio (CDR) (independent of disc size)
Number of optic discs identified as abnormal, in three optic disc size groups, using disc size dependent and disc size independent cut offs
The normal ranges for neuroretinal rim area can be defined by the prediction intervals of the linear regression between neuroretinal rim area and optic disc area, for the whole disc and each 30 degree segment.28 In this way, rim loss can be characterised as diffuse (neuroretinal rim area for the whole disc outside the normal range) or focal (segments only outside the normal range). Of the glaucoma patients, 11 of 53 had diffuse rim loss; 10 of these had a CDR outside the normal range on the disc size dependent measure. In addition, 23 of 42 patients with focal loss had an abnormal CDR.
Agreement between clinical (observer 1) and planimetric estimates for CDR in the ocular hypertensive subjects is shown in Figure 4. The mean difference was 0.03 with a standard deviation of 0.07. There was a slight, but significant, tendency for the clinician to underestimate small cups relative to the planimetric measurement (R 2 = 0.15, p = 0.003).

Agreement between clinical and planimetric estimation of cup/disc ratio (ocular hypertensive patients). Mean and 95% prediction intervals shown.
Agreement of clinical estimates between the two observers was excellent. Ninety three per cent of estimations were at or within 0.05 CDR and differences of >0.05 occurred at small values of CDR, where the CDR has only a small affect on neuroretinal rim area. There was a slight, but significant (R 2 = 0.13, p = 0.05), tendency for observer 1 to underestimate small cups and overestimate large cups, relative to observer 2 (Fig 5).

Agreement between two clinicians’ estimation of CDR (ocular hypertensive patients). Mean and 95% prediction intervals shown.
Discussion
Since the last century enlargement of the optic cup has been recognised as an important morphological feature of the glaucomatous eye.29 Cupping is an early sign and progression of cupping has been observed in ocular hypertensive patients6 30 31and in glaucoma patients, before the onset of visual field damage.27 32-34 An enlarged cup is a predictor of subsequent field loss.34-37
In attempting to quantify the size of the cup, many observers have compared the size of the cup to the size of the disc—as a ratio of cup area to disc area,38 39 cup circumference to disc circumference,40 or cup diameter to disc diameter.14 41-43 The simplest method, for the clinician examining a patient at the slit lamp, is to express cup size as the ratio of cup diameter to disc diameter. Initially, this was estimated in the horizontal meridian,14 42 but since it has been emphasised that the cup tends to enlarge in the vertical meridian in glaucoma,10 44-46 the estimate is now usually made in the vertical meridian.11 15 31
It has been recognised for some time that there is a wide range of optic cup size in normal eyes,14 15 38 42 47 with CDRs from 0.00 to 0.87 at the extremes.2 Much of the variability in cup size results from the physiological relation between the size of the cup and the size of the optic disc. This relation was rediscovered in the 1970s,2 16 17 although it was demonstrated by Elschnig on the basis of histological work at the end of the last century.47 The rate at which cup diameter increases with disc diameter, as defined by planimetry in this study, is very close to that found by planimetry in a population based study from Sweden: vertical cup diameter = −1.405 + (1.16 × vertical disc diameter) + (0.002 × age).48 This relation means that the CDR also varies with disc size.17 Healey and colleagues recently reported a population based study in which they determined the increase in CDR with increasing vertical disc diameter.49 The mean CDR found was 0.43, which compares with 0.44 in this study. Exact comparison of optic disc size is not possible, as a different method was used to correct for ocular magnification23 and camera magnification is not stated. However, they report an increase in the CDR from 0.26 to 0.55 when disc size increases from 1.00 to 2.00 mm. A similar increase in CDR was found in this study as disc size increased from 1.40 to 2.10 mm (Fig3). Healey and colleagues concluded that the change in CDR with disc size was of sufficient magnitude to warrant the measurement of disc size when assessing the CDR.
Initial attempts to find a useful CDR cut off value to separate normal and glaucomatous eyes were made without the knowledge of the relation between cup size and disc size and on the basis of the distribution of absolute values for CDR in the normal population. In a number of studies, the proportion of normal subjects with a CDR of 0.65 or greater ranged from about 2.2% to 4%14 15 35 and a study of ocular hypertensive and glaucoma patients50 found that the incidence of visual field defects increased markedly with CDRs greater than 0.7. However, the ability of the CDR to distinguish between normal and early glaucomatous optic disc has been found to be poor with a sensitivity and specificity of 64% and 57% from a clinic based study51 and 52% and 89%, at a cut off of ⩾0.5, from a population based study.52 A cut off of ⩾0.5 in this study gives a specificity of 64% and sensitivity of 92% (Table2). Calculations of sensitivity and specificity, for any given cut off value, depend entirely on the nature of the groups compared, and it is interesting to consider how these groups might differ to give such disparate sensitivities and specificities. It has been established that the normal optic disc morphology may vary between racial groups.53-55 Black Americans have larger, more vertically oval discs, with a larger vertical CDR.53 55 Thus, in a mixed population, a cut off of ⩾0.5 will have lower specificity, with a similar (or slightly greater) sensitivity. It may be possible to overcome this difficulty by using the nomogram presented in this paper (Fig 3), which takes disc size differences into account. The nomogram was derived from our control group, which comprised only white subjects, and the application of the nomogram will only be valid if the relation between optic disc size and CDR is similar in racial groups other than white. This needs further investigation.
Evaluating a test such as this on a glaucoma clinic population may result in overestimation of the sensitivity of the test. Although optic disc cupping was not assessed for inclusion of patients into our early glaucoma group, the patients were largely taken from the glaucoma clinic where the diagnosis of glaucoma is made, in part, on the basis of cup enlargement. Application of the method to a population based group would give a better indication of the true sensitivity of the test.
Variation between observers in the judgment of the CDR is notoriously high.56 However, it has been clearly demonstrated that agreement can be substantial given the right conditions.12 13 Agreement between observers,13 56 and single observer consistency,56 is improved under binocular (stereoscopic) conditions. Differences in observations occur when monoscopic and stereoscopic conditions are compared. Binocular viewing of the disc often results in a CDR estimation larger than that under monocular conditions.13 15 56 The effect of examination methods, and of the definition of the variables being measured, on observer agreement has been emphasised.57 58 The interobserver variation is higher, and agreement worse, in studies in which the participants are not given a definition of the variables to be defined,56 than those in which the variables are defined,13 and those in which the participants have undergone training in standardisation.12 It is for these reasons that both viewing conditions and the definition of the variables to be defined must be standardised. Differences in variable definition may also account for the differences found between clinical estimates of the CDR and those derived from image analysers.
A number of techniques to improve the accuracy of clinical cup size estimation have been proposed. These range from careful drawings,38 comparison with diagrammatic charts,14 39 41 photography with subsequent measurement,14 43 59 to measurement of the aerial image of the disc using the indirect ophthalmoscope and calipers.9 The simplest method, for the clinician examining a patient at the slit lamp, is to express cup size as the ratio of cup to disc diameter by comparison with a chart. Whether this results in acceptable accuracy and interobserver agreement needs to be assessed, but the agreement between the two observers in this study suggests that accurate and reproducible assessments are possible.
In this study we found a small, but significant, increase of cup size with age. We have discussed this finding in detail in another publication.60
The modest improvement in sensitivity and specificity in the whole group, obtained by taking optic disc size into account, does not reflect the greater advantage to be gained in clinical practice. The characteristics of patients referred to a glaucoma clinic are different from those of the general population. Many are referred with large cups and normal visual fields, a significant proportion of which will be individuals with physiological cups in large optic discs, and many are referred with moderate cups and risk factors for glaucoma. Subjects with normal sized cups and no risk factors are not referred.
Inspection of Table 3 shows that the ability of the disc size sensitive measure to detect glaucoma cases is greater in smaller (12/15) than in larger (3/8) optic discs. The explanation for this is that loss of neuroretinal rim tissue has a greater impact on the CDR when the CDR is small than when it is large.61 In our data set, a disc with a vertical diameter of 1.40 mm will have a CDR of 0.26. Loss of 10% of the rim area will change the CDR to 0.40, a difference of 0.14. A disc with vertical diameter of 2.10 mm will have a CDR of 0.57. Loss of 10% of the rim area will change the CDR to 0.63, a difference of only 0.06.
A disc size independent cut off will identify all CDRs above a certain level as abnormal. The sensitivity to detect glaucoma will thus be high in large discs, but at the cost of a much increased false positive detection rate in normal, but large, discs.62 This is clearly demonstrated in Figure 3: as disc size increases, more false positive diagnoses are expected if a single CDR cut off value is used.
In clinical practice, when assessing glaucoma suspect referrals with large optic cups but no risk factors for glaucoma, confidence that the optic disc may be normal will be greatly increased by a knowledge of disc size. In referrals with risk factors, knowledge that the disc is large should alert the clinician to exercise caution in placing too much reliance on the size of the cup alone when arriving at a diagnosis. Conversely, in referrals with risk factors and moderate cupping, knowledge that the disc size is small will enable the clinician to suspect glaucomatous damage.
Assessment of the relative size of the optic cup is only part of the clinical evaluation of the optic disc in glaucoma. Other important aspects include assessment of the shape of the neuroretinal rim,2 status of the nerve fibre layer,63 and site and extent of parapapillary atrophy.64 65 In this study there was a high glaucoma detection rate in eyes with diffuse neuroretinal rim loss using the CDR with respect to disc size. Those with notching of the rim and other signs may be picked up by qualitative assessment of the disc.
The actual relation between disc size and CDR, with confidence intervals, in a defined population has not previously been published, and it has therefore not been possible to make use of the knowledge that disc and cup size are related. The nomogram presented in this paper should be a substantial aid to the clinician. The value of the measurement of the CDR in relation to optic disc size is as an important adjunct to the qualitative assessment of the optic disc of glaucoma suspects.
Acknowledgments
The authors wish to thank Dr Alicja Rudnicka for making available a model eye with which to calibrate the fundus camera used in this study. Mr Garway-Heath was supported in this research by a grant from the Guide Dogs for the Blind Association.