Article Text

Abstract
Aim To provide a quantitative assessment of cataract theatre lists focusing on productivity and staffing levels/tasks using time and motion studies.
Methods National Health Service (NHS) cataract theatre lists were prospectively observed in five different institutions (four NHS hospitals and one private hospital). Individual tasks and their timings of every member of staff were recorded. Multiple linear regression analyses were performed to investigate possible associations between individual timings and tasks.
Results 140 operations were studied over 18 theatre sessions. The median number of scheduled cataract operations was 7 (range: 5–14). The average duration of an operation was 10.3 min±(SD 4.11 min). The average time to complete one case including patient turnaround was 19.97 min (SD 8.77 min). The proportion of the surgeons’ time occupied on total duties or operating ranged from 65.2% to 76.1% and from 42.4% to 56.7%, respectively. The correlations of the surgical time to patient time in theatre was R2=0.95. A multiple linear regression model found a significant association (F(3,111)=32.86, P<0.001) with R2=0.47 between the duration of one operation and the number of allied healthcare professionals (AHPs), the number of AHP key tasks and the time taken to perform these key tasks by the AHPs.
Conclusions Significant variability in the number of cases performed and the efficiency of patient flow were found between different institutions. Time and motion studies identified requirements for high-volume models and factors relating to performance. Supporting the surgeon with sufficient AHPs and tasks performed by AHPs could improve surgical efficiency up to approximately double productivity over conventional theatre models.
- treatment surgery
Statistics from Altmetric.com
Introduction
In 2014–2015, over 370 000 cataract operations were performed by the National Health Service (NHS) in the UK.1 This was 3.7 times the number performed in 1989, with cataract surgery being the most common operation undertaken in the UK.2 The demand for cataract surgery is expected to rise still further with increasing life expectancy, rising population size, growing patient expectations and an increase in age-related chronic diseases associated with cataracts, such as diabetes.3 Surgeons are also conducting, and patients are being referred and presenting for, cataract surgery at an earlier stage of the disease.4 In 1990, less than 9% of eyes which underwent cataract surgery had a Snellen acuity of 6/12 or better,4 while two decades later in the period between August 2006 and November 2010, the Royal College of Ophthalmologists’ (RCOphth) National Ophthalmology Database showed that 3%, 5% and 36% of eyes undergoing cataract surgery had preoperative Snellen visual acuities of better than or equal to 6/6, 6/9 and 6/12, respectively.5
With current financial constraints, the increased future demand for cataract surgery within the NHS is liable to be problematic. Meeting an ever-greater demand with a constrained budget requires an improvement in efficiency while, ensuring that standards of patient care are maintained or improved. A recent report from Monitor (Department of Health) estimated that 13%–20% productivity gains might be made in elective ophthalmology if practices were optimised.6 The recently published The Way Forwards report (RCOphth) found a median of seven cases scheduled per theatre list (range 4–12).7 To the authors’ collective experience, NHS cataract lists exist with anything between 5 and 15 patients routinely booked. Why this difference of a threefold difference in productivity between minimum and maximum values exists in public sector cataract surgery has not received the due attention it should.
In 1911, F.W. Taylor introduced the time and motion study (TMS) as an application of the scientific method to the management of workers in order to improve productivity. Historically, TMS was applied to the manufacturing industry. However, it has also been shown to have useful applications within healthcare.8 9 A century after the introduction of scientific management method, there is genuine interest in aggregating knowledge in healthcare workflow, inefficiencies, patient safety and quality. Among several approaches commonly used to date, TMS, which involves continuous and independent observation of clinicians’ work, is generally regarded as a more reliable methodology compared with alternative approaches such as work sampling and time efficiency questionnaires.8 9
To provide a quantitative assessment of the efficiency of cataract surgery across several UK hospitals, we conducted TMS investigations at several different institutions and settings. These included weekend waiting list initiative sessions, the provision of NHS cataract surgery in the private sector, as well as routine cataract surgery lists in NHS hospitals. In particular, we focused on surgical time, surgeon tasks within and outside theatre, patient throughput, staffing levels of allied healthcare professionals (AHPs) and their key tasks and timings. By analysing these variables and investigating correlations between them, we hope to provide greater awareness of different models of practice, to identify important factors leading to differences in the individual number of cataract operations per theatre session and provide information to improve surgical productivity while maintaining high levels of patient safety. To the authors’ knowledge, there are no previous examples of such TMS investigations of cataract surgery with a public health setting in the literature.
Methods
Continuous observation TMS of 18 routine 4-hour cataract theatre sessions, was undertaken in five different hospitals and settings. These settings included two district general hospitals, two teaching hospitals, a weekend waiting list initiative theatre session in an NHS hospital, a dedicated high-volume theatre list in an NHS hospital and an NHS cataract surgery list in a private hospital (table 1). The five institutions studied were the BMI Southend Private Hospital, Norfolk and Norwich NHS Foundation Trust, Guy’s and St Thomas’ NHS Foundation Trust, Southend University Hospital NHS Foundation Trust and West Suffolk NHS Foundation Trust. A consultant ophthalmic surgeon or associate specialist performed all lists, no lists were designated teaching lists. All patients were listed for only routine cataract surgery and all surgeries were conducted by phacoemulsification with intraocular lens insertion under local anaesthesia. All cases were unilateral. The number and type of AHPs supporting each individual theatre list was recorded (table 1).
Details of cataract theatre lists studied
Each list had been observed prior to undergoing TMS investigation in order to identify preliminary staffing models and tasks (tables 1 and 2). Agreement analysis was used to define the list of tasks and then a basic model for each setting was set up and used as a template to observe and time the steps of every defined task (table 2). Each list was observed by one or two ophthalmologists (HWR and JM). Each observer used a template Excel spreadsheet (Microsoft, Redmond, Washington, USA) with specifically designed macros to facilitate the prompt and accurate recording of tasks and their timings.
Task durations in minutes from common tasks across the institutions studied
Noting the start and finish times of some of the key tasks was self-explanatory, while other tasks required specific moments agreed on in advance in order to maintain reproducibility. Surgical start and end times were regarded at the point of insertion or removal of lid speculum. Patient entry time was defined as the time from patient entry into theatre until final positioning for surgery had been achieved. Patient exit time was defined as the time from removal of lid speculum to patient exiting the theatre. Start and end of scrubbing were regarded as the opening of the tap and finishing the gowning process. The start and end of the safety checklist were recorded once the first member of staff began speaking until the last member of staff had finished speaking. The start of the scrub nurse clearing up from the case was the time when the first instrument was passed out or dismantled once the lid speculum had been removed. The end of clearing time was recorded once the scrub nurse re-entered the theatre from the sluice, having disposed of all equipment and waste. The cause and duration of any unexpected delays more than 5 min were recorded.
In addition to defining each key task and its reproducible start and finish, a series of quotients were defined as follows and produced for each setting. The efficiency quotient was defined as the proportion of time that the surgeon was engaged in a task (total surgeon time spent productive/total time).10 The surgery quotient was defined as the proportion of time that surgery was occurring (total surgical time/total time). The theatre utilisation quotient was defined as the utilisation of the maximum available theatre time (time between start of first and end of last case/4 hours).11
Statistics
Data are presented as non-parametric and parametric as appropriate. Differences between the groups were analysed with one-way analysis of variance (ANOVA) test where appropriate. Linear regression models were calculated to estimate the key factors affecting the time to perform the surgery, and the time an individual patient spent in theatre. Descriptive statistics was used to calculate averages and SD of the performances in each list. IBM SPSS Statistics for Windows (V.22.0, IBM) was used to perform the analysis.
Results
TMS of 140 individual cataract operations were prospectively recorded during 18 NHS cataract theatre sessions. All cataract operations were performed with phacoemulsification. All operations were under local anaesthesia. All operations were unilateral. No operations were combined procedures or required additional procedures outside small-incision phacoemulsification cataract extraction and intraocular lens insertion. The details of each theatre session can be seen in table 1.
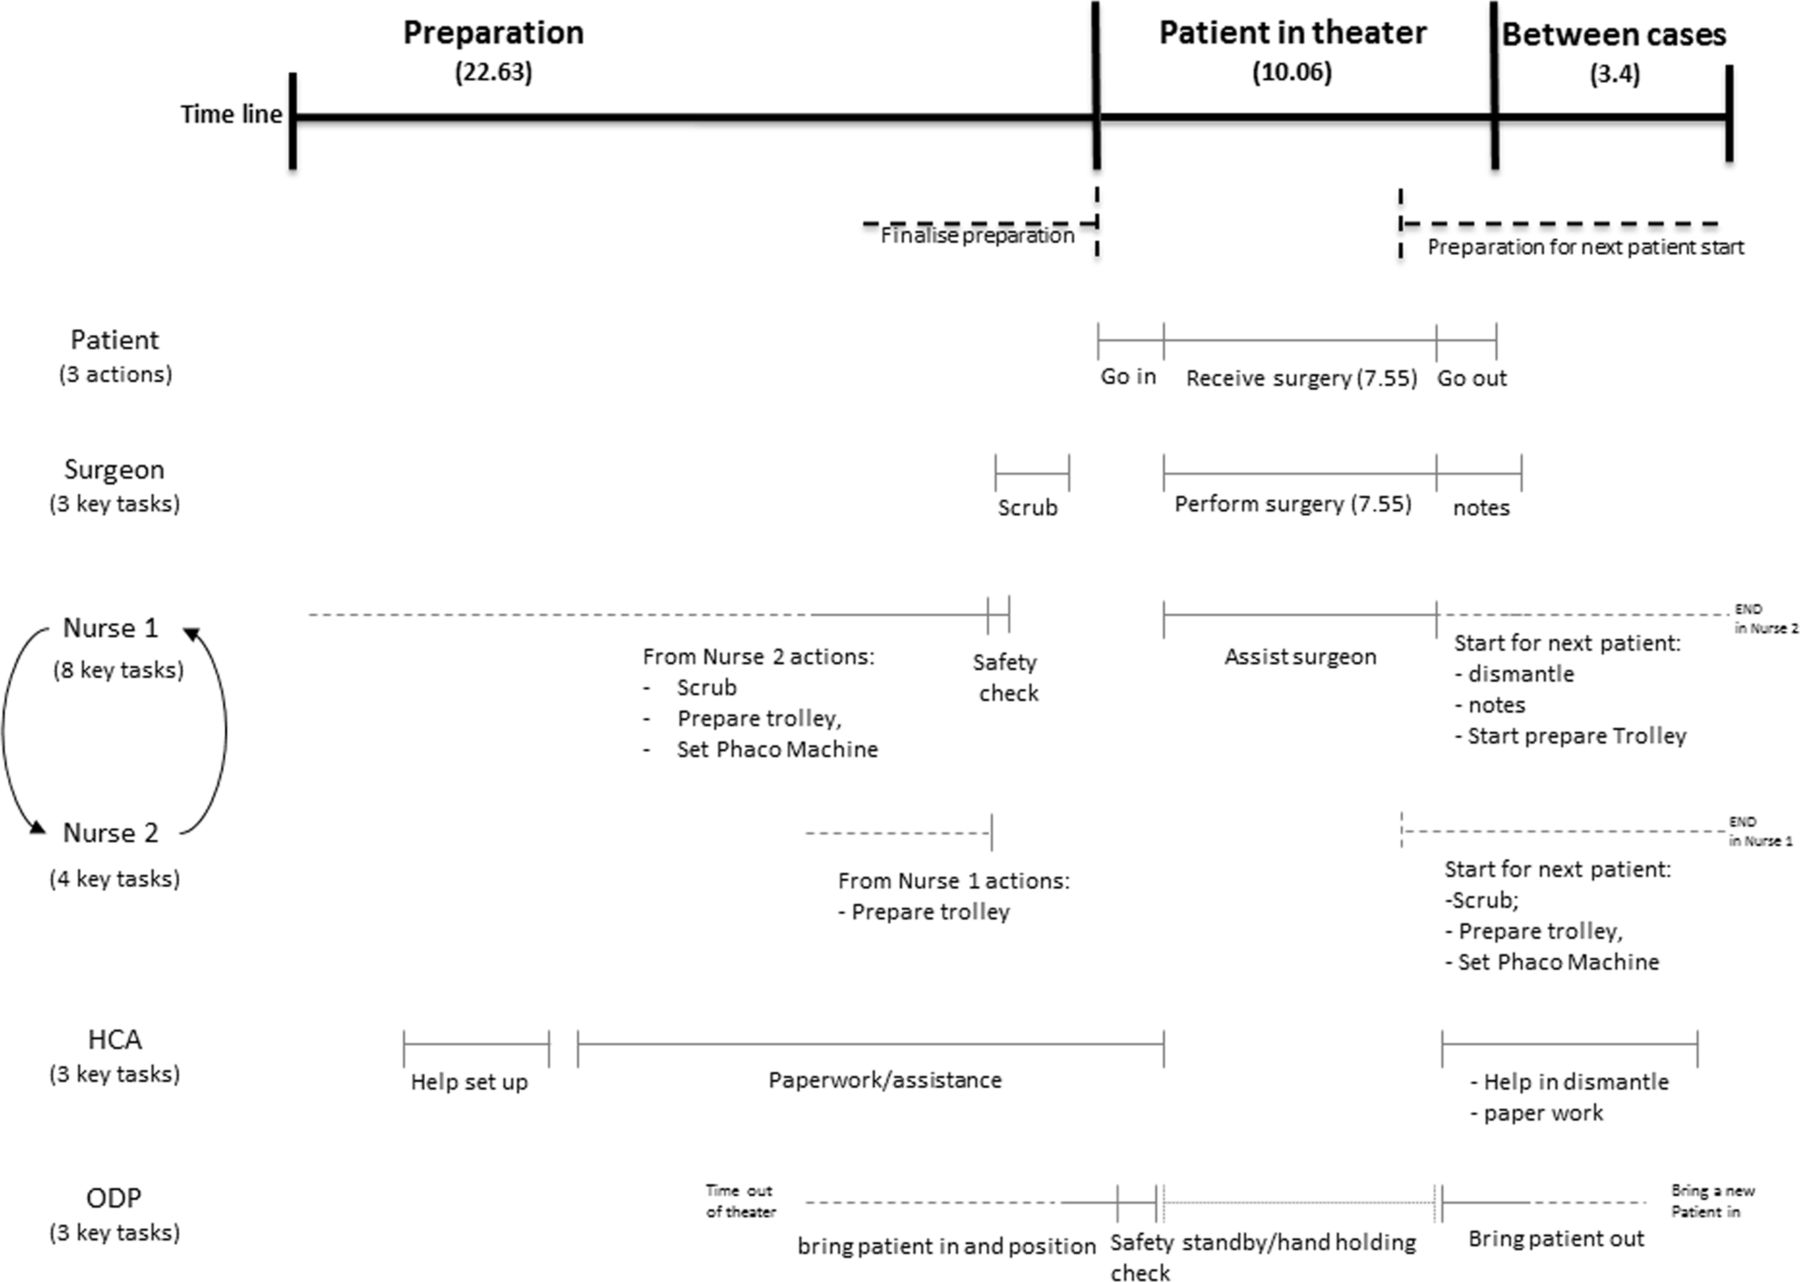
Timings from each theatre list can be seen in table 2 and figure 1. The reason and duration of any unscheduled delays can be seen in table 3. Mapping of the workflow of the two highest-volume theatre lists can be seen in figures 2 and 3.

Diagram of model summarising the results of the time motion studies.

Model of workflow of staff duties at institution 3C. HCA, healthcare assistant; ODP, operating department practitioner.
Model of workflow of staff duties at institution 5. HCA, healthcare assistant; ODP, operating department practitioner.
The reason and duration, in minutes, of any unscheduled delays
The median number of operations per 4-hour theatre session was 7 (range 5–14). The mean time to perform a cataract operation was 10.3 min (SD 4.11 min). The mean time to complete one case including patient turnaround was 19.97 min (SD 8.77 min). The mean surgical scrub time was 1.86 min (SD 0.77 min). The mean time to complete preprocedure WHO checklist was 0.55 min (SD 0.52 min). The mean time to complete postprocedure paper/computer work was 1.77 min (SD 1.35 min). The mean time for patients to enter theatre to being positioned for surgery was 2.28 min (SD 1.88 min). The mean time from patient entry to start of operating was 4.56 min (SD 1.49 min). The mean time for patient to exit theatre from removal of lid speculum was 1.90 min (SD 1.00 min). The mean duration of patients’ time in theatre was 17.07 min (SD 7.30 min). The mean time in between cases was 4.12 min (SD 2.78 min). The correlations of the surgical time to patient time in theatre was R2=0.95. The correlation between surgical time and number of cases scheduled was R2=0.696.
The minimum number of AHPs (nurses/healthcare assistants/operating department practitioners) allocated to a theatre list in this study was 3. The majority of AHPs in this study were registered nurses. The two theatre lists with the greatest number of cases scheduled had either 4 or 7 AHPs (table 4). There was a moderate correlation between number of AHP and number of cases scheduled (R2=0.489). If only the public healthcare settings were included (institutions 1, 2, 3A–C and 4) and we excluded the one private institution under taking NHS operations (institution 5), where practices may differ from the NHS, the correlation between number of AHP and number of cases scheduled was much higher (R2=0.823). However, if we excluded the institution with the highest number of AHP per case (3C) from the analysis, the correlation became insignificant (R2=0.13).
Staffing levels associated with number of cases scheduled
Multiple linear regression models
A multiple linear regression model was calculated to predict the time to perform one operation based on three factors: (1) the number of AHPs, (2) the number of key tasks performed by AHPs and (3) time taken to perform these key tasks by AHPs. A significant regression was found (F(3,111)=32.86, P<0.001) with an R2 of 0.47. All the three factors were significant predictors of the time to perform a surgery. In particular, the surgical time decreases by 0.95 min for each additional AHP involved, by 0.39 min for every additional task performed by AHP and by 0.19 min for each additional minute spent by AHP performing tasks.
A one-way ANOVA way was performed to control for the effect on surgical time by: (1) the number of AHPs, (2) the number of key tasks performed by AHPs and (3) time taken to perform these key tasks by AHPs. There was a significant effect (P<0.001) of all the factors as follows: (1) F(1,113)=35.12, P=0.001), (2) F(1,113)=53.43, P=0.001) and (3) F(1,113)=42.23, P=0.001) (figure 4).

The significant relationships identified by analysis of variance. The average time to perform the surgery was equal to 10.25. The average time to perform the case was equal to 14.08. (A) The relationship between the time to perform the surgery and number of allied healthcare professionals (AHPs). (B) The relationship between the time to perform the surgery and number of tasks performed by AHPs. (C) The relationship between the time to perform the surgery and the time spent by AHPs to perform their tasks. (D) The relationship between the time to perform the case and number of AHPs. (E) The relationship between the time to perform the case and the time spent by AHPs to perform their tasks.
A similar multiple linear regression model was calculated to predict the effect of the same three factors: (1) the number of AHPs, (2) the number of key tasks performed by AHPs and (3) time taken to perform these key tasks by AHPs on the total patient time in theatre. Factors (2) and (3) were significant predictors of the time an individual patient spent in theatre, that is, the total time to complete one surgical case. The model was significant (F(2,116)=43.18, P<0.001) with an R2 of 0.43. The length of patient time in theatre decreased by 0.76 min for each task performed by AHPs and by 0.19 min for each minute spent by AHPs to perform their tasks.
A one-way ANOVA was performed to control the effect on the total patient time in theatre by: (1) the number of AHPs, (2) the number of key tasks performed by AHPs and (3) time taken to perform these key tasks by AHPs. There were significant effects of factors 2 and 3 (F(1,117)=43.97, P<0.001) (figure 4).
Discussion
This study adopted a TMS approach to evaluate the efficiency of public sector cataract surgery in the UK. We observed a significant variance in the running of cataract theatre lists at five different UK institutions, the most striking of which is the number of patients scheduled per list, which ranged from medians of 6–13.5. From the perspective of the public healthcare sector, it is imperative to maximise the efficiency of elective surgery while maintaining quality and safety.6 The average duration of a cataract operation was 10.3 min and the total time including preprocedure and postprocedure preparation and patient turnaround was 19.97 min. It could be expected, therefore, that at least 12 operations could be completed in a 4-hour session and yet the median number of cases booked to a theatre list of 7 is much less. On the basis of the results of this TMS, one could expect that an increase in 70% efficiency might be possible. Whether this is an achievable target and why it is not currently being realised is a matter of conjecture, but certainly it highlights the great need to identify possible factors necessary to improve the efficiency of NHS cataract surgery.
It was interesting to document that the sessions (institutions 3C and 5) providing the highest median number of cases per list (13, 13.5) and highest theatre utilisation and efficiency quotients, had the longest duration of staff breaks, suggesting that these units have discovered how to ‘work smarter, not harder’ (table 2, figures 1–3). This strongly suggests that by changing working practices efficiency can be improved without increasing individual staff workload.
This assumption is supported by the observation that institutions 4 and 5 share the same population, yet there are noticeable differences between the TMS of their theatre sessions, especially in terms of median number of cases per list (7 vs 13), theatre utilisation quotient (50.8% vs 87.9%) and efficiency quotient (65.6% vs 75.8%) (table 2). As patient demographics should be similar at these two settings, differences in practice and efficiency presumably arise from internal organisation of the cataract theatre lists rather than external factors.
In considering the TMS of the surgeons, it is important to recognise that the theatre session is not an independent entity. Rather, differences in theatre practices often stemmed from factors outside the theatre itself, such as in the day case ward/clinic. For example, at institutions 1 and 4, the surgeons performed slit-lamp examination and marked all patients on the day of surgery, at institution 2 the surgeon met the patients and marked them, at 3A/B/C the surgeon met the patient, marked and consented them, while at 5 (which had the highest theatre utilisation quotient and second highest median number of cases at 13) all such tasks were performed by staff on the day-case unit. This suggests that using AHPs to undertake some of the duties of the surgeon outside theatre, might be an important factor in improving efficiency by ensuring that the surgeon spends as much in theatre as possible during each allocated 4-hour cataract surgery session. This is supported by the observation that institution 1 (with a joint lowest median number of cases of 6 and an efficiency quotient of only 66%) was the only unit in which there was staggered patient arrival and surgeon performing preoperative examination, leading to a time relating to these duties of 26.57 min out of theatre during the 4-hour sessions (tables 2 and 3). Similarly, at institution 2 (joint lowest median number of cases of 6 and efficient quotient of 65.2%), the surgeons spent 48.75 min outside the operating theatre due to outpatient clinic over-run and the need to see patients on the day case ward (figure 1, tables 2 and 3). Clearly to achieve optimum efficiency it is imperative for the surgeon to be available within theatre to undertake the surgery rather than performing duties outside. Whether this best achieved by AHPs performing such outside duties instead of the surgeon as at institution 5, or ring fenced time before the theatre session itself is a matter of conjecture.
Some units allowed patients to arrive on a staggered basis for their convenience and reduced overall patient waiting time (institutions 1, 3A/B/C, 5), while the remainder requested that all patients were present for the pretheatre ward round. As such practices did not affect the overall median number of cases or efficiency quotients (table 2), it seems a reasonable approach to stagger arrival times for patient convenience, provided protocols are introduced to avoid surgeons spending time out of theatre, as at institution 5.
Based on our observation, a minimum of four AHPs appear to be required to provide a high-volume service. This criterion was met at all settings other than institutions 1 and 4 (table 4). Increasing the number of cases towards the goal of high-volume lists may require either/both an increase in the number of AHPs supporting the surgeon with additional tasks (as in setting 3C) or changes in working practice (as in setting 5), with four AHPs performing more supporting tasks. It is our experience that in addition to the scrub nurse and circulating AHP, at least two AHPs are required to be able to clear up from the previous case and, more importantly, prepare for the subsequent case so there is only a minimal wait between cases. This is achieved at institutions 3C and 5 (this lists with the highest volumes of patients treated per session) with 18.92 and 22.63 min of AHP preparation time, respectively, before the patient even enters theatre (figures 2 and 3). Ideally, the gap between cases needs to be minimised to the time it takes to escort the patient out and in, perform WHO checklist, and for the surgeon to rescrub. In this series, the length of time from the end of one case to the start of the next ranged from 5.92 to 16.8 min.
Between the institutions the average surgical time varied from 7.43 to 15.98 min. This variation may reflect different case mix or differences between surgeons with some being faster/more experienced than others. The surgeons in lists 3C and 5 have a national reputation of excellence and are known for their expertise and surgical skills and this may have created outlying results. However, despite this the correlation between AHP numbers and tasks was strong and means that efficiency can be improved for those that do not have exceptional surgical skills. The correlation between surgical time and number of cases scheduled was R2=0.696, suggesting that factors such as surgical experience and case mix are likely to have a part to play in cataract surgery efficiency. However, we found significant correlation between the time undertaken to perform cataract surgery and the number of AHPs, the number of key tasks performed by AHPs and the time taken to perform these key tasks by AHPs (P<0.001). This was confirmed by one-way ANOVA testing, suggesting that alteration of the number of AHPs supporting a cataract surgery list and surgeon, their duties and their total time performing tasks, is strongly associated with and can indeed influence the time to perform individual cataract surgery (figure 4). Similarly, a strong correlation, confirmed by one-way ANOVA- testing, was found between the number of key tasks performed by AHPs and the time taken to perform these key tasks by AHPs on the total patient time in theatre (P<0.001). Such correlations appear to highlight the importance of AHPs and their designated tasks in the development of high-volume NHS cataract surgery.
Concerning institution 5, which appeared to be an outlier in terms of correlation of number of AHPs with efficiency, these results might be explained by the fact that this was a private institution with different working practices from public health sector settings and there were direct financial incentives for the numbers of patients treated which it could be assumed positively influence productivity. Most importantly, while the number of AHPs supporting the cataract theatre list at institution 5 was 4, the number of key tasks performed by AHPs per case was much higher at 18 than any other organisation (table 2). At site 5, it clearly appeared that AHPs were undertaking many of the tasks performed by the surgeons at other institutions, which ensured that the surgeon was spending far more time in theatre undertaking surgery than at any other institution. As such, this unit could optimise surgical productivity and theatre utilisation. Indeed the results at institution 5 strongly support our correlations concerning the importance of AHPs, their roles and tasks they undertake, in optimising cataract surgical list efficiency. It appears that expansion of the role of AHPs in the public sector health setting to incorporate some the non-surgical roles currently undertaken by the surgeon, as well as the maintenance of adequate AHP staffing levels is vital to optimise cataract surgery efficiency.
There was generally an under utilisation of the full 4-hour (240 min) theatre session. Average theatre utilisation was 70.11% (range 50.8%–87.9%) and was 73.9% (range 59.3%–87.9%) when extrapolated to take into account the cancelled operations. The reasons for delayed start of theatre sessions included the surgeon being delayed by an overbooked clinic or administrative duties on the day case ward (table 3). Preoperative examination of surgical patients and associated duties (patient marking, confirmation of consent, etc) is an integral part of the surgical process, but duration should be minimised to maximise potential surgical time. However, in the interests of patient safety, it is not suggested that the target for theatre utilisation should be 100% due to the possibility of a case taking longer than expected or the event of a surgical complication, although the risks of surgical complications in cataract surgery is generally low (<5%).5
This study does have a number of limitations. First, it focused on single independent consultant or associate specialist surgeon theatre sessions and not on training lists with junior doctors. Clearly, there is a need to balance the desire for high-volume services and the promotion of high-quality provision of training for the next generation of surgeons. However, if sufficient high volume can be achieved in single surgeon lists, then we believe this can reduce the pressure of service provision in lists with junior trainees. Indeed, given the increased future demand for cataract surgery within the NHS (as discussed above), there is a great need for senior trainees as future consultant surgeons to have exposure to high-volume models of cataract surgery.
Second observations were made based on a relatively small number of observed sessions (18). To our knowledge, this is the first TMS of its kind in cataract surgery. TMS are, by their nature, very labour intensive. Historically, TMS would often require one observer for each person studied which would, of course, introduce great difficulty (logistical and financial) in studying a cataract theatre session. However, we have found that through the use of Macros on Microsoft Excel, we were able to record timings for all staff involved with a theatre session with no more than two observers. This would be the first example of TMS of cataract theatre sessions published, which we feel is of great importance, especially in understanding differences in productivity within state-funded healthcare systems. Clearly, however, there is scope for future research incorporating greater numbers of operations at more institutions which may facilitate analysis of a greater number of factors and less risk of chance findings.
It is also of note that the five hospitals participating in this study incorporated a mixture of academic centres and district general hospitals, with both rural and urban populations. They were chosen carefully to reflect a broad spectrum of environments. However, this study does not claim to represent universal provision of cataract services across the UK. We did not evaluate every model of surgical provision, including patients having surgery under sedation or general anaesthetic (GA). However, the vast majority of cataract surgery performed with the UK is undertaken under topical/local anaesthesia1 5 and the aim of this study was to focus on the delivery of high-volume services, wherein GA cases are unlikely to feature. Furthermore, it was assumed that all theatre teams were experienced with cataract theatre lists and familiar with working with each other. Indeed during the course of the TMS nothing was observed to the contrary.
Finally, although the focus of this study was the efficiency of cataract surgery, the metrics of the quality of the surgery, such postoperative visual acuity, postoperative complications, postoperative refraction and patient satisfaction were not evaluated. It is important to remember that the quality of any aspect of cataract surgery and overall patient satisfaction should never be compromised to enhance efficiency. To further investigate this, we are currently investigating patient satisfaction and patient-reported outcomes in high-volume cataract models.
Conclusion
This current TMS study highlights the huge variation in the efficiency of cataract surgery within the NHS. It suggests that, with provision of sufficient levels of AHP staffing and expansion of the roles of AHPs , productivity in cataract surgery and theatre utilisation could be significantly improved in the public sector.
Acknowledgments
BMI Southend Private Hospital, Norfolk and Norwich NHS Foundation Trust, Guy’s and St Thomas’ NHS Foundation Trust, Southend University Hospital NHS Foundation Trust and West Suffolk NHS Foundation Trust. Karen Bateman BSc IMM, Director, Tranoca Ltd. Ted Burton, Consultant Ophthalmic Surgeon, Norfolk and Norwich NHS Foundation Trust. Hosam Kasaby, Consultant Ophthalmic Surgeon, Southend University Hospital NHS Foundation Trust.
Footnotes
Contributors HWR and JM contributed to acquisition of data, analysis and interpretation of data. HWR, MN and SB contributed to analysis of data, and all authors contributed to drafting the article and revising it critically for important intellectual content.
Competing interests None declared.
Provenance and peer review Not commissioned; externally peer reviewed.