Article Text

Abstract
Purpose Amblyopia is a leading cause of vision impairment among children and young adults. Individual studies showed significant variations in the prevalence of amblyopia in different regions and age groups. This study is to estimate the global prevalence of amblyopia by pooling its prevalence from the previous studies and to project the number of people affected through 2040.
Methods We performed a systematic review and meta-analysis on the prevalence of amblyopia using data published before 20 October 2018. We estimated the prevalence rate of amblyopia and its 95% CI globally and by subgroups (eg, region and age). The prevalence data were applied to United Nations World Population Prospects to derive the projected number with amblyopia through 2040.
Results A meta-analysis of 60 studies (1 859 327 subjects) showed that the pooled prevalence rate of amblyopia was 1.44% (95% CI 1.17% to 1.78%). Prevalences in Europe (2.90%) and North America (2.41%) were higher than in Asia (1.09%) and Africa (0.72%). The highest prevalence was found in subjects over 20 years old (3.29%). There was no difference in the prevalence between genders. We estimated 99.2 (95% CI 71.7 to 146.1) million people with amblyopia in 2019 worldwide, increasing to 175.2 (95% CI 81.3 to 307.8) million by 2030 and 221.9 (95% CI 83.7 to 429.2) million by 2040.
Conclusions The amblyopia is becoming a significant vision problem worldwide. It is of great importance to design and implement amblyopia screening, treatment and related public health strategies.
- Child health (paediatrics)
- Epidemiology
- Public health
Statistics from Altmetric.com
Introduction
Amblyopia is a common vision disorder among children and young adults. Visual impairment from amblyopia is lifelong and can be profound if not treated at the appropriate time.1–3 Understanding the prevalence, burden and population impact is important for adequate healthcare planning and prioritisation, which requires an accurate estimate of current amblyopia prevalence and projection of future burden of amblyopia.
While a substantial body of data is available on the epidemiology of amblyopia, it is highly fragmented and reported prevalence rate varies considerably by region and age. This variability presents a challenge in deriving regional burden estimates, as it is unclear the extent to which differences in prevalence estimates are real or are being influenced by demographic, methodological or other factors. To date, a few data are summarising the global trend of the prevalence to guide global strategies.
Here, we performed a systematic review of the literature to estimate the global prevalence of amblyopia, and to assess the differences in prevalence by region, age and ethnicity. In addition, we projected the number of individuals with amblyopia worldwide over the next few decades.
Methods
The review followed the Meta-analysis of Observational Studies in Epidemiology guidelines for the conduct of systematic reviews and meta-analyses of observational studies.4
Literature search
The PubMed, Web of Science and Embase were searched for relevant papers published from 1950 to 20 October 2018. The search strategy consisted of a combination of keywords relating to amblyopia and prevalence (see online supplementary file 1 for search strategy). The initial literature search was completed by two reviewers (ZF and ZS) independently. Disagreements between the two were resolved and adjudicated by the senior author (HH).
Supplemental material
Inclusion and exclusion criteria
Studies were included in the meta-analysis if they: (1) were population-based or school-based study of amblyopia from a defined geographic area; (2) reported a clearly defined method of sampling procedure;(3) reported the age distribution of study population; (4) reported a response rate of 50% or higher of the eligible population participants; (5) had a standardised assessment of amblyopia; (6) specified a clear definition of amblyopia and (7) were published in English.
We excluded studies if they: (1) consisted of volunteer participants or participants with self-reported amblyopia; (2) the definition of amblyopia did not fall under most paediatric ophthalmologists’ consensus. If prevalence data were reported in multiple papers for a specific study, the paper with the most comprehensive data was selected for inclusion.
Amblyopia definitions
There were considerable variations in the definition of amblyopia. We only included studies that used best-corrected visual acuity (BCVA) for defining amblyopia. Studies made amblyopia diagnosis according to fixation or preferential looking for preverbal children were excluded because their amblyopia definitions were unclear or subjective, which made it difficult to compare amblyopia prevalence across different studies.5–9 In the recent years, several studies adopted the amblyopia definition used in the Multi-ethnic Pediatric Eye Disease Study (MEPEDS), in which unilateral amblyopia was defined as a ≥2 line interocular difference in BCVA with ≤20/32 in the worse eye and presence of a unilateral amblyopia risk factor while bilateral amblyopia was defined as bilaterally subnormal BCVA (<20/50 in 30–47 months or <20/40 in ≥48 months) in the presence of bilateral isoametropia or with evidence of visual axis obstruction of both eyes.10 11 In general, definitions of amblyopia used in the eligible studies can be broadly summarised into following categories: (1) BCVA ≤20/30, (2) BCVA ≤20/30 or ≥2 line difference, (3) BCVA≤20/40, (4) BCVA ≤20/40 and ≥2 line difference, (5) BCVA ≤20/40 or ≥2 line difference, (6) BCVA ≥2 line difference and (7) MEPEDS criteria.
Data extraction
The following data were extracted from each eligible study: region, age range, year of publication, response rate, sample size, number of amblyopia cases overall and, if available, according to gender, ethnicity and disease causes. Age was divided into age groups at 5-year interval. The age group of each study was determined by mean or median age of study participants. We classified regions according to the classification of United Nations Population Division, namely, Asia, Africa, Europe, North America, Oceania, and Latin America and the Caribbean.
Risk of bias assessment
The methodological quality of each included study was assessed by two authors (ZF and ZS) using the modified Leboeuf-Yde and Lauritsen tool,12 which consists of 10 items addressing two study dimensions (external validity and internal validity) plus a summary risk of bias assessment.13
Statistical analysis
The proportion of individuals with amblyopia in each study was combined to give a pooled prevalence of amblyopia from all eligible studies using the random-effects model. Heterogeneity between studies was assessed using Cochran‘s Q test and I2 statistics. P<0.10 or I2 value >50% was considered a significant degree of heterogeneity.14 Evidence of publication bias was assessed by applying Egger’s test. Subgroup meta-analyses were conducted according to geographical region, ethnicity, income level, disease definition, age group, gender and publication year. Meta-regressions were used to evaluate the impact of predefined factors on the prevalence of amblyopia. All these meta-analyses were performed using R (V.3.6.1, R Development Core Team, 2019).
Projection estimates
A hierarchical linear model was established to project the number of amblyopia. Model u
ijk=β
0+β
1
AGE
Lijk+β
2
AGE
Uijk+β
3
Income
ijk+β4Year
i+Region
j+Definition
k+ε
ijk was used to estimate the prevalence using kth
definition at jth
region in ith
year.  AGELL and AGELU
 are the lower and upper bounds of the age group range for participants of each study.
  stands for income level, which was divided into three levels. Level low was assigned to 1, level middle was assigned to 2, level high was assigned to 3.
  Region and Definition are fixed effects. ijk
  are fixed effects.
  stands for system error. The World Population Prospects of the United Nations (UN) consist of the latest results of national population consensus and demographic surveys from countries worldwide and take into account mortality rate and fertility rate in its projection of world population number (https://population.un.org/wpp/). The global and region-specific total number of individuals with amblyopia in several future time nodes was calculated by multiplying the age-specific and region-specific estimated prevalence rates to the corresponding UN World Population Prospects data.
Results
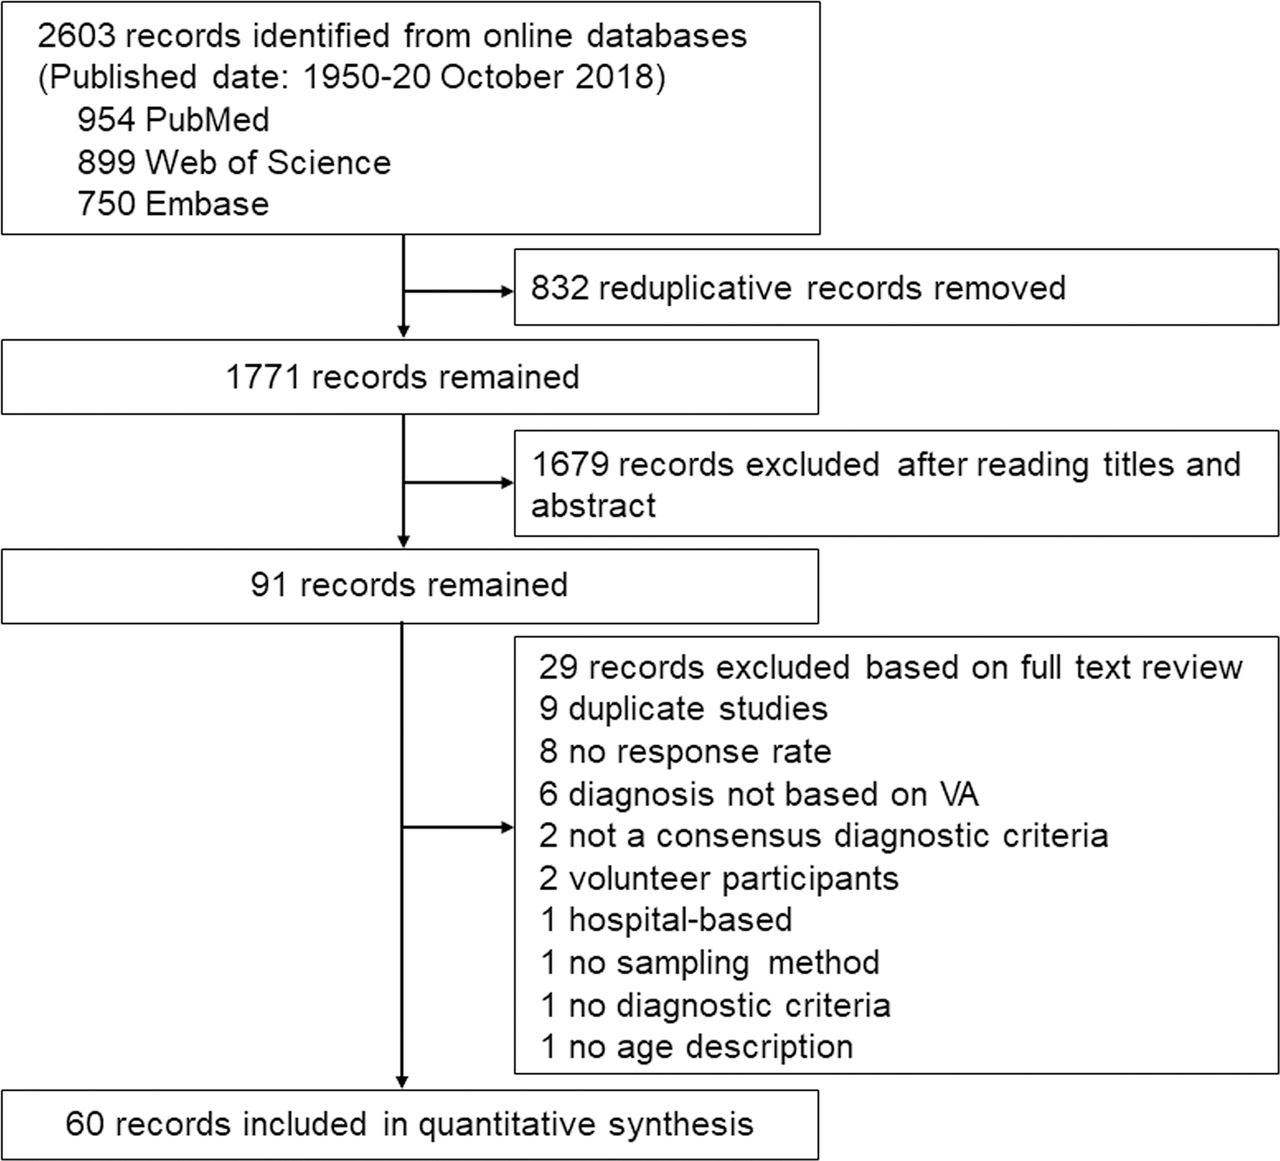
The search strategy identified 2603 papers and 91 papers were relevant to our study question. There were 60 papers that fulfilled the eligibility criteria, representing 60 separate study populations (figure 1). Of the 60 studies assessed for methodological quality, 52 (86.67%) studies scored ≥7 and eight studies scored 5 or 6.

Summary of article selection process. VA, visual acuity.
Global prevalence of amblyopia
The included 60 studies involved 16 385 amblyopia cases among a total of 1 859 327 examined individuals. A summary of 60 studies is given in online supplementary file 2. In brief, 33 studies were from Asia,15–47 11 were from Europe,48–58 5 were from Oceania,59–63 5 were from North America,10 11 64–66 4 were from Africa67–70 and 2 were from Latin America and the Caribbean.71 72 The overall global prevalence of amblyopia was 1.44% (95% CI 1.17% to 1.78%, I2=98.95, p<0.001). Figure 2 shows the prevalence estimate for included studies by world region. There is considerable heterogeneity between studies within each geographical region (in all cases, p<0.001). The I2 statistics were greater than 90% for all geographical region groups. Geographically, amblyopia was more prevalent in Europe (2.90%, 95% CI 2.20% to 3.83%) and North America (2.41%, 95% CI 1.18% to 4.88%) than in Asia (1.09%, 95% CI 0.89% to 1.33%) and Africa (0.72%, 95% CI 0.26% to 1.98%).
Supplemental material

Overall and region-specified pooled prevalence of amblyopia.

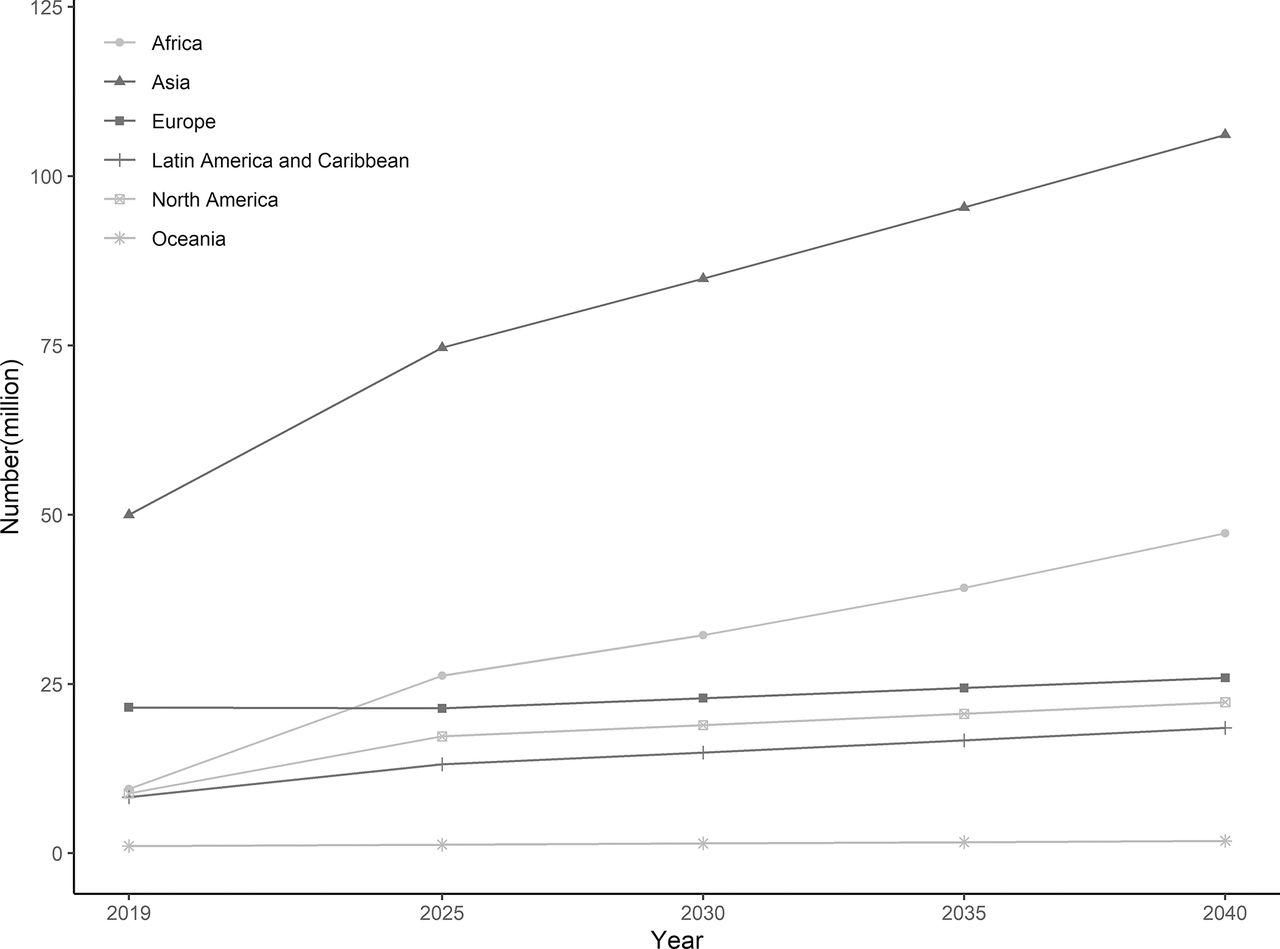
Projection of number of people (in million) with amblyopia from 2019 to 2040 by regions.
We assessed the prevalence of amblyopia among four major ethnic groups, namely, European ancestry populations (Europeans), African ancestry populations (Africans), Asians and Hispanics. A total of 15 studies described the ethnicity and disease prevalence of the study population. Across ethnicity, Hispanics had the highest prevalence of amblyopia (4.74%, 95% CI 0.26% to 14.28%), followed by Europeans (2.48%, 95% CI 1.61% to 3.80%), Africans (1.99%, 95% CI 0.59% to 6.47%) and Asians (1.38%, 95% CI 0.75% to 2.52%).
To analyse the relationship between the prevalence of amblyopia and economic condition, we divided countries into three income levels according to the gross national income per capita 2017 released by World Bank (https://data.worldbank.org/). The prevalence of amblyopia was highest in high-income countries (2.07%, 95% CI 1.37% to 3.12%) and lowest in low-income countries (0.37%, 95% CI 0.27% to 0.52%) (table 1).
Pooled prevalence of amblyopia according to diagnostic criteria, age group, publication year and income level
Thirty-seven of the 60 studies provided information on the causes of amblyopia. Although the classification of causes varies across studies, causes were divided into three categories including refractive, strabismic and visual deprivation amblyopia. When data from these studies were pooled, the prevalence of amblyopia by each of three causes were 0.97% (95% CI 0.79% to 1.19%), 0.40% (95% CI 0.30% to 0.53%) and 0.06% (95% CI 0.04% to 0.09%), respectively. The cause-specific prevalence and proportion of various causes in different regions is shown in table 2.
Pooled prevalence of cause-specific amblyopia and proportion* of amblyopia causes by geographical region
Prevalence of amblyopia according to disease definition
The pooled prevalence of amblyopia according to various definition for amblyopia is provided in table 1. Prevalence was highest when a BCVA ≥2 line difference criteria was used (2.99%, 95% CI 1.89% to 4.68%) and lowest when the BCVA ≤20/40 criteria were used (0.76%, 95% CI 0.51% to 1.14%). The variation in prevalence according to country persisted even when the same diagnostic criteria were used (p<0.001 and I2 >50% in each subgroup), suggesting that the geographical variation was not related solely to the diagnostic criteria used in each study.
Prevalence of amblyopia by age groups and publication years
Age was divided into groups at 5-year interval to estimate age-specific prevalence rate (table 1). There were only seven studies reported mean age of study population over 20, ranging from 29.5 to 59 years old, therefore, these seven studies were grouped into one group (>20 years). The highest prevalence rate was found in the group with age over 20 years (3.29%, 95% CI 2.52% to 4.29%). Before the age of 20, the prevalence of amblyopia decreased with age. Prevalence estimates in studies published before 2010 (1.24%, 95% CI 0.91% to 1.69%) were lower than in studies published after 2010 (1.68%, 95% CI 1.30% to 2.16%).
Prevalence of amblyopia by gender
Published estimates by gender were available for 23 studies with 182 354 participants and 1637 cases of amblyopia, including two studies in males exclusively and a study from Nigeria reporting all amblyopia cases were male.23 47 69 Overall, the pooled prevalence of amblyopia was slightly higher in female compared with male (1.84% (95% CI 1.38% to 2.45%) vs 1.52% (95% CI 0.95% to 2.43%)), but not statistically significant with OR 1.08 (95% CI 0.96 to 1.22) for amblyopia in female compared with male, with low heterogeneity between studies (I2 <0.001, p=0.18) and no evidence of funnel plot asymmetry (Egger’s test, p=0.35).
Meta-regression
The I2 statistics were greater than 90% for all subgroups, showing that most heterogeneity was the result of variability between the studies rather than of chance variability. Six categorical covariates were examined as sources of potential heterogeneity. In the univariate meta-regression analyses, publication year (before or after year 2010) and methodological quality (less or more than 7) were not significantly associated with the amblyopia prevalence (p=0.21; 0.33, respectively). However, when meta-regression of publication year was performed only in Asian studies, the result showed that publication year was associated with amblyopia prevalence in this region (p=0.01). Univariate meta-regression found that amblyopia prevalence was significantly associated with geographical region (Europe or the rest of the world), income level (high or other), disease definition (2-line difference or other) and age group (younger or older than 20 years) (all p<0.01). A subsequent multivariate mixed-effects meta-regression model found that region, definition and age were independently associated with amblyopia prevalence (p<0.05, online supplementary file 3). We did not concurrently include region and income in the same model because they were strongly correlated.
Supplemental material
Number of people with amblyopia worldwide from 2019 to 2040
The projected number of people with amblyopia by region from 2019 to 2040 is shown in figure 3 and online supplementary files 3 and 4. In 2019, the total number of people with amblyopia was estimated to be 99.2 million. Asia alone accounted for approximately 50% of the world’s total amblyopia cases, and Europe had the second highest number of amblyopia cases with 21.6 million (22%). We estimated that the number of people with amblyopia worldwide will increase to 175.2 million in 2030 and 221.9 million in 2040. Asia will still contain the greatest number of people with amblyopia in the next two decades and contribute much of the increase of amblyopia cases worldwide, with 84.9 million amblyopia in 2030 and 106.1 million in 2040. Africa will see the highest growth rate (397%, 47.2 million in 2040) of people with amblyopia while Europe will have the lowest growth rate (20%, 25.9 million in 2040).
Supplemental material
Discussion
This review has assembled data from all studies throughout the world that reported the prevalence of amblyopia. Our analysis provides comprehensive estimations on the current worldwide amblyopia prevalence and future projections on the number of people with amblyopia. A previous review reported a pooled prevalence of 1.75% from 73 studies,73 which was a little higher than our estimate prevalence. However, we avoided some errors by eliminating duplicate studies and limited to population-based or school-based studies. For example, an analysis of data from the Vision in Preschoolers study was excluded by us because it provided a study population in which children with ocular disorders were over-represented.74 By adopting appropriate inclusion criteria, we minimised the bias of prevalence rate estimate and made the results more accurate. In addition, we estimated amblyopia prevalence rate across ethnic groups and various economic conditions of the region, which was not addressed in the previous review.
We found substantial evidence that amblyopia was more prevalent in Europe and North America than in Asia and Africa. This result is consistent with finding from previous meta-analysis.73 Consistent with previous population-based multiethnic studies,10 64 66 75 our meta-analysis found that amblyopia is more prevalent in Hispanics and people of European ancestry. In general, more Europe studies used less strict amblyopia definitions than other regions (eg, BCVA ≥2 line difference, BCVA ≤20/40 or ≥2 line difference), however, results of multivariate regression analyses showed the regional differences persisted even after accounting for the differences in amblyopia definition. The high prevalence in Europe may be explained in part by the improved detection methods for amblyopia in the region. This is confirmed by our finding that prevalence is higher in high-income regions than in low-income regions. Amblyopia screening in Europe dates back to 1950s and has formed more systematic screening programme. In addition, European countries conducted more prospective studies, in which subjects with vision disorders were more likely to complete the follow-up than subjects without vision disorders.48 54 56 57 Furthermore, genetic susceptibility is a possible reason, because some studies have confirmed the existence of genetic factors in refractive error and strabismus, which were the main causes of amblyopia.76 77 Consistent with our study finding, a previous review reported that the prevalence of hyperopia and astigmatism in people under 20 years is lower in Asia, the western Pacific, and Africa than in North America and Europe.73 A previous review suggested a hypothesis that general loss of pigmentation in out-of-Africa populations is related to amblyopia.75 It is worth noting that the lack of data in Latin America and Africa in our study was due to the fact that few studies studied the prevalence of amblyopia in these regions, not because their studies did not meet the inclusion criteria, so more research is needed in these regions.
Globally, refractive amblyopia was most frequent, with pooled prevalence much higher than strabismic and visual deprivation amblyopia. Among the three main causes of amblyopia, refractive error is the most treatable. In other words, most amblyopia can be cured or partially improved by refractive correction. Among the various regions, Asia had the highest proportion of refractive amblyopia, while Europe had the highest proportion of strabismus amblyopia and Africa had the highest proportion of form deprivation amblyopia (table 2). This difference may be due to the disparities of prevalence of amblyogenic factors across regions. This is reminiscent of the prevalence of ametropia, especially the high prevalence of myopia in Asia.78 79 However, it is of particular interest that refractive amblyopia is mostly caused by anisometropia and hyperopia rather than myopia, so different distribution of causes between Asia and Europe may likely be attributed to the higher prevalence of strabismus in Europe. The screening and treatment of ametropia, strabismus and visual axis obscuring are the main points in the prevention and treatment of amblyopia in Asia, Europe and Africa, respectively.
In terms of age group, prevalence was highest among people over the age of 20 years. A possible reason for this may be that, with the increased public awareness of amblyopia, screening programme in children become more widespread. Consequently, younger population receives better screening and timely treatment, while older population misses the best opportunities for treatment, which leads to the accumulation of patients in this age group. In addition, examination is more difficult in younger children, thus may miss the diagnose of amblyopia. However, there is limited data on the prevalence of amblyopia in the elderly population, thus making our estimate of amblyopia in this older age group less reliable. Before the age of 20, there is a trend towards a gradual decrease in the prevalence. This is consistent with the pathogenesis of amblyopia, which does not expect to develop after childhood, and disease prevalence gradually decreases with treatment.
Inclusion of studies published in the 1990s through to the last decade allows us to evaluate the time trends in amblyopia prevalence over 29 years. We found that the amblyopia prevalence rates in recent studies are higher than earlier studies. Though no association was found between year and prevalence in univariable meta-regression analysis, there is interaction between year and region for the amblyopia prevalence. It may be due to the increased detection in less developed areas as well as improved disease prevention and treatment in developed areas. Most of the studies in the last decade were in less developed areas, which may explain the difference in the prevalence rate between the two decades.
Global growth of amblyopia in the next 20 years will mainly come from Asia. Asia is the most populous continent, accounting for more than 50% of the world population, hence will see the largest projected number of cases by 2040. Although the estimated prevalence of amblyopia in Asia currently is lower than in some other regions, the huge population base leads to large absolute number of amblyopia cases. Africa, being the second most populous region, follows after Asia in the number of projected cases, with a dramatic increase over the years. This projected large increase in the number of amblyopia cases in Asia and Africa suggest the need for developing of methods to identify and treat amblyopia in Asia and Africa. On the contrary, there will be only a mild increase in amblyopia cases in Europe despite the current highest prevalence. This is related to the persistently low fertility rate and population decline in Europe. Other continents will see a relatively moderate increase in amblyopia cases. The trends and differences across regions are largely affected by the demographic change in the population structure of the regions based on UN population projection data. These findings further support the need for improvements in health eye care services in Asia and Africa.
This study has several limitations. First, there was a paucity of population-based studies of amblyopia prevalence in Africa and Latin America, limiting our estimate of amblyopia prevalence in African and Latin American. Second, estimate of prevalence rate in adult population (>20 years old) may not be accurate due to the small number of studies in this adult population. Third, like other projections, our projection can be biassed to some degree because it is difficult to quantify prevalence trends accurately as it depends on lots of factors such as the performance of screening programmes, which were not available in areas all the regions. However, we included income level in the projection model, which can be regarded as an alternative indicator of the performance of screening programme because it is generally assumed that screening programme is better in developed areas than in less developed areas.
In conclusion, our systematic review provides contemporary estimates for the current and future burden of amblyopia globally. It is of great importance to design and implement amblyopia screening, treatment, and related public health strategies.
Acknowledgments
We thank Shaowen Tang, who provided guidance in using the MOOSE guidelines for the meta-analysis and supervised the data presentation for the systematic review.
References
Footnotes
Contributors HL and C-WP contributed substantially to the conception and design of this paper. ZF, HH and ZS conducted the literature searches and extracted the data from published papers. ZF and BL drafted the paper and carried out statistical analysis.
Funding This investigation was supported by the National Natural Science Foundation of China (grant no. 81673198, 81773449 and 81973061), the Natural Science Foundation of Jiangsu Province (grant no. BK20161595) and the Science and Technology Development Foundation of Nanjing Medical University (grant No. 2017NJMU053).
Competing interests None declared.
Patient consent for publication Not required.
Provenance and peer review Not commissioned; externally peer reviewed.
Data availability statement All data relevant to the study are included in the article or uploaded as online supplementary information.