Article Text

Abstract
Background/Aims To investigate the topographic relationship between macular superficial microvessel density (SMD) and macular ganglion cell-inner plexiform layer (GCIPL) thickness in eyes with glaucoma-suspect (GS) and early normal-tension glaucoma (NTG).
Methods A total of 86 eyes of 86 patients with early NTG (standard automated perimetry mean deviation >−5.5 decibels) and a total of 25 eyes of 25 patients with GS were retrospectively reviewed. All of the subjects underwent optical coherence tomography (OCT) and OCT angiography (OCTA) scan. On the OCTA scan images, macular SMD was analysed by customised software.
Results In GS and patients with early NTG, macular GCIPL thickness showed significant correlations with macular SMD in the superotemporal (ST), inferotemporal (IT) and inferoinferior (II) sectors (r =0.191, 0.373 and 0.346 for ST, IT and II sector, respectively). Additionally, circumpapillary retinal nerve fibre layer (RNFL) thickness and macular SMD showed significant correlations between the ST sector of the macula and the 1, 9 clock-hour peripapillary regions and between the IT and II sectors of the macula and the 6, 7, 8 clock-hour peripapillary regions. The IT sector macular SMD showed fair diagnostic power (area under the receiver operating characteristic curve [AUROC] = 0.758) and showed high diagnostic power when combined with IT sector macular GCIPL thickness (AUROC=0.954).
Conclusions Sectoral macular SMD showed topographic correlations with macular GCIPL thickness and circumpapillary RNFL thickness in patients with GS and early-stage NTG. Macular SMD analysis is potentially useful in the clinical evaluation of early glaucoma.
- glaucoma
- imaging
Statistics from Altmetric.com
Introduction
Glaucoma is a progressive degenerative optic neuropathy characterised by death of retinal ganglion cells (RGCs) and their axons, resulting in specific patterns of visual field defect. Classically, the optic nerve head and circumpapillary retinal nerve fibre layer (RNFL) have been the mainstays in the structural assessment of glaucoma.1–3 Recently, the importance of macula in the detection of glaucomatous RGC damage has emerged; indeed, the macular area contains more than 50% of RGCs within 4.5 mm of the foveal center.4 Many studies have reported that the glaucoma-diagnostic ability of macular parameters such as macular ganglion cell-inner plexiform layer (GCIPL) thickness is comparable to that of RNFL parameters,5–7 while others have demonstrated the possibility that macular parameter change can be detected earlier than that of RNFL parameters.8
After the introduction of optical coherence tomography angiography (OCTA), which can visualise retinal microcirculation status in a repeatable and reproducible manner,9 a number of studies have investigated the role of OCTA in the field of glaucoma.10–14 Several studies reported a spatial correlation between decreased vessel density and circumpapillary RNFL thinning.10 11 As far as we know, there is only one study that has shown a topographic correlation between macular vessel density and macular thickness profile (specifically between skeletonised superficial vessel density and GCIPL thickness in the inferior sector) in patients with primary open-angle glaucoma.15 However, there are as yet no reports exclusively on early-stage normal-tension glaucoma (NTG).
In this study, we investigated the spatial correlation between superficial vessel density measured by swept-source optical coherence tomography (SS-OCT)-based angiography and conventional spectral-domain OCT (SD-OCT) parameters including sectoral macular GCIPL thickness and circumpapillary RNFL thickness in glaucoma-suspect (GS) and patients with early-stage NTG.
Materials and methods
This study was approved by the SNUH Institutional Review Board and followed the tenets of the Declaration of Helsinki (1964). In view of the retrospective nature of the study, the Institutional Review Board waived the need for informed consent.
Subjects
A retrospective medical records review was conducted for patients who had visited Seoul National University Hospital Glaucoma Clinic between July 2017 and September 2018. All of the subjects underwent a full ophthalmic examination, including measurement of visual acuity, slit-lamp biomicroscopy, gonioscopy, measurement of intraocular pressure (IOP) by Goldmann applanation tonometry, measurement of refractive error with an autorefractor (KR-890; Topcon, Tokyo, Japan), measurement of corneal pachymetry (Pocket II Pachymeter Echo graph; Quantel Medical, Clermont-Ferrand, France) and dilated fundus examination. On maximal pupil dilation, all subjects underwent optic disc stereo photography and red-free fundus photography by digital fundus camera (VX-10; Kowa Company, Tokyo, Japan), SD-OCT scan (Cirrus HD-OCT; Carl Zeiss Meditec, Dublin, California, USA) and swept-source OCTA scan (DRI OCT Triton; Topcon, Tokyo, Japan). The subjects also underwent standard automated perimetry (SAP; Humphrey C24-2 SITA-Standard visual field; Carl Zeiss Meditec, Dublin, California, USA) within 6 months of OCTA scanning. Additionally, subjects’ self-reported presence of diabetes mellitus or systemic hypertension, information on medications used by them and any history of aorta surgery that could affect ocular perfusion were recorded.
The NTG was defined as glaucomatous optic neuropathy (enlarged cupping, neuroretinal rim thinning and RNFL defects), glaucomatous visual field defect, open iridocorneal angle and IOP≤21 mm Hg. The GS were defined as those that have glaucoma suspicious-looking optic disc (enlarged cupping, neuroretinal rim thinning, and RNFL defects) on dilated fundus examination without glaucomatous visual field defect. Glaucomatous visual field defect was defined as a cluster of ≥3 points with p<0.05 on a pattern deviation map in at least one hemifield, including ≥1 point with p<0.01; a pattern SD of p<0.05 or a glaucoma hemifield test result outside the normal limits. Only subjects with reliable visual field test results (fixation loss<20%, false-positive errors<15%, false-negative errors<15%) were included. If both eyes were eligible for the study, the eye with a higher MD of SAP was included and images from left eyes were horizontally flipped for consistent analysis with right eyes. We excluded subjects with (1) ocular conditions known to affect macular thickness or macular vessel density other than glaucoma (subjects with systemic hypertension or diabetes mellitus without retinopathy are not excluded), (2) high myopia (spherical equivalent<−6 dioptres), (3) intraocular pressure (IOP) >21 mm Hg, (4) no or unreliable SAP result within 6 months of OCTA scanning, (5) mean deviation (MD) of SAP <−5.5 dB, (6) unreliable OCT or OCTA scan, (7) a history of ocular trauma, (8) a history of ocular surgery excepting uncomplicated cataract or glaucoma surgery.
OCT and OCTA image acquisition
Macular GCIPL thickness was measured by SD-OCT according to the macular ganglion cell analysis (GCA) protocol. To explain briefly, 200 horizontal B-scans × 200 A-scans within a 6×6×2 mm cube centred on the fovea was performed for automatic identification of the outer boundaries of the RNFL and inner plexiform layer (IPL). A GCIPL thickness map was obtained within an annulus of 1.0 and 1.2 mm inner vertical and horizontal diameter and 4.0 and 4.8 outer vertical and horizontal diameter. The annulus was automatically divided into six sectors (SN, superonasal; SS, superosuperior; ST, superotemporal; IT, inferotemporal; II, inferoinferior; IN, inferonasal) in each of which the average GCIPL thickness was calculated.
The circumpapillary RNFL thickness was measured using the same SD-OCT device with the GCA protocol. Briefly, 200 horizontal B-scans × 200 A-scans within a 6×6×2 mm cube were performed, the built-in software automatically calculating the RNFL thickness of the peripapillary circle centred on the optic disc; 3.46 mm in diameter consisting 256 A-scans. Also, the circumpapillary RNFL thickness in all 12 clock-hour sectors was automatically generated and analysed.
The OCTA scans were obtained using the 1050 nm swept-source OCTA device within a 4.5×4.5 mm cube centred on the fovea. The built-in software (IMAGEnet6) was used to generate images for improved detection sensitivity of blood flow and reduced motion artefacts without compromise of axial resolution. Images with a quality score <60, poor clarity, motion artefacts (discontinuities of vessels), locally decreased image intensity due to media opacities (such as floaters) and segmentation errors were regarded as unreliable data, and as such, were excluded from the analysis.
OCTA image processing
The OCTA scan image of the superficial vascular plexus excepting the internal limiting membrane (ie, an en-face slab image from the inner border of the RNFL layer to 15.6 µm from the boundary between the IPL and the inner nuclear layer, obtained according to the manufacturer’s instructions) was exported in grayscale using the built-in software (figure 1A). Then, the images were imported into customised software (ImageJ; National Institutes of Health, Bethesda, Maryland, USA) for vessel density analysis. First, a non-local means (NLM) denoising filter and Hessian filter were applied to the grayscale images in order to reduce the background noise and sharpen the blood vessels. Second, we used an autothreshold algorithm to convert to a binary image and then the image was skeletonised for calculation of vessel density (figure 1B). To minimise the effect of the low-vessel- density areas around large vessels after skeletonisation, area occupied by large vessels was excluded from the analysis (figure 1C). The total vessel length per unit area calculated based on the skeletonised image was defined as ‘superficial microvessel density (SMD)’. The analysis was performed within (1) a 6-sector grid: an annulus of 1.0 and 4.0 mm inner and outer diameter divided by six sectors (figure 1C), (2) a 4-sector grid: an annulus of 1.0 and 3.0 mm inner and outer diameter divided by four sectors, which is the same as the grid used in the Early Treatment Diabetic Retinopathy Study (ETDRS; not shown in figure).

Representative case. (A–C) Postprocessing of the macular OCT angiography scan image of representative case. (A) Original OCT angiography scan image showing decreased perfusion in inferior macular area. (B) Binarised and skeletonised image from (A). (C) Sectoral SMD was calculated within (1) annulus of 1.0 and 4.0 mm inner and outer diameter divided by six sectors (as shown in C), (2) and annulus of 1.0 and 3.0 mm inner and outer diameter divided by four sectors. The area occupied by large vessels (indicated as blue area) was excluded from the analysis. (D) Disc photo, (E) RNFL photo, (F) circumpapillary RNFL deviation map and (G) macular ganglion cell-inner plexiform layer deviation map of spectral domain-OCT, (H) pattern deviation from standard automated perimetry of the patient. OCT, optical coherence tomography; RNFL, retinal nerve fibre layer; SMD, superficial microvessel density.
One author (J-SK) performed all of the measurements on all eyes while blinded to each patient’s clinical information. In order to assess the intraobserver reproducibility, the measurements were performed once again on 30 randomly chosen eyes. For the purpose of assessing the interobserver reproducibility, another author (SUB) performed the same measurements on another 30 randomly chosen eyes.
Statistical analysis
The Statistical Package for the Social Sciences V.25.0 for Windows (SPSS, Chicago, Illinois, USA) and the R packages pROC V.1.13 were used for the statistical analyses,16 the level of statistical significance having been set at p<0.05. The data obtained are described herein, as appropriate, in terms of their mean±SD values, median frequencies (number of cases) and percentages. The Shapiro-Wilk test, independent t-test, Mann-Whitney test and χ² test were used to compare the variables of each group. The intraobserver and interobserver reproducibilities were assessed by intraclass correlation coefficient (ICC). Pearson’s correlation coefficient was used to measure the strength of the relationship between paired data. Specifically, the level of correlation was assessed by coefficient value (r) as follows: 0.10–0.29=weak, 0.30–0.49=moderate and over 0.50=strong. The area under the receiver operating characteristic (AUROC) curve was used to evaluate diagnostic accuracy. To evaluate the diagnostic accuracy of the combination of variables, binary logistic regression analysis was applied to generate the predictive values of each potential index and then the ROC analysis was able to merge these predictive values to obtain a combined ROC curve. The DeLong test was used to compare the diagnostic abilities of the variables.
Results
Study population
Among the 354 eyes of 354 subjects satisfying the initial inclusion criteria, 243 were excluded. Among the excluded eyes, 64 (26.3%) had unreliable OCT or OCTA scan images, 126 (51.9%) had low MD of SAP (<−5.5 dB) and 53 (21.8%) had high myopia or a coexisting ocular condition known to affect macular thickness or macular superficial vessel density. Thus, a total of 111 eyes (86 early-stage NTG and 25 GS) were analysed in this study. The demographics and clinical characteristics of the subjects are presented in table 1. As indicated, there were no significant difference in age, sex, IOP, CCT, axial length and presence of diabetes mellitus and systemic hypertension. The average MD and pattern SD of SAP was significantly different between two groups. There were no participants who previously underwent aorta surgery.
Demographics and characteristics
Reproducibility of macular SMD measurements
Online supplementary table S1 shows the results of the macular SMD measurement-reliability analysis that used the above-noted customised programme. The intraobserver and interobserver reproducibilities were high, the ICC ranging from 0.907 to 0.999 (p<0.001 for all sectors of both grids).
Supplemental material
Correlation between macular GCIPL thickness and macular SMD
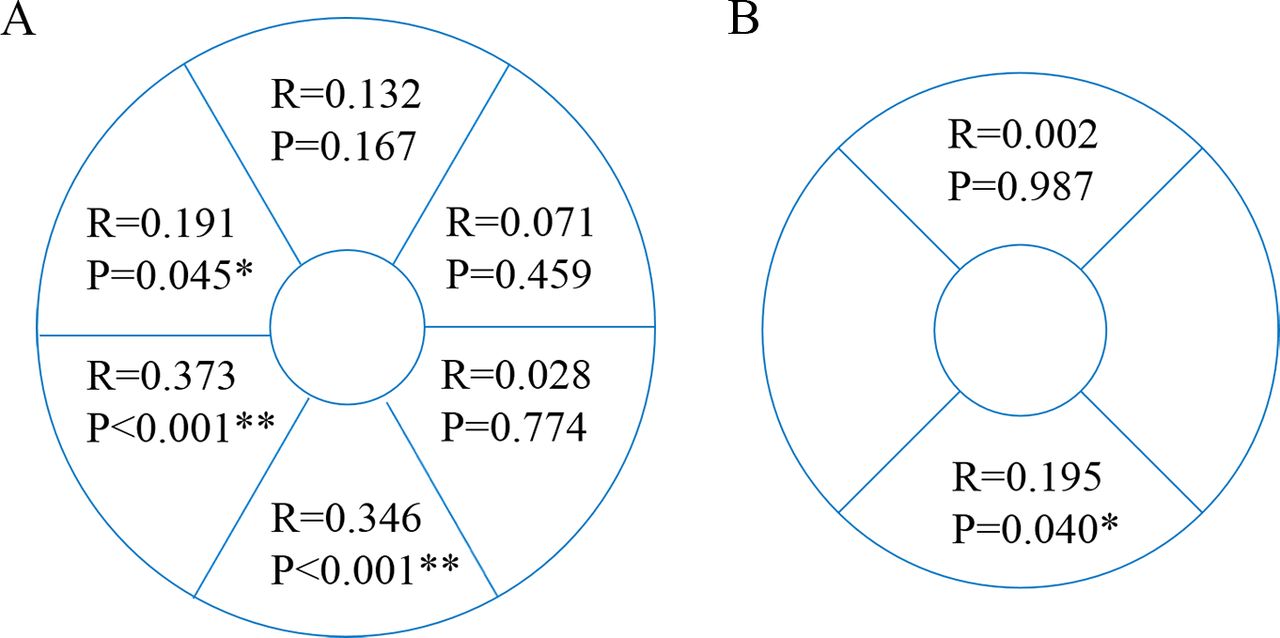
On the 6-sector grid, the ST, IT and II sectors showed weak to moderate correlations between macular GCIPL thickness and macular SMD (r =0.191, p=0.045 for ST; r =0.373, p<0.001 for IT; r =0.346, p<0.001 for II; figures 2A and 3). On the 4-sector grid, inferior quadrant showed weak correlation between macular GCIPL thickness and macular SMD (r =0.195, p=0.040, figure 2B).

Correlations between macular GCIPL thickness and macular superficial microvessel density using different grids (right eye). (A) According to 6-sector grid, superotemporal, inferotemporal and inferoinferior sectors of macula showed significant correlation between GCIPL thickness and SMD. (B) According to 4-sector grid, only inferior quadrant of macula showed weak correlation between GCIPL thickness and SMD. GCIPL, ganglion cell-inner plexiform layer; SMD, superficial microvessel density.

Scatter plots of macular SMD and macular GCIPL thickness. Scatter plots showing correlations between macular SMD and macular GCIPL thickness in each sector of 6-sector grid. Superotemporal, inferotemporal and inferoinferior sectors of macula showed significant correlation between GCIPL thickness and SMD. GCIPL, ganglion cell-inner plexiform layer; SMD, superficial microvessel density.
Correlation between circumpapillary RNFL thickness and macular parameters
The Pearson’s correlation coefficients and p values between the circumpapillary RNFL thickness in each clock-hour region and the macular parameters in each sector are presented in online supplementary table S2. The Pearson’s correlation coefficients and p values relating to the macular GCIPL thicknesses are listed in the upper row, and those relating to the macular SMD are listed in the lower row, for each cell. The cells showing a statistically significant positive correlation between circumpapillary RNFL thickness and macular GCIPL thickness are highlighted in light grey and those showing a significant correlation between circumpapillary RNFL thickness and macular SMD are highlighted in dark grey. Circumpapillary RNFL thickness and macular SMD showed significant correlations between (1) the ST sector of the macula and the 1, 9 clock-hour peripapillary regions and (2) the IT and II sectors of the macula and the 6, 7, 8 clock-hour peripapillary regions (r and p values are presented in online supplementary table S2). The associations between SS sector macular SMD and 4 clock-hour circumpapillary RNFL thickness and between ST sector macular SMD and 1 clock-hour circumpapillary RNFL thickness were thought to be incidental findings; Pearson’s correlation coefficients and p values were relatively low, and there has been no previous study reporting any association between those parameters. All of the sectors showing a significant correlation between RNFL thickness and macular SMD also showed a significant correlation between RNFL thickness and GCIPL thickness.
Diagnostic accuracies of differentiating early glaucoma from GS
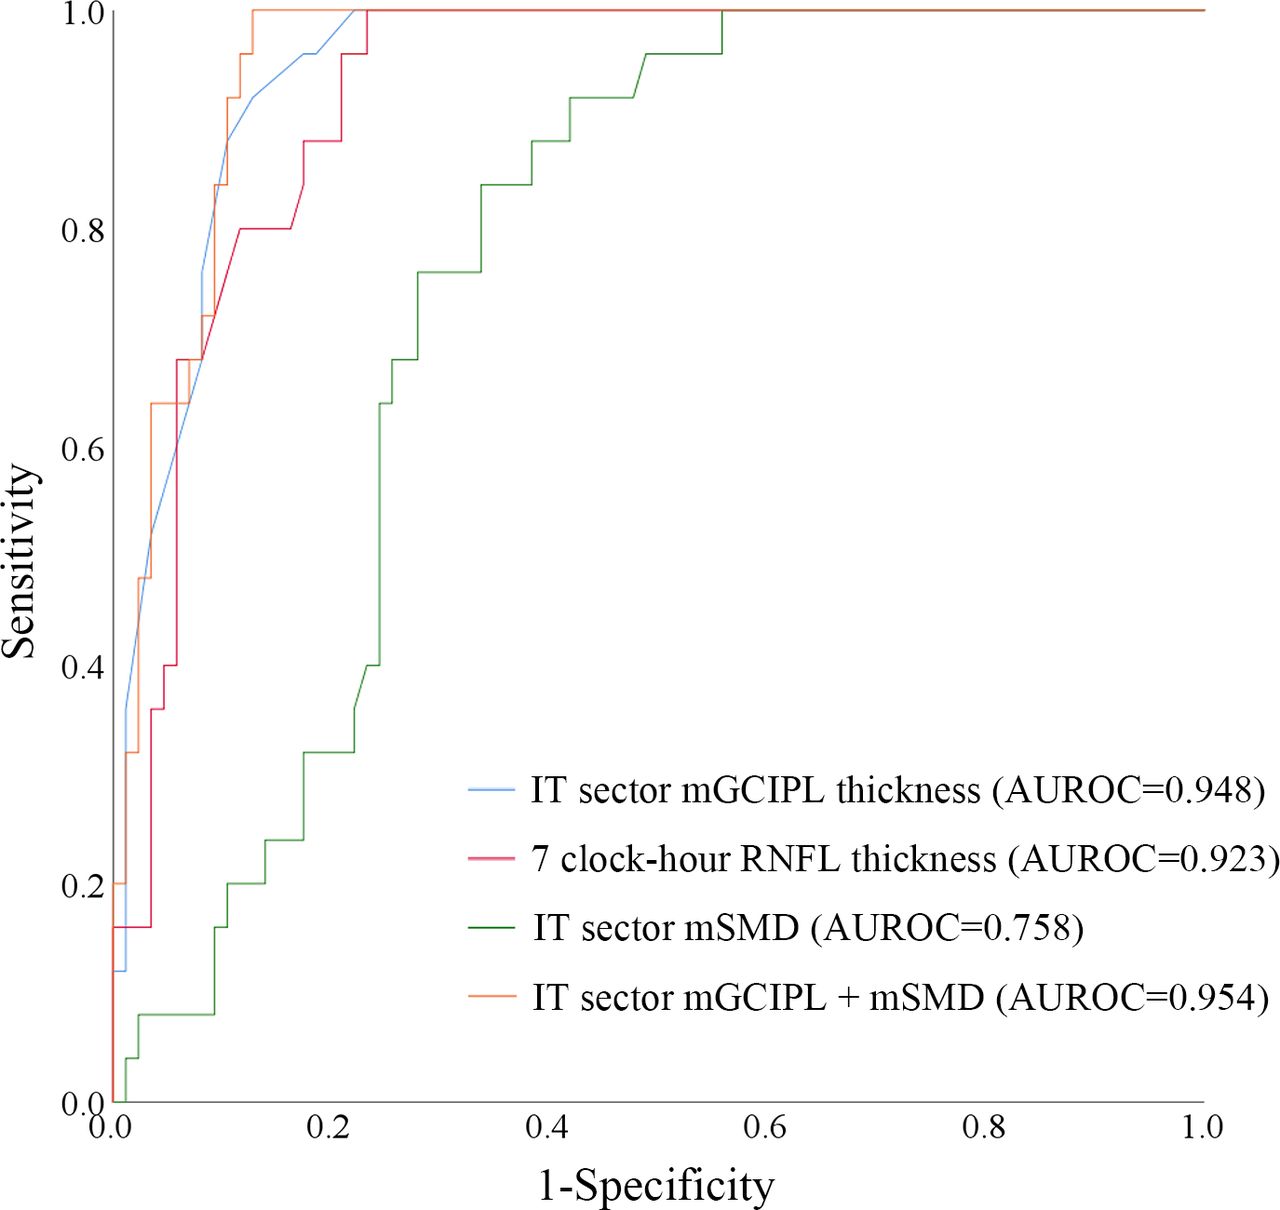
Figure 4 shows the receiver operating characteristic (ROC) curves representing the diagnostic accuracy in detecting early glaucoma. The IT sector macular GCIPL thickness showed the highest diagnostic accuracy among all macular GCIPL thickness parameters (AUROC=0.948; 95% CI 0.910 to 0.986), and IT sector macular SMD showed the highest diagnostic accuracy among all macular SMD parameters (AUROC=0.758; 95% CI 0.670 to 0.846). The 7 clock-hour circumpapillary RNFL thickness showed the highest diagnostic accuracy among all circumpapillary RNFL thickness parameters (AUROC=0.923; 95% CI 0.875 to 0.972). Diagnostic accuracy of IT sector macular GCIPL thickness and 7 clock-hour circumpapillary RNFL thickness was statistically similar (p=0.436), but both were superior to that of IT sector macular SMD (p<0.001 for both). The combination of IT sector macular GCIPL thickness and macular SMD showed the best diagnostic accuracy (AUROC=0.954; 95% CI 0.919 to 0.989), but was not statistically superior to that of IT sector macular GCIPL alone (p=0.811).
ROC curves of OCT and OCTA parameter. The IT sector macular SMD showed fair diagnostic accuracy (AUROC=0.758), but was inferior to that of IT sector macular ganglion cell-inner plexiform layer thickness (AUROC=0.948) or 7 clock-hour circumpapillary retinal nerve fibre layer thickness (AUROC=0.923, Clock-hours are based on the right eye). The combination of IT sector macular SMD and GCIPL thickness showed the best diagnostic accuracy (AUROC=0.954), but was not statistically superior to that of IT sector macular GCIPL alone (p=0.811). AUROC, area under the receiver operating characteristics; GCIPL, ganglion cell-inner plexiform layer; IT, inferotemporal; OCT, optical coherence tomography; SMD, superficial microvessel density.
Discussion
The present study investigated the topographic correlation between macular SMD and macular GCIPL thickness as well as circumpapillary RNFL thickness in glaucoma-suspect and early-stage NTG eyes. Additionally, diagnostic accuracies of OCT parameters and macular SMD were investigated. Our data indicate that macular GCIPL thickness has a good correlation with macular SMD in GS and early NTG eyes and macular SMD has a fair diagnostic accuracy differentiating early-stage NTG eyes from glaucoma suspects. Furthermore, the combination of macular GCIPL thickness and macular SMD showed better diagnostic accuracy.
In this study, macular SMD was calculated with customised software (ImageJ). Currently, there are no generally accepted definitions of, or algorithms with which to obtain, vessel density from raw OCTA scan data. Some studies have defined vessel density as ‘the percentage area occupied by vessels and microvasculature in the selected region’,17 18 while others have focused on vessel-length density (VLD), which is defined as ‘the vessel length per unit area calculated based on the skeletonised image’.9 In our study, we introduced microvessel density (defined as ‘vessel length per unit area calculated based on skeletonised image except for large vessels)’,19 since large vessels do not participate directly in perfusion. Moreover, VLD analysis creates low-vessel-density areas around large vessels during image processing (figure 1B), which might result in false low-VLD values. Our algorithm, significantly, would be free of such error, and therefore would more accurately reflect perfusion status.
Another advantage of customised analysis is that we can customise the grid. Currently, there are some OCTA manufacturers that provide automated vessel density analysis with unpublished algorithms. They all provide a 4-sector grid resembling the ETDRS grid, which cannot reflect difference across the horizontal raphe. In the case of the OCTA device used in the present study (DRI Triton), the ETDRS grid of 3.0 mm outer diameter and 1.0 mm inner diameter is the only grid that can be used in automated vessel density analysis. A paper by Kim et al reported that large macular grids have generally high discriminating power for diagnosis of early glaucoma by SD-OCT.20 The data in our study likewise clearly indicated that analysis with the 6-sector grid (outer diameter: 4 mm) shows better correlations between macular GCIPL thickness and macular SMD than does analysis with the 4-sector grid (outer diameter: 3 mm)
Many studies have reported better correlations of macular vascular density with functional parameters than with structural parameters.10 21 22 An analysis in the present study using the 6-sector grid showed significant positive correlations between macular SMD and macular GCIPL thickness in the ST, IT and II sectors. Our data showed a stronger correlation between macular superficial vessel density and macular GCIPL thickness than a previous study, which showed a moderate correlation in only the II sector.15 Major differences between that study and the present one are the definitions of the vessel density parameters and the study populations. As discussed earlier, our algorithm offers the advantage of excluding large vessels that can false-negatively affect superficial vessel density. Furthermore, that earlier study, unlike the present report which included only glaucoma suspects or patients with early-stage NTG, included patients at all stages of open-angle glaucoma. Yarmohammadi et al reported the possibility that decreased vessel density precedes detectable structural and functional damage in glaucomatous eyes with single visual hemifield defect and unilateral visual field loss.22 23 A recent longitudinal cohort study showed that the mean rate of change in macular en-face vessel density was significantly faster in glaucomatous eyes than in GS or healthy eyes, with no significant ganglion cell complex thickness change, in all diagnostic groups.24 Accordingly, it is possible that in early-stage glaucoma, when RGCs are less affected, the relationship between GCIPL thickness and superficial vessel density is more linear than in advanced-stage glaucoma.
According to our present results, there were various degrees of correlation between sectoral macular SMD and circumpapillary RNFL thickness. Especially, IT and II-sector SMD showed a moderate correlation with RNFL thickness in the 7 and 8 clock-hour region, which was mentioned as a macular vulnerability zone by Hood et al.25 However, GCIPL thickness showed a stronger correlation with RNFL thickness overall, suggesting that it is more likely to be associated with RNFL thickness than SMD. From the point of view of SMD, macular SMD and circumpapillary RNFL thickness showed similar degrees of correlation with macular GCIPL thickness. Future studies may be needed to clarify the temporal sequence of vessel-density, circumpapillary-RNFL-thickness and macular-GCIPL-thickness reduction.
The diagnostic accuracies of macular OCTA parameters have been reported to be inferior to that of macular OCT parameters.15 26 27 Our data also showed that diagnostic accuracy of macular GCIPL thickness and circumpapillary RNFL thickness were superior to that of macular SMD. However, compared with previous studies that reported diagnostic accuracy of macular vessel density parameter to be 0.559–0.983, our data showed similar and still good diagnostic accuracy of macular SMD even in subjects with early-stage NTG and GS. Moreover, the combination of macular GCIPL thickness and macular SMD showed the best diagnostic accuracy among all of the variables, indicating that macular SMD could be used as a complementary variable in diagnosis of early glaucoma.
There have been reports that OCTA-derived variables might be more useful in the late stages of glaucoma.21 28 Kiyota et al found that peripapillary vessel density in the annulus region between 3.2 and 3.6 mm showed the highest AUROC value (0.70) in differentiating moderate and severe glaucoma and concluded that this new parameter might be valuable in assessment of glaucoma severity in the advanced stages.28 But this result does not indicate that the vessel density parameter is less useful in evaluation of early-glaucoma eyes, especially when our parameter is measured in the macular area, not the peripapillary area. Yarmohammadi et al found that reduced vessel density in a whole OCTA image is associated with more severe glaucoma. Together, these results imply that the vessel density parameter might be useful in all stages of glaucoma. It is possible that vessel density in the macular area decreases first in the early stages of glaucoma, and that peripapillary vessel density decreases in the late stages. Further study focused on specific stages of glaucoma is needed in order to elucidate this issue.
There are several limitations to the present study. First, due to the retrospective nature of this study, we could not evaluate the correlation in a normal population. Further study is needed to clarify this question. Second, we did not exclude subjects with diabetes mellitus or systemic hypertension, both of which can affect macular SMD. Even though we excluded eyes with manifest diabetic retinopathy and hypertensive retinopathy, subclinical vascular change could have altered superficial retinal vessel status as a confounding factor.
In conclusion, sectoral macular SMD showed significant topographic correlations with macular GCIPL thickness and circumpapillary RNFL thickness in glaucoma suspects and patients with early-stage NTG. Sectoral macular SMD also showed fair diagnostic accuracy, and its combination with sectoral macular GCIPL thickness showed the best diagnostic accuracy in differentiating patients with early-stage NTG from glaucoma suspects. Macular SMD analysis, therefore, can be potentially useful in the clinical evaluation of early glaucoma.
References
Footnotes
Contributors J-SK: data collection, data analysis and interpretation, drafting the article. YKK, SUB: data analysis and interpretation, critical revision of the article. AH, YWK, JWJ: critical revision of the article. KHP: design of the work, critical revision and final approval of the article to be published.
Funding The authors have not declared a specific grant for this research from any funding agency in the public, commercial or not-for-profit sectors.
Competing interests None declared.
Patient consent for publication Not required.
Ethics approval Seoul National University Hospital Institutional Review Board (IRB No. 1805-185-950).
Provenance and peer review Not commissioned; externally peer reviewed.
Linked Articles
- At a glance