Article Text

Abstract
Background Anti vascular endothelial growth factor (VEGF) therapy is an established treatment for various retinal diseases. Long-term data on injection frequencies and visual acuity (VA), however, are still rare.
Methods Five-year analysis of real-life VA developments and injection patterns from 2072 patients (2577 eyes; 33 187 injections) with chronically active disease undergoing pro-re-nata treatment for age-related macular degeneration (AMD), diabetic macular oedema (DME), retinal vein occlusion (RVO) and myopic choroidal neovascularisation (CNV).
Results Maximum mean VA gain in year 1 was+5.2 letters in AMD, +6.2 in DME, +10 in RVO and+7.2 in myopic CNV. Over 5 years, however, VA in patients with AMD declined. By year 5, 34% of patients with AMD had experienced VA loss of >15 letters, 56% had remained stable and 10% had gained >15 letters. Long-term VA developments in DME and RVO were more favourable with 81% of DME and 79% of patients with RVO gaining or maintaining vision at 5 years. In AMD, median injection frequency was six in year 1 and between four and five in consecutive years. In DME and RVO, median injection frequency was six in year 1 but lower compared with AMD in consecutive years. Injection frequency in DME was weakly associated with patient age (rs=0.1; p=0.03).
Conclusions In AMD, the initial VA gain was not maintained long term despite higher injection numbers compared with DME, RVO and myopic CNV. The presented real-world data provide a peer-group-based estimate of VA developments and injection frequencies for counselling patients undergoing long-term anti-VEGF therapy.
- Angiogenesis
- Macula
- Neovascularisation
- Retina
This is an Open Access article distributed in accordance with the Creative Commons Attribution Non Commercial (CC BY-NC 4.0) license, which permits others to distribute, remix, adapt, build upon this work non-commercially, and license their derivative works on different terms, provided the original work is properly cited and the use is non-commercial. See: http://creativecommons.org/licenses/by-nc/4.0/
Statistics from Altmetric.com
Introduction
Anti vascular endothelial growth factor (VEGF) therapy for age-related macular degeneration (AMD) was first introduced in 2005 with the off-label use of bevacizumab (Avastin).1 This was followed in short sequence by the approval of anti-VEGF agents specifically designed for intraocular use (pegaptanib (Macugen), ranibizumab (Lucentis) and aflibercept (Eylea)).2–4 From AMD, intravitreal anti-VEGF therapy soon spread successfully into treatment recommendations for other retinal diseases. Anti-VEGF therapy is now approved for use in patients with AMD, diabetic macular oedema (DME), myopic choroidal neovascularisation (CNV) and macular oedema following retinal vein occlusion (RVO).
However, two pertinent questions remain: (i) how often will an individual patient need to be treated over the years and (ii) what will his or her visual acuity (VA) outcome be. The SEVEN-UP study has shown for a group of 155 patients with AMD that the encouraging VA results from the first two treatment years cannot be carried forward to the following years and that VA declines over time.5 To date, there is no indicator that would allow physicians to predict injection frequency, duration or VA outcome in a particular patient. This is true for AMD, DME, myopic CNV and RVO.
Currently, various anti-VEGF treatment protocols exist: fixed monthly or bimonthly injections,2–4 pro-re-nata (PRN) and treat-and-extend (TAE) protocols. Results from the comparison of AMD treatments trial (CATT) and Inhibition of VEGF in Age-related Choroidal Neovascularisation (IVAN) studies have found comparable outcomes with monthly and PRN regimens in AMD.6 ,7 Today, most centres use either PRN or TAE protocols. It is, however, often not possible to fully adhere to one of these protocols in daily practice since individual patient factors (both medical and organisational) have to be taken into account when scheduling an individual patient's regimen.8–10
At our institution, patients with AMD are treated with a PRN regimen that is based on the IVAN study's PRN protocol with sets of three injections. For DME, myopic CNV and RVO, we also use PRN protocols based on recommendations from the German Ophthalmological Societies.11 ,12 The details of these PRN protocols are summarised in online supplementary table S1. Our aim with this study was to analyse 5-year VA outcomes and injection patterns of real-world patients with AMD, DME, myopic CNV and RVO under these PRN regimens. Our study is limited to patients who either have still active disease and/or ongoing follow-up examinations at the indicated time points.
Supplemental material
Methods
This retrospective monocentre study was approved by the ethics board at the University of Freiburg Medical Centre (No. 26/15). All patients were treated using a PRN regimen. Treatment decisions were made by nine retina specialists who all followed the same coordinated treatment protocols (see online supplementary table S1). For patients with myopic CNV, we altered our treatment protocol between 2009 and 2014 from sets of three injections as in AMD to single injections followed by optical coherence tomography follow-up. For all disease groups, we included all eyes that had their first anti-VEGF injection between July 2009 and July 2014 and a follow-up data period of at least 1 year available at our centre. Patients with follow-up of less than 1 year were not included, since no information on long-term outcomes could be obtained for these patients. Eyes treated with intravitreal corticosteroids were not included in the analysis.
Patients' diagnoses were derived from International Classification of Diseases (ICD10-GM) as coded during the patients' visits in our outpatient department. Injection dates were extracted from electronic operating room schedules. Patients' VAs were extracted from medical reports written during follow-up visits. Estimation of the mean distance between the patient's place of residence and our clinic was extracted from a public registry of geo-coordinates for German zip codes (http://www.opengeodb.org; accessed: 2 January 2015). All data were fully anonymised before analysis.
Data analysis was done using GNU R, a programming language for statistical computing available under the GNU General Public License.13–17 If both eyes were injected, they were analysed independently on a per eye basis. The follow-up period was defined from the date of the first injection to the date of the last injection of a particular eye (if further injections were still being needed at the end of our observational window) or from the date of the first injection to the date of the last visit in our outpatient department (if no additional injections were scheduled).
VA was recorded in decimal notation with autorefraction or patient's glasses (whichever gave better results) and converted to logarithm of the minimum angle of resolution (logMAR) for statistical analysis. To calculate VA changes, ETDRS letters were computed from the difference between preinjection and postinjection logMAR values. VA change was defined as the difference between last available VA before first injection and first available VA after final injection. Cumulative injection numbers were analysed on a per-day-per-diagnosis basis: for every single day during our observational timeframe, the number of cumulative injections given for each diagnosis was calculated. This sum was divided by the number of eyes still receiving treatment at the respective day. Statistical assessment was performed using Spearman's correlation. Spearman's rank correlation coefficient (rs) was used to measure statistical dependence, and p values (p) were used to indicate statistical significance.
Results
In total, 33 187 injections in 2577 eyes of 2072 patients (883 male and 1189 female) were analysed. Data on VA at baseline and at least 1 year of follow-up were available for 1634 eyes from 1388 patients. For a detailed overview of patients characteristics at baseline, see online supplementary table S2.
The most important outcome variable for a patient receiving anti-VEGF treatment is whether his or her VA improves, remains unchanged or deteriorates. Figure 1 shows the relative proportions of patients gaining >15 letters, remaining unchanged (ie, within±15 letters) or losing >15 letters over 5 years of treatment. In AMD, the group of patients with >15 letters loss increases over time from 11% in year 1 to 34% in year 5. Sixty-six per cent of patients with AMD retain or gain vision over 5 years. In DME, the group of patients with >15 letters loss is 19% over 5 years. This is matched by an equal number of 19% of patients gaining >15 letters over 5 years. Patients with RVO have a larger percentage of patients experiencing significant VA gain compared with AMD or DME. By year 5, 24% of patients with RVO have gained >15 letters, 55% have remained stable and 21% have lost >15 letters. In myopic CNV, there is a good initial VA response with 92% of patients either gaining or retaining VA in year 1. For consecutive years, patient numbers with myopic CNV are too low for reliable analysis. In all disease groups, patients with low baseline VA experienced a more robust mean VA gain compared with patients with higher baseline VA (see online supplementary figure S1). There was no systematic difference in VA outcomes for patients receiving different anti-VEGF agents (bevacizumab/aflibercept/ranibizumab).

Relative numbers of patients with visual acuity (VA) gain, stabilisation or loss over 5 years. Graphic representation (A) and tabulated view (B) of VA changes categorised by groups. Green colour in (A) indicates VA gain of ≥15 ETDRS letters, yellow colour stable VA within±15 letters and red colour VA loss of ≥15 letters. In age-related macular degeneration (AMD), the percentage of patients with significant VA loss increases over time to 34% at year 5. In diabetic macular oedema (DME) and retinal vein occlusion (RVO), this increase is less pronounced. In DME, there is even a slight increase in the percentage of patients with significant VA gain in year 5 compared with year 1. For myopic choroidal neovascularisation (CNV), initial VA response is good but numbers are low for later time points. Numbers (n) in this graph represent eyes for which VA data was available from the indicated year.
In year 1, all patient groups experienced an initial VA gain (figure 2A). Mean maximum VA gain during year 1 was+5.2 letters for AMD, +6.2 letters for DME, +7.2 letters for myopic CNV and+10.0 letters for RVO. The maximum VA gain, however, occurred at different time points for each patient. As a result, mean VA change for any given time point in figure 2A is less pronounced. By the end of year 1, mean VA was −0.4 letters for AMD, −1.3 letters for DME, +7.0 letters for myopic CNV and+4.2 letters for RVO. After 5 years, mean VA had declined considerably in patients with AMD but remained close to±0 letters from baseline in all other indications (figure 2B). It has to be taken into account that this long-term data is to a large extent driven by patients requiring long-term injections. Patients with controlled disease and no further need for injections become lost to follow-up at our treatment centre over time and have follow-up visits at their local ophthalmologist. This analysis is therefore representative only for patients with chronically active disease.
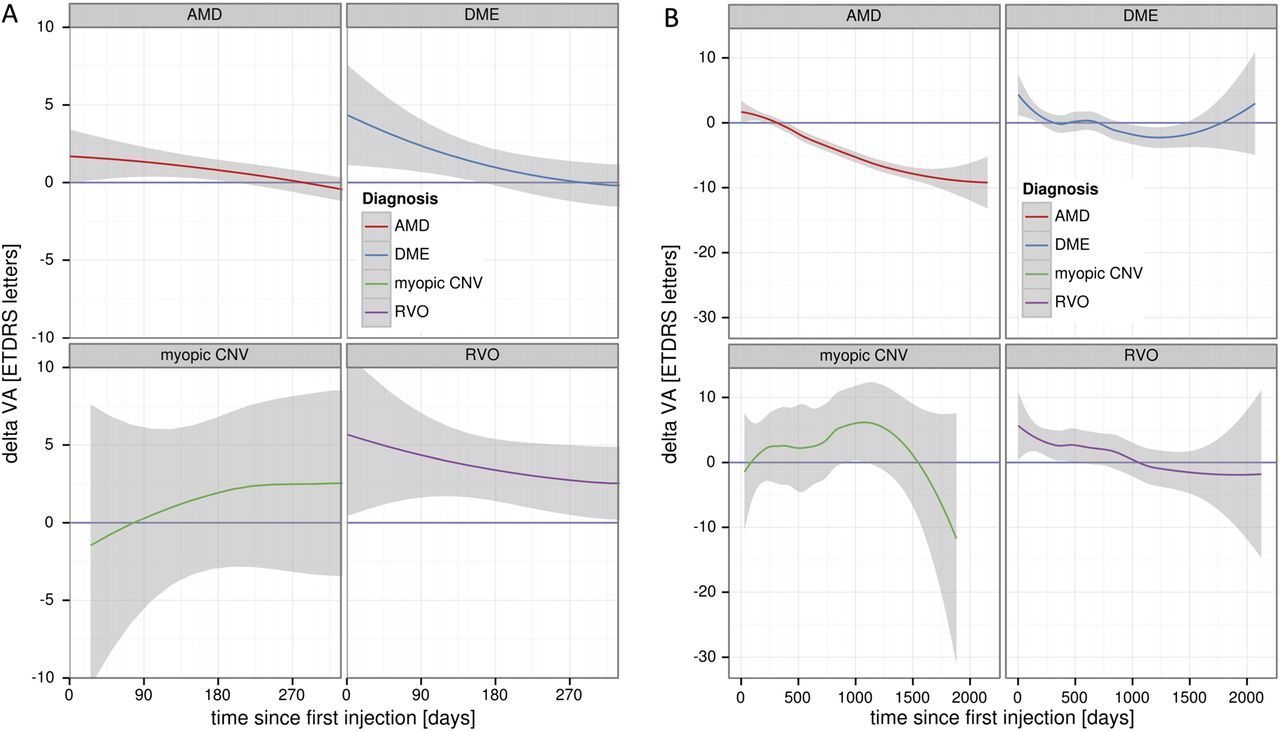
Absolute visual acuity (VA) change over time. (A) In the first treatment year, mean VA increased initially in all indications. However, patients with age-related macular degeneration (AMD) and diabetic macular oedema (DME) returned close to±0 letters by the end of year 1. Retinal vein occlusion (RVO) eyes, in contrast, maintained some of their VA gain until the end of year 1. For eyes with myopic choroidal neovascularisation (CNV), the 95% CI (grey colour) is very wide due to low overall numbers in this group, limiting reliable data interpretation for these patients. Note that maximum VA gain was an average of +5.2 letters for AMD, +6.2 letters for DME, +7.2 letters for myopic CNV and +10.0 letters for RVO. This maximum VA gain, however, occurred at different time points for each patient. As a result mean, VA change for any given time point in the graph is less pronounced. (B) Over the full 5-year observational time frame, mean VA in AMD eyes declined considerably, while mean VA for DME and RVO eyes remained close to±0 letters from baseline. Note that later time points reflect a selection of patients with persistent disease activity still requiring injections. Patients with earlier treatment termination will have been lost to follow-up at our centre at these later time points.
For patients with AMD, a median number of six injections was administered in year 1 (figure 3A). There was, however, a wide variability with injection frequencies ranging from 1 to 12 injections. Most patients received multiples of three injections, which is reflected in figure 3A by an increased width of the AMD graph at three, six and nine injections. Patients with DME and RVO show similar median injection numbers in year 1, while patients with myopic CNV had the lowest median injection frequency. The width of the myopic CNV graph indicates a relative clustering of patients at three injections per year, indicating a subgroup of patients for whom three injections were sufficient during the first year. Since we altered our treatment protocol for myopic CNV from sets of three injections to single injections during our observational window (see Methods section), the myopic CNV graph represents patients treated with different PRN regimens over the years.

Injection numbers during year 1 and consecutive years. (A) Median injection numbers in the first year were six in age-related macular degeneration (AMD), diabetic macular oedema (DME) and retinal vein occlusion (RVO) eyes and five in eyes with myopic choroidal neovascularisation (CNV). Black diamonds represent the median and 25 and 75 quartiles, respectively. (B) Injection frequencies declined in all indications for most of the follow-up years but remained highest in AMD compared with all other indications. Black line represents median, and grey dots represent individual eyes (dots are scattered for better visibility). Note that there are significant numbers of patients with zero injections in each follow-up year. These patients did not receive injections in this particular year, but follow-up data exists. (C) Tabulated view of number of eyes (n) available for analysis at each indicated year. Over 600 AMD eyes had complete follow-up data available for at least 3 years (>100 for DME and RVO). Numbers for myopic CNV were low with only 45 patients even at year 1. Only patients with completed follow-up years were analysed.
Beyond year 1, injection frequencies decline in all indications (figure 3B). In AMD, the median injection number decreased from six in the first year to between four and five in consecutive years. Injection frequencies in DME show a more pronounced decrease from a median of six injections in the first year to between one and two in years 2–4 before rising again to six in the fifth year. Whether the decrease in years 2–4 is due to diminished disease activity or reflects reduced adherence to therapy cannot be deduced from this data. For patients with myopic CNV or RVO, injection frequencies also decrease over the years. It must be noted, however, that patient numbers are low for myopic CNV from the beginning and become lower with longer follow-up duration in all other indications. Patient numbers over the years are listed in figure 3C. Our cohort is largest for AMD with still over 600 eyes at year 3. For DME and RVO, numbers are lower but still representing over 100 eyes at year 3. Numbers for myopic CNV are lower with only 45 patients even at year 1.
In our cohort, patients with high injection numbers in the first year tended to have higher injection frequencies in consecutive years (figure 4A). There are, however, differences across the four groups. DME and RVO patients demonstrate an almost linear correlation between injection numbers in the first versus follow-up years. Patients with AMD or myopic CNV have a less linear correlation. Over the years, patients with AMD accumulate the highest cumulative injection number (figure 4B).
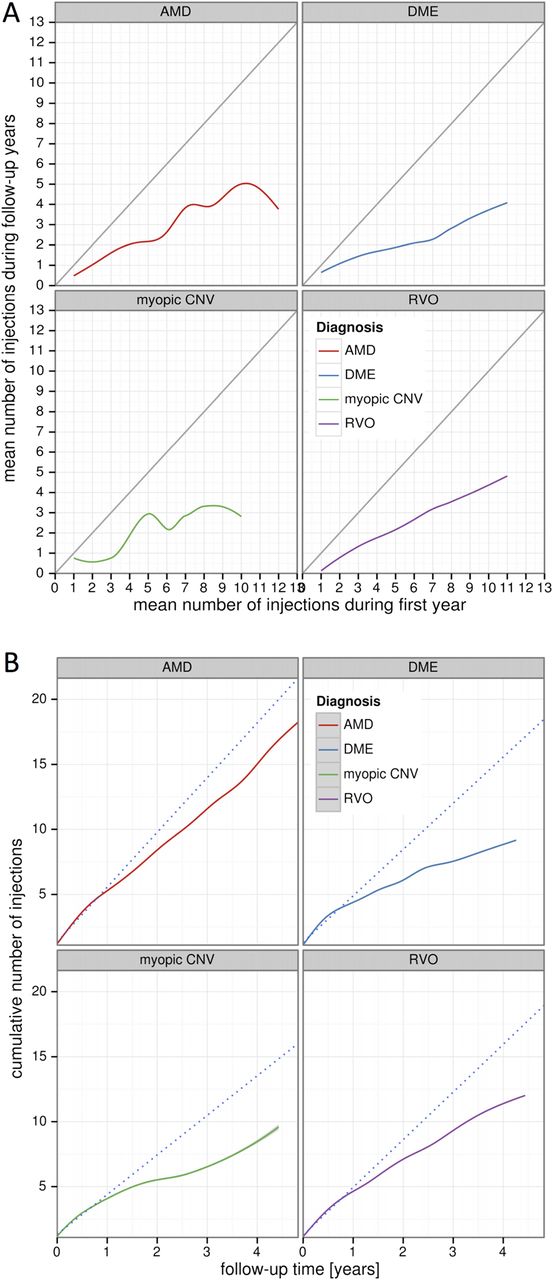
Association between injections in year 1 and consecutive years as well as cumulative injection numbers. (A) Injections in year 1 (x-axis) are plotted against the mean injection number from follow-up years (y-axis). The grey line represents a hypothetical line for patients receiving the same number of injections in year 1 and follow-up years. In all indications, the true injection curves are below this hypothetical line indicating that injection numbers in follow-up years are lower than in year 1. In all indications, patients with high injection numbers in year 1 tend to receive higher injection numbers in the consecutive years. (B) Cumulative injection numbers over time. The dotted line represents a hypothetical line for patients that would have carried forward their injection frequencies from year 1 into the follow-up years. For all indications, true cumulative injection curves are below this line indicating slower accumulation of injections during follow-up years. For patients with age-related macular degeneration (AMD), however, the slope of the cumulative injection curve remains relatively steep yielding the highest number of cumulative injections over time in AMD compared with the other indications.
When analysing possible variables that might affect treatment patterns, we found no significant difference between male and female patients (data not shown). For patients with DME, the mean number of injections per year increased slightly relative to patient age (rs=0.1; p=0.03; figure 5A). For all other indications, there was no correlation between patient age and injection frequencies. When investigating the impact of distance from the patient's place of residence to our hospital on injection patterns, we found no significant association (p>0.05 for all diseases; figure 5B). Note that in figure 5A the AMD cohort is shown together with a group of younger patients classified as macular disease (MD) other than AMD (eg, CNV secondary to chorioretinal scars). These younger patients with MD received fewer injections compared with patients with AMD (3.8 vs 6.3 in year 1).

Associations of injection frequencies with (A) patient age and (B) distance between patient's place of residence and our hospital. (A) Eyes with diabetic macular oedema (DME) displayed a positive but weak correlation between patient age and mean number of injections (rs=0.1; p=0.03). For all other indications, there was no such association. However, patients with AMD (red) received on average more injections compared to a group of younger macular disease (MD) patients with CNV from other causes (orange). (B) Across all indications, there was no association of injection frequencies with distance between patient's place of residence and our hospital.
Discussion
After 5 years of anti-VEGF treatment, patients with AMD in our cohort achieved VA stabilisation in 56% of eyes and significant VA improvement in 10%. However, 34% of AMD eyes experienced significant VA loss. This proportion matches the 34% of patients with ≥15 letters loss reported in the SEVEN-UP study5 and very likely represents vision loss from a variety of reasons including geographic atrophy, fibrosis and poor response to anti-VEGF treatment. AMD eyes in our cohort received an average of six injections in the first year. This is slightly lower than the seven PRN injections reported in the CATT study,18 likely reflecting the differences between clinical reality and study protocols as well as the fact that our PRN protocol applied multiples of three injections. Over the first 2 years, AMD eyes in our cohort received an average of 12.3 injections, which is higher than the range of 3.2–11 injections reported in the AURA study.19 Note that the majority of patients with long-term follow-up in our study have chronically active disease. The presented data on VA outcomes and injection numbers may therefore not be representative for patients who terminate anti-VEGF treatment earlier—either due to beneficial or detrimental developments of their disease.
For eyes with DME, we observed VA stabilisation in 62% at year 5. Significant VA increase and decrease were both at 19% at year 5, demonstrating better long-term VA outcomes compared with AMD. Injection frequencies in DME declined from six in year 1 to between one and six annual injections in consecutive years. The recently published protocol T study reported 9–10 injections in year 1 followed by five to six injections in year 2.20 ,21 Since the design of our PRN protocol covers the years from 2009 to 2014, results from the protocol T study had not yet been incorporated into clinical practice. It cannot be concluded from our data whether more aggressive DME treatment might have altered long-term VA outcomes in our cohort.
Patients with RVO in our study had slightly more injections than patients with DME and a higher percentage of patients with substantial VA gain at year 5. Eyes with myopic CNV required fewer injections compared with all other disease entities and had good VA response. However, patient numbers were low for this group, especially at later time points.
With regard to total number of injections, we found the highest cumulative injection number in patients with AMD whose injection curve slows only slightly after the first year and then keeps accumulating further injections in a rather linear fashion over the following years. This pattern is very different from patients with DME where the cumulative injection curve levels off after the first year, adding additional injections only slowly over the consecutive years in our cohort. These data, however, need to be interpreted cautiously since possible differences in treatment adherence across disease groups could have an effect on cumulative injection numbers.
When investigating associations between injection frequencies in year 1 and consecutive years, retrospective data cannot provide predictive parameters. However, retrospective observations can still serve as an indication of how different pathologies develop over time with regard to disease activity and treatment need. In all diseases, we observed a decline in injection frequency beyond year 1. It can, however, not be deduced that this decline in injection frequency represents a favourable course of the disease. In some patients this may well be the case, while in others reduced injection frequency may be secondary to increased scarring of the macula or diminishing patient adherence to treatment over time. Nevertheless, it is important to acknowledge the existence of such developments in a real-life patient population and the fact that these patient cohorts may differ significantly from patients in controlled clinical trials.
References
Footnotes
Synopsis This study presents 5-year real-world data on visual acuity outcomes and intravitreal injection patterns from 2577 eyes treated for chronically active age-related macular degeneration, diabetic macular oedema, retinal vein occlusion and myopic choroidal neovascularisation.
Contributors TW and AS: study conception, data acquisition, analysis and interpretation of data, drafting and revising the manuscript, final approval and agreement to be accountable for all aspects of the work. CE: study conception, data acquisition, interpretation of data, revising the manuscript, final approval and agreement to be accountable for all aspects of the work. AB, CL and HA: data acquisition, interpretation of data, revising the manuscript, final approval and agreement to be accountable for all aspects of the work. DB: data analysis and interpretation of data, revising the manuscript, final approval and agreement to be accountable for all aspects of the work.
Funding AS is supported by the DFG (STA 1102/5-1) and the German Ophthalmic Society (DOG). This work was supported by a research grant from Novartis Germany.
Competing interests None declared.
Ethics approval Ethics committee at the University of Freiburg, Germany.
Provenance and peer review Not commissioned; externally peer reviewed.
Linked Articles
- At a glance