Article Text

Abstract
Purpose To evaluate the relationship between the displacement of the lamina cribrosa (LC) and prelaminar tissue with corneal hysteresis (CH) using spectral-domain coherence tomography (SD-OCT) after reducing intraocular pressure (IOP) with medical treatment.
Methods Sixty-one eyes of 61 patients with ocular hypertension or primary open-angle glaucoma who were going to start with treatment were imaged by means of 12 cross-sectional scans of the optic nerve using enhanced depth imaging SD-OCT before and after 1 week of treatment. We used the ‘follow-up’ mode to make sure that all the measurements were performed in the same location. We also measured the CH using an Ocular Response Analyzer, and we related it to the magnitude of displacement of LC and prelaminar tissue and the thickness of both structures.
Results There was a significant variation of LC thickness from 132.66±37.40 to 160.09±41.13 µm (p<0001). LC distance was significantly reduced from 258.53±145 µm before treatment to 239.86±135 µm after it. No significant changes were found in the thickness and movement of prelaminar tissue before and after treatment. The only factors related with LC displacement were CH (R2=0.48) and age (R2=0.42).
Conclusions A significant increase in LC thickness and a reduction in the posterior displacement of LC but not in the prelaminar tissue were demonstrated after IOP reduction with medical treatment. The factors most related with LC displacement were age and CH.
- Glaucoma
- Optic Nerve
This is an Open Access article distributed in accordance with the Creative Commons Attribution Non Commercial (CC BY-NC 4.0) license, which permits others to distribute, remix, adapt, build upon this work non-commercially, and license their derivative works on different terms, provided the original work is properly cited and the use is non-commercial. See: http://creativecommons.org/licenses/by-nc/4.0/
Statistics from Altmetric.com
Introduction
The pathogenesis of glaucomatous optic neuropathy remains unclear, although several hypotheses have emerged. The mechanical theory attributes retinal ganglion death cells to compression of axonal fibres and the support structures of the anterior optic nerve by the distortion of the plates of the lamina cribrosa (LC) and interruption of axoplasmic flow. Intraocular pressure (IOP)-related stress (force/cross-sectional area) and strain (local deformation of the tissues) are determinants of the pathophysiology of the optic nerve head tissues and their blood supply, causing alterations in the LC and peripapillary sclera and in the cellular components including astrocytes or glial cells.
Corneal hysteresis (CH) is related with corneal biomechanical properties. It measures the energy absorption during the ‘loading–unloading’ cycle (stress–strain cycle of viscoelastic materials) and explains the dampening effect of the cornea.
Reversal of optic disc cupping after IOP reduction has been documented in several studies, previously with optic disc photography1–5 and most recently using spectral-domain optical coherence tomography (SD-OCT) that has demonstrated changes in the position and thickness of the LC.6 Lee et al7 were able to visualise the LC using enhanced depth imaging (EDI) SD-OCT, a technique originally developed to see the full thickness of the choroid. With this technique, the authors obtained a better signal of the tissue located behind the epithelium pigmentarium and the LC.
The aim of the present study is to evaluate the factors related with LC displacement including CH after IOP reduction with medical treatment.
Methods
Seventy-seven consecutive patients with ocular hypertension who were going to start glaucoma therapy were prospectively recruited between April 2012 and September 2014. This study was approved by the Review Board of FISABIO and conformed to the Declaration of Helsinki. Informed written consent was obtained from all subjects.
Patients who satisfied the inclusion and exclusion criteria were included. All these patients underwent a complete ophthalmic examination, including visual acuity assessment, Goldmann tonometry, gonioscopy, pachymetry, refraction, slit-lamp and fundus examination, CH determination, SD-OCT (Heidelberg Engineering GmbH, Heidelberg, Germany) and visual field (Humphrey Field Analyzer II 750; 24-2 Swedish interactive threshold algorithm: Carl Zeiss Meditec, Dublin, California, USA).
Inclusion criteria were ocular hypertension or primary open glaucoma defined by a damage in the visual field and without treatment; elevated IOP (>21 mm Hg), clear ocular media (up to grade 3 for nuclear opalescence, nuclear colour and cortical changes and up to 2 for posterior subcapsular change in the Lens Opacities Classification System III);8 best-corrected visual acuity ≥20/40; central corneal thickness (CCT) between 520 and 580 µm, spherical refraction of −2.0 to +2 dioptres to avoid the possible relationship between axial length and CH; and cylinder correction ≤2 dioptres. The visual field was considered abnormal according to following criteria: a Glaucoma Hemifield Test outside normal limits and/or abnormal points with <5% probability of being normal, 1 with p<1% by pattern deviation.
In control group, patients included did not have any alterations in visual field and IOP was not elevated above 21 mm Hg. The age of control group was matched to the study group. The aim of the control was to rule out normal biological variability in LC position in untreated subjects in different visits.
Exclusion criteria were presence of a corneal disease or a pathology that could affect the IOP measurement and previous intraocular surgery or optic nerve diseases that could modify the result of the tests. When the image quality with Spectralis OCT (Heidelberg Engineering GmbH, Heidelberg, Germany) was not good (quality score <15), the eyes were also excluded.
CH was measured using the Ocular Response Analyzer (Reichert, Buffalo, New York, USA). This device uses an air puff to deform the cornea into slight concavity, while an optical sensor measures the deflection of the cornea. The deflection reaches a maximum peak when the cornea flattens. It happens in two occasions, when the air pressure pulse increases and when it falls. The difference between both pressures has been termed CH. In this study, we measured CH at the same patients at least twice in the same visit. If the difference between the two consecutive measurements was >2 mm Hg, a third measurement was taken and the average was calculated. The device also provides a waveform score (WS) that ranges from 0 (worse) to 10 (better). Measurements below a WS score of 5 were not used.
Optic discs were examined using Spectralis OCT at the first visit. Then we started the medical therapy with 1 drop of travoprost (Alcon Laboratories, Fort Worth, Texas, USA) every 24 hours and we repeated the examination with Spectralis OCT after 1 week of treatment. At both visits, optic disc images were obtained using the EDI technique through undilated pupils with 12 cross-sectional scans of the optic nerve (figure 1). In each B scan, we used as reference the Bruch’s membrane and a line connecting both ends of this membrane, also referred to as Bruch membrane opening diameter9 (BMO).

Cross-sectional B scans were performed with the ‘follow-up’ mode to be sure to perform the measurements in the same location.
Spectralis ‘follow-up’ mode was used to repeat the measurements in the same exact location before and after the treatment. Using the ‘follow-up’ mode, we tried to decrease the eventual misalignment during the acquisition of the images.
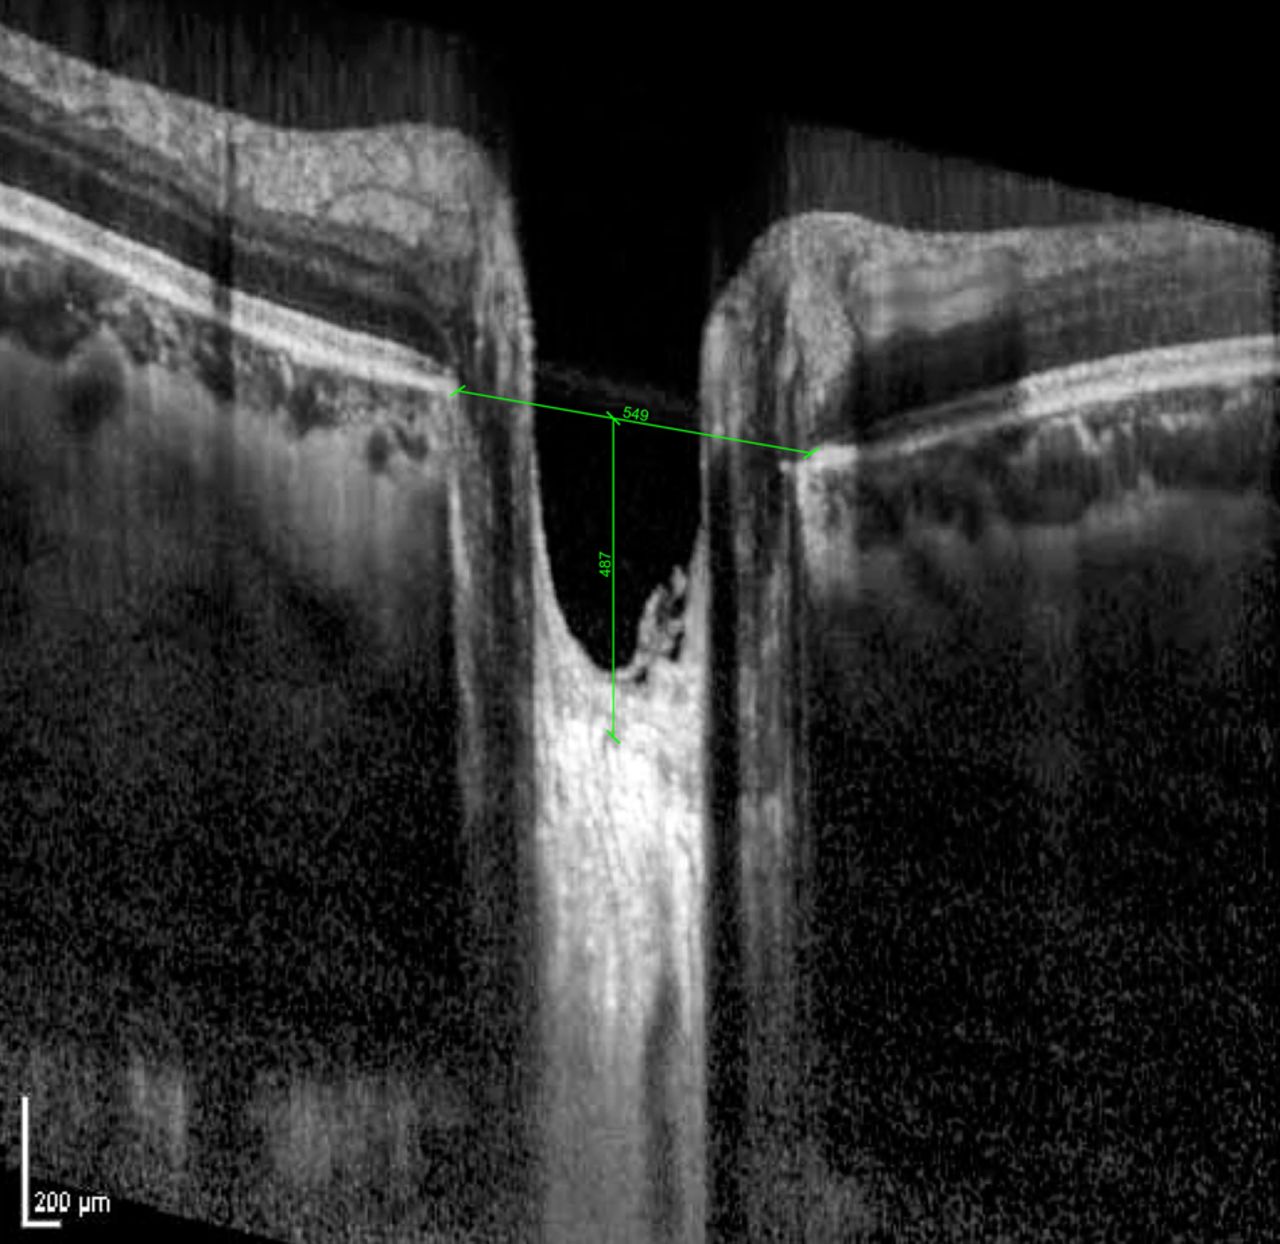
With Autocad V.12.0 software (Autodesk, San Rafael, California, USA), we compared the differences between the images before and after treatment measuring the distance from BMO to anterior LC surface (LC distance) (figure 2), the thickness of the prelaminar tissue (defined as the difference between the distance from the reference line to optic cup surface and anterior LC surface), the prelaminar tissue distance (defined as the difference from BMO to optic cup surface) and the thickness of the LC (defined as the difference between the distance from the reference line to the anterior LC surface and the posterior LC surface) . All the distances were measured on the line perpendicular to the reference line at the maximally depressed point. To confirm the results obtained with Autocad, two independent examiners used manual callipers provided by the Spectralis to measure BMO, LC distance, prelaminar tissue thickness and LC thickness. The two examiners measured independently all these parameters in the same image of 13 SD-OCT datasets, to asses reproducibility of the measuring technique. Intraclass correlation coefficient was calculated with SPSS. Mean value for each parameter of 12 scans was used for the statistical analysis.

Bruch membrane opening diameter (BMO) and distance from BMO to lamina cribrosa (LC distance).
Data analysis
Statistical analysis was performed using Kolmogorov-Smirnov tests to establish the normal distribution (p>0.05). Student's t-test was used for paired samples to compare differences before and after treatment. The independent samples test was used to compare the data between the study and control groups. Regression analysis was used to determine the factors associated with the change in the LC depth. Data were analysed using SPSS V.17.0 software (SPSS, Chicago, Illinois, USA). p<0.05 was considered significant.
Results
From the 77 patients who satisfied the inclusion criteria and were initially recruited, 16 were excluded because we were not able to visualise correctly the LC. Of the 61 patients, 36 were men and 25 were women. The mean age was 59.8±21.3 years, the mean refractive error (spherical equivalent) was 1.07±0.59 and the visual field mean deviation was −6.25 dB±3.32). Mean CCT was 532±43 µm.
Thirty-eight patients without glaucoma or ocular hypertension were included as control group. We excluded nine patients because of the uncorrected visualisation of LC. The mean age was 48.25±17.8 years, the mean refractive error was 1.15±0.45 and the visual field mean deviation was –2.35±2.65 dB. Mean CCT was 539±29 µm. IOP in the control group was 18.25±4.5 mm Hg and after 1 week (without treatment) was 19.15±5.1 mm Hg.
No significant differences were found between both groups except for visual field mean deviation (p<0.001) and IOP (p<0.001). The interobserver intraclass correlation coefficients for the measurement of LC distance, LC thickness, prelaminar tissue thickness, prelaminar tissue distance and BMO were 0.927, 0.947, 0.948, 0.895 and 0.977, respectively.
The parameters measured before and after treatment are shown in table 1. A significant variation was found in both LC thickness (p<0.001) and LC distance (p=0.016). There is a significant increase of the LC thickness from 132.66±34.70 to 160.09±41.13 µm, a mean variation of 27.5 ±30.33 µm (21%). LC distance decreased from 258.81±145 to 239.86±135 µm, indicating that the LC had a significant anterior displacement of 18.95±32.91 µm (7%) after IOP lowering.
Measurements of BMO, LC thickness, LC distance, prelaminar tissue distance and prelaminar tissue thickness before and after treatment
We did not observe significant changes in BMO, prelaminar tissue thickness and prelaminar tissue distance after IOP reduction.
In the control group, there was no statistical difference in all the parameters shown in table 1 in both measurements.
We evaluated the relationship between LC thickness changes before and after the treatment and LC distance before and after the treatment (LC displacement) with different factors such as gender, age, CCT, IOP before treatment, IOP% reduction, baseline prelaminar tissue thickness, baseline prelaminar tissue distance, baseline LC thickness, baseline prelaminar tissue distance, axial length and CH. Only CH and age were significantly associated (p<0.005). We found that CH was related (R2=0.48) with the surface displacement (p=0.03) in the univariate analysis (figure 3). The lower the CH, the lower the LC displacement was. This relationship was confirmed with multivariate analysis (p=0.005). No relationship between CH and LC thickness was found. Linear regression showed a significant (R2=0.42) influence of age in LC displacement (p=0.04). The younger the patients, the greater the LC displacement was. No relationship between age and LC thickness was found. None of the other factors (gender, IOP before treatment, IOP% reduction, baseline prelaminar tissue thickness, baseline LC thickness, CCT and axial length) were associated with LC displacement or LC thickness.

Scatter plot of corneal hysteresis (CH) versus change in average lamina cribrosa (LC) displacement.
Discussion
This study demonstrates the anterior movement and thickening of the LC and that this movement is significantly related to CH.
Several studies describing changes in the optic nerve head topography have been published. They demonstrate the decrease of cup area, cup volume, cup depth, cup-to-disc ratio and even the increase of rim area after glaucoma surgery or medical treatment.1–6
Agoumi et al observed a displacement of the prelaminar tissue after acute IOP elevation. However, LC movement was insignificant. Lee et al observed an anterior movement of both prelaminar tissue and LC due to IOP reduction after trabeculectomy. Lee et al7 proposed that the difference between both studies lied in the methodology.10 Agoumi et al increased the IOP during a short period of time (2 min), and this elevation was lower than the IOP decrease observed by Lee et al in their study after trabeculectomy (mean IOP was 12.4 vs 17.5 mm Hg). Most patients in the study by Agoumi et al were healthy, whereas in the study by Lee had glaucoma. Finally, Lee et al examined the decrease at 6 months after surgery, whereas Agoumi did it during elevation. Lee et al did not really know if the adaptation mechanisms for LC were the same with both increase and decrease of the IOP and if they were time dependent.
Lee et al stated in the study limitations that they did not use the Spectralis ‘follow-up’ mode. Although they obtained many scans quite close to minimise the misalignment, there was still a possibility of error in measurement. Using the ‘follow-up’ mode, we obtained two overlaid images that could be compared with Autocad program reducing the measurement error.
As reported by Lee et al, we found that because of IOP reduction there was an anterior displacement of LC and a significant thickening. However, we did not find any changes in the prelaminar tissue thickness and prelaminar tissue distance. In contrast to other previous studies, we did not observe a relationship between IOP reduction and LC movement. This could be explained by the limited IOP reduction achieved with medical treatment in our study (other studies were performed with glaucoma surgery). We did not observe a relationship between LC displacement and refraction errors.
The most relevant finding of this study is the relationship between CH and anterior displacement of the LC. So far, to our knowledge, this relationship has not been studied before. We have observed that there is a positive correlation between both factors, the greater the CH the greater the displacement. When we reduce IOP, eyes with a high hysteresis are able to recover the original position of the LC.11–15 This is not a new concept. Sigal et al16–20 studied a finite-element modelling of optic nerve head to characterise biomechanics. Under pressure, the prelaminar neural tissue and the LC displaced backwards and thinned. Curiously, the deformation of LC occurred at the centre of the cup. However, prelaminar neural tissue was displaced laterally and posteriorly, so that the maximum deformation did not occur at the centre of the cup. That could be a possible reason to explain why we did not find a significant displacement of the prelaminar neural tissue as we actually measured it in the centre of the cup. They also exposed several possible findings to consider: laminar strain is most affected by scleral compliance and the levels of strain biologically could affect cellular functions leading to glaucoma neuropathy.
Obviously we were not able to measure the scleral compliance. The relationship between CH, stiffness of the cornea, stiffness of the LC and optic nerve damage remain uncleared. Congdon et al21 observed that a low CH was a predictive factor of progression of the visual field. Cornea, optic nerve and sclera do not have a common embryological origin. However, the extracellular matrix of those structures is mostly equivalent.22–25 Woo et al26 analysed stress and strain characteristics of sections from different regions of whole human globes and found, using finite-element analysis, that the biomechanical characteristics of the anterior segment approximated that of the whole globes. Wells et al found an association between CH and optic disc surface compliance, so a floppy cornea would be associated with floppy LC and peripapillary connective tissue. If we come to terms with these hypotheses, the low CH could be related to a stiffening of the peripapillary sclera. The reduced capability of displacement and dampening effect would increase the strain in the LC and favour the glaucomatous damage.27 However, this has not been proved yet. Lee et al hypothesised in their study that thickness reversal is related to stiffness of the tissue. They found that younger eyes were associated with LC thickening, which is consistent with several experimental studies that LC is stiffer in an aged optic nerve.9 If CH could be an indicator of the stiffness of the LC and that it could be the reason of a lower displacement24 ,28 ,29 cannot be demonstrated in this study. This study demonstrates the age and that CH is related to LC displacement and should be taken into account when studying the LC behaviour in patients with glaucoma. The ability to dampen IOP fluctuations for the sclerocorneal tissue could protect eyes with glaucoma from a further damage and CH may be representative of biomechanical properties.
Our study presents some limitations. First, only one measurement was obtained after the hypotensive treatment. It would have been interesting to study what was happening while IOP was decreasing and to see if those changes kept after a longer follow-up time. Second, we relied on the well-recognised high reproducibility30 ,31 and repeatability of Spectralis OCT. Finally, we only measured the changes of LC and prelaminar tissue in a central point. It is sufficient enough to evaluate the changes in an effective way, but they could have been better characterised if we had measured them in several points along the LC.
Conclusion
We demonstrated that there is an anterior LC displacement and thickening after IOP reduction. Our study shows the most important factor related to this movement is CH and not IOP.
References
Footnotes
Contributors All the authors have contributed in planning, conduct and reporting of the work.
Competing interests None declared.
Ethics approval FISABIO Review Board.
Provenance and peer review Not commissioned; externally peer reviewed.
Linked Articles
- At a glance