Article Text

Abstract
Aims To investigate, with optical coherence tomography angiography (OCTA), short-term changes of type 1 choroidal neovascularisation (CNV), secondary to exudative age-related macular degeneration, after anti-vascular endothelial growth factor (VEGF) treatment.
Methods Patients affected by type 1 CNV treated with intravitreal anti-VEGF were consecutively enrolled. All patients underwent OCTA examination before and 48 hours after anti-VEGF treatment. Quantitative and qualitative vascular and morphological macular changes were evaluated.
Results Sixteen eyes were included (11 treated with aflibercept and 5 with ranibizumab). Both CNV mean area and pigment epithelium detachment significantly reduced (p=0.0004 and p=0.0007, respectively) after treatment. Cystoid macular oedema (four eyes) decreased in all cases. Neuroretinal detachment (13 eyes) decreased in 85% of cases (11 eyes). Fine CNV vessels density decreased in 75% (12 eyes), whereas larger CNV vessels density remained stable in 66.7% (10 eyes), choroidal flow void signal (7 eyes at baseline) increased in 42.9% (3 eyes) of them and remained stable in 57.1% (4 eyes). Interoperator reproducibility for OCT examination was good for all measurements (intraclass correlation coefficient>0.65).
Conclusion Early remodelling of type 1 CNV network after treatment may be non-invasively and reproducibly analysed by means of OCTA. Choroidal perfusion impairment, choroidal flow void signal, surrounding CNV may change during treatment.
- macula
- neovascularisation
- retina
- imaging
- treatment other
Statistics from Altmetric.com
Introduction
Optical coherence tomography angiography (OCTA) is a newly developed non-invasive imaging technique that allows en face visualisation of blood flow in retinal and choroidal anatomic slabs, so that retinal circulation can be displayed separately from the choroidal one, without any injection of exogenous dye.1 2 Many studies have been recently performed to investigate the ability of OCTA to analyse choroidal neovascularisation (CNV) features, secondary to different macular diseases, both before and after treatment.3–6 However, few studies have so far evaluated early CNV changes after intravitreal anti-vascular endothelial growth factor (VEGF) treatment.1 7
The aim of this study was to investigate by means of OCTA short-term changes of type 1 CNV secondary to exudative age-related macular degeneration (AMD) treated with anti-VEGF.
Methods
Patients
From 12 November 2016 to 24 December 2016, patients under treatment with intravitreal anti-VEGF for type 1 CNV (CNV that originates from the choroid, located under the retinal pigment epithelium (RPE) and typically associated with a RPE detachment)8 secondary to AMD were prospectively enrolled. The study, compliant with the tenets of the Declaration of Helsinki, was approved by institutional review board (IRB). Written informed consent was obtained from each patient. Inclusion criteria were: patients aged more than 50 years, affected by type 1 CNV secondary to exudative AMD in at least one eye, requiring anti-VEGF intravitreal therapy. The diagnosis of type 1 CNV had been made on the integration of fluorescein angiography and structural optical coherence tomography (OCT) (figures 1 and 2).8 Exclusion criteria were: presence of peripapillary CNV or large size CNV (whose dimensions exceeded those of a 6 mm × 6 mm macular map centred onto the fovea), presence of geographic atrophy and significant media opacity that could affect image quality. Patients with history or clinical evidence of diabetic retinopathy, myopia greater than 6 dioptres, glaucoma and other hereditary, inflammatory and/or vascular chorioretinal diseases not directly related to AMD and retinal laser treatment were excluded.

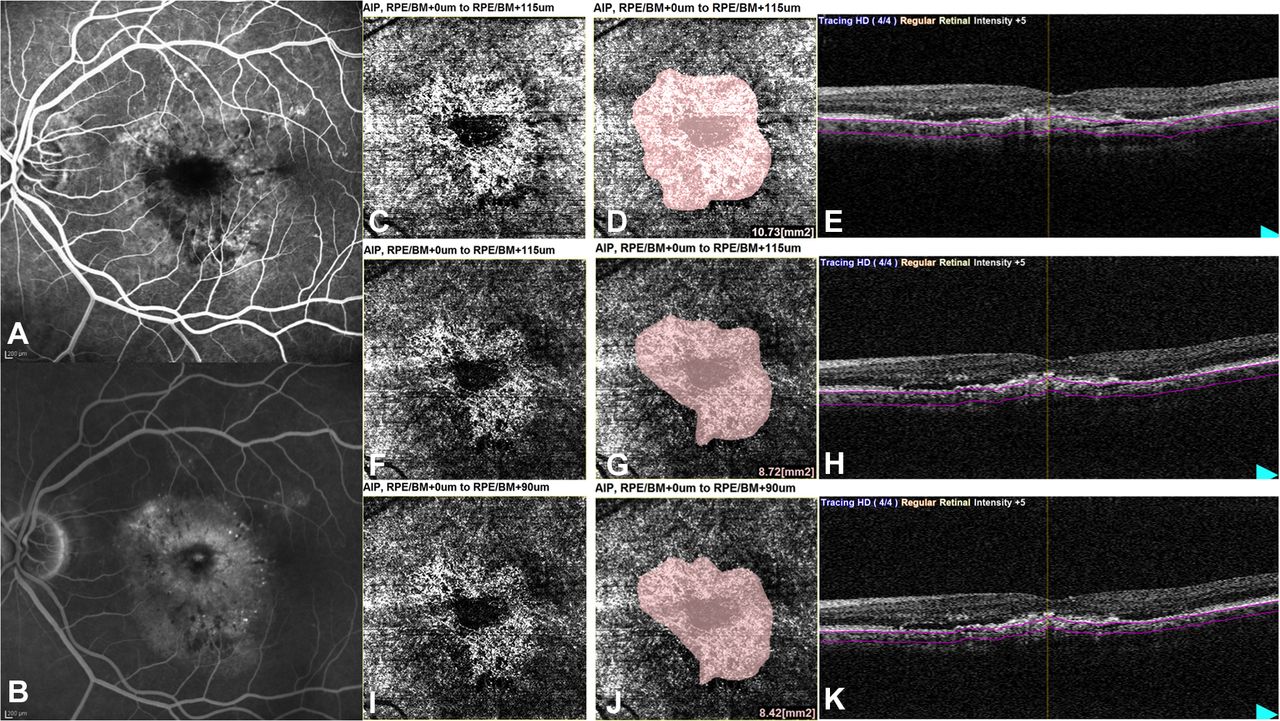
Choroidal neovascularisation mean area measured at OCTA en face image before (baseline images: C,D) and 48 hours after treatment (follow-up images: F,G,I,J). The corresponding segmented OCT B-scans (C,F,I) and early and late phases of fluorescein angiography at diagnosis (A,B) are provided. For follow-up examination, two different en face OCTA images were analysed using two different slabs: the first one (image 1: D,E) was obtained using the same baseline thickness slab independently to the eventually new location of the sclerochoroidal interface (F); the second one (image 2: G,H) was obtained rearranging the deeper segmentation line at the sclerochoroidal interface (I). BM, Bruch’s membrane boundary; RPE, retinal pigment epithelium; OCT, optical coherence tomography; OCTA, OCT angiography.

CNV network early changes at OCTA en face image and corresponding OCT B-scan in two different cases (before: C,I and E,K; after treatment: D,J and F,L). Forty-eight hours after treatment, fine CNV vessel density decreased (D,J), larger CNV vessel density increased (J) and choriocapillaris choroidal flow void signal extended (J). Early and late phases of fluorescein angiography at diagnosis (A,B and G,H) are provided for both cases. CNV, choroidal neovascularisation; OCT, optical coherence tomography; OCTA, OCT angiography.
Duration of disease, defined as the time between the first diagnosis of type 1 CNV and enrolment, and number of eventually prior anti-VEGF treatments were obtained from medical records. At enrolment, each patient underwent full ophthalmic examination including best-corrected visual acuity, slit-lamp examination, intraocular pressure, fundus examination, OCT and OCT angiography (OCTA).
OCT and OCTA examination
All enrolled eyes underwent OCT and OCTA examination 1 day before and 2 days after the scheduled intravitreal injection, when injected eyes are routinely checked for possible side effects related to the injection. OCT and OCTA were performed using the RS-3000 Advance Spectral Domain OCT device (Nidek, Gamagori, Japan). This instrument has an A-scan rate of 53 000 scans per second, using a light source centred on 880 nm, with an axial and transverse resolution of 7 and 20 µm in tissue. All examinations were performed in the early afternoon, after pupil dilation obtained with 1% tropicamide solution.
For each studied eye, two OCT scan patterns were acquired: a (retina) macula line (1024 data points, high definition (HD) 120, 12 mm in length) and a (retina) macula cube (6 mm × 6 mm) centred onto the fovea. The macula line consisted of a B-scan 180° oriented, obtained with the average of 120 repeated B-scans. The macula cube consisted in 6 mm × 6 mm macula scan centred onto the fovea, using 4 repeated B-scans, each B-scan consisting of 256 A-scans. To acquire images with higher definition, the available ultrafine mode scan was used for both scan patterns.
During follow-up examinations, both OCT scans were taken using the follow-up tracing mode, ensuring identification of previous scanned locations and allowing the evaluation of the same area.
OCT and OCTA images analysis
Neuroretinal thickness (automatically segmented by the instrument as the slab between the RPE and the Bruch’s membrane boundary (RPE/BM) and the inner limiting membrane) was measured tracing two vertical lines, at 3000 and 9000 µm along the macula line scan. To confirm accurate automated segmentation and, if necessary, to correct it, all images had been previously reviewed by two operators (EC and EL) independently from each other. In the same two positions, choroidal thickness (CT), whose upper limit was considered the automatically detected RPE/BM boundary and lower limit the manually drawn sclerochoroidal interface, was also measured. The presence of cystoid macular oedema (CME) and neuroretinal detachment (ND) at baseline and their eventual changes after treatment (increased, decreased or stable) were graded analysing the macula line scan. Central subfield thickness (CST) was calculated by the device as the average value in the central 1000 µm diameter area of the ETDRS map automatically provided by the instrument itself with the macula cube. The maximal height of the RPE detachment (PED) was measured at the macula line scan using the drawing tool provided by the device’s software.
The en face OCTA image of the CNV was obtained using a slab between a segmentation line at the upper border of the automatically segmented RPE/BM boundary and a deeper segmentation line at the sclerochoroidal interface manually identified (baseline image). For follow-up examination, two different en face OCTA images were analysed using two different slabs, in order to evaluate if possible thickness changes of both choroid or neovascular lesion could interfere with OCTA en face analysis of CNV area at follow-up. The first one (image 1) was obtained using the same baseline thickness slab independently to the eventually new location of the sclerochoroidal interface; the second one (image 2) was obtained rearranging the deeper segmentation line at the sclerochoroidal interface. CNV area was measured by manually outlining CNV borders, using the drawing tool provided by the OCTA software. The automated software provided the correspondent value in square millimetres. The measure was performed at the en face baseline OCTA image and at both follow-up images (images 1 and 2).
At the en face OCTA images, the following qualitative changes after treatment were assessed: choroidal flow void signal surrounding CNV (defined as a dark area at the level of choriocapillaris despite the absence of shadowing from RPE detachment, thickened RPE, haemorrhages, exudates or ND), density of CNV fine vessels and CNV larger vessels.3 9
Both qualitative and quantitative parameters of OCT and OCTA were independently analysed by two well-trained masked operators (ARD and FG), in a random and masked fashion both to clinical and to OCT or OCTA findings. For qualitative parameters, in case of disagreement, arbitration was given by a senior retinal specialist (EP).
Statistical analysis
The synthesis of observed parameters was performed using the usual methods of descriptive statistics: mean and SD were calculated for quantitative parameters; absolute and relative frequency (percentage) for qualitative parameters. Paired t-test was used for the evaluation of quantitative variables. Multiple regression model was used to evaluate the influence of number of previous treatments and duration of disease on each quantitative variable analysed.
Intraclass correlation coefficient (ICC) for quantitative variables and Fisher’s exact test for qualitative variables were used to evaluate the interoperator reliability at baseline.
Significant differences were accepted at p<0.05.
All statistical analyses were performed with SAS V.9.3 for Windows (SAS, Cary, North Carolina, USA).
Results
Patient characteristics
Sixteen eyes of 16 patients (9 females and 7 males) were consecutively enrolled. Eleven patients underwent treatment with aflibercept (10 were previously treated with ranibizumab), 5 with ranibizumab. The mean number of the previous intravitreal injections was 10.69 injections for patient (range, 3–24).
Quantitative analysis
CST and PED maximal height significantly decreased after treatment (from 330.25±40.09 µm at baseline to 297.50±31.54 µm after treatment, p=0.0003 and from 212.38±146.34 µm at baseline to 175.94±127.14 µm after treatment, p=0.0007, respectively) (table 1).
OCT and OCTA quantitative parameters
Neuroretinal and CT did not significantly change (p>0.05) (table 1). CNV mean area significantly decreased after treatment at both en face OCTA images (from 9.65±4.23 mm2 at baseline to 8.64±4.16 mm2 at image 1 and to 8.52±4.20 mm2 at image 2 (p=0.0004 and p<0.0001, respectively). No significant differences were found between CNV mean areas measured in image 1 and image 2 (p=0.3084) (figure 1 and table 1).
Disease duration and number of previous injections were not correlated to any quantitative measurement, neither at baseline nor at follow-up (p>0.05 for both).
Qualitative analysis
CME, present at baseline in four studied eyes, decreased in all cases. ND, present at baseline in 13 cases, decreased in 84.62% of cases (11/13). There being no differences in CNV mean areas measured in the two follow-up en face OCTA images (1 and 2), image 1 was used for the follow-up analysis of the qualitative OCTA parameters (table 2).
OCT and OCTA qualitative parameters
Fine CNV vessels density decreased in 75% (12/16) of cases, remained stable in 18.75% (3/16) and increased in 6.25% (1/16) of cases. Larger CNV vessels density, visible at baseline in 15 patients, remained stable in 66.7% (10/15), increased in 20% (3/15) and decreased in 13.3% (2/15) of cases. Choroidal flow void signal, present at baseline in 7 eyes (43.8% of cases), increased in 42.9% (3/7) and remained stable in the remaining cases (4/7, 57.1%) (table 2 and figure 2).
Interoperator reliability
The interoperator reproducibility was good for CT in the temporal measure (ICC=0.65), excellent for the other parameters (ICC>0.85) (table 3).
No statistically significant difference was found in the scores assigned by the two operators for qualitative variables (p>0.05).
Interoperator reliability
Discussion
With the advent of OCTA, choroidal vasculature can be non-invasively visualised with high resolution, allowing greater insight into choroidal vascular disorders. Using OCTA, CNV can be detected with no injection of any dye and their changes may be appreciated during follow-up.4 5 10–12
We analysed both quantitative and qualitative early changes of type 1 CNV secondary to AMD 48 hours after intravitreal anti-VEGF injection at structural OCT and OCTA. We found that CNV mean area significantly reduced at OCTA 48 hours after treatment. Furthermore, SD-OCT structural images showed a decrease in both PED maximal height and CST. An earlier reduction, at 24 hours, of type 2 CNV area at OCTA has also been recently observed in five eyes by Lumbroso et al.1 Mastropasqua et al detected no reduction of type 1 CNV area at OCTA 24 hours after aflibercept injection in 15 naïve eyes.7 Moreover, they observed no reduction of the central retinal thickness. These different findings may be explained by the too short interval after treatment.7
Qualitative analysis of OCTA images revealed, in most of our cases, a substantial decrease in the visibility of tiny choroidal branching vessels associated with persistence, in a half of the cases, of a clear hyperintense signal coming from the remaining well-perfused larger trunks. These findings underline the fact that anti-VEGF treatment reduces CNV size and precociously modifies the vascular net of type 1 CNV, 48 hours after injection. Lumbroso et al detected pruning of thinner anastomoses and loss of smaller vessels in type 2 CNV 1 day after anti-VEGF injection.1 Mastropasqua et al observed that smaller calibre vessels changed after treatment, while larger trunks remained well perfused.7 These findings seem to confirm Spaide’s theory of ‘abnormalization’ of CNV treated with recurrent intravitreous anti-VEGF injections.13 In a retrospective study, which involved 17 eyes treated with numerous injections (mean number: 47±21), Spaide described CNV lesions with prominent vascular loops, large ‘feeder’ vessels, anastomotic connections, few branch points and few capillaries within the lesions.13 According to Spaide, it is possible that, with the reduction of the level of free VEGF, due to the anti-VEGF treatment, newly growing vascular sprouts regress.13 On the contrary, vessels with adequate pericyte coverage do not.13
Areas of reduced choroidal flow around CNV lesion was present at baseline in 43.75% (7/16) of eyes. Jia et al found it in 5/5 studied eyes.14 However, information about activity and CNV classification was only partially reported. Moult et al detected that in 16 eyes with visible CNV at OCTA, severe choriocapillaris alteration surrounding active lesion was present in 87.5% of cases.15 However, they did not classify their cases according to CNV type.15 Kuehlewein et al were able to assess choroidal flow surrounding type 1 CNV in 7 of 33 eyes (21%), reporting that choroidal flow void signal was present in 4 of them. Both active and inactive CNV were included in their series.9 In the present study, we included only eyes with active type 1 CNV. This finding seems to confirm the histopathological results of areas of choriocapillaris loss beyond the area of CNV in exudative AMD, which results in RPE ischaemia, which produces VEGF.16–18
After treatment, choroidal flow void signal increased in 42.85% of eyes and remained unchanged in the others. To the best of our knowledge, perfusion changes of choroid surrounding CNV after treatment has never been previously reported. A possible explanation for the increase of choroidal flow void signal after treatment may be the induced decrease of nitric oxide (a potent vasodilator) due to anti-VEGF, causing vessel vasoconstriction and therefore choroidal hypoperfusion.19 In all cases with extension of choroidal flow void signal regression of CNV fine vessels was present too. Therefore, we cannot exclude that the reduction of the CNV net may allow better visualisation of choroidal ischaemia beneath the CNV net itself, confirming that choroidal perfusion impairment (beneath or around CNV) plays an important rule in the pathogenesis of CNV development.16–18
To measure CNV area changes, we analysed two en face OCTA images, obtained with two different slabs. Nevertheless, CNV mean area did not differ in the follow-up images. It seems that the OCTA en face image analysis is independent, within certain limits, by the choice of segmentation boundaries, at least with the device we used.
This study has some limitations. First is the small sample size. However, this was a short prospective study (less than 2 months long) in which all patients, undergoing intravitreal injection for exudative AMD, were consecutively enrolled. Second, the short follow-up period did not allow to analyse late choroidal changes.
In conclusion, OCT angiography is a promising imaging modality that allows a fast, non-invasive and reproducible method to study exudative AMD. By means of this technique, we were able to find early changes in the structure and size of type 1 CNV, independently to the duration of disease.
References
Footnotes
LF and ARD contributed equally.
Contributors EP and EM: substantial contributions to conception and design, acquisition of data or analysis and interpretation of data; drafting the article or revising it critically for important intellectual content and final approval of the version to be published. LF and ARD: substantial contributions to design, acquisition of data or analysis and interpretation of data; drafting the article or revising it critically for important intellectual content and final approval of the version to be published. EC and EL: substantial contributions to acquisition of data or analysis and interpretation of data; revising the article critically for important intellectual content and final approval of the version to be published. FG: substantial contributions to acquisition of data or analysis and interpretation of data; revising the article critically for important intellectual content and final approval of the version to be published. RP: substantial contributions drafting the article or revising it critically for important intellectual content and final approval of the version to be published. FC: statistical analysis of data and final approval of the version to be published.
Funding The research contribution by the G.B. Bietti Foundation was supported by Fondazione Roma and Ministry of Health.
Competing interests None declared.
Patient consent Obtained.
Ethics approval Institutional Review Board of Azienda sanitaria di Padova.
Provenance and peer review Not commissioned; externally peer reviewed.
Linked Articles
- At a glance