Article Text

Abstract
Purpose To compare different imaging modalities and to investigate the ability of MultiColor to evaluate geographic atrophy (GA) due to age-related macular degeneration (AMD).
Methods Twenty-two consecutive patients with GA underwent MultiColor, colour fundus photography, blue fundus autofluorescence (FAF) (excitation=488 nm; emission >500 nm), near-infrared FAF (NIR-FAF) (excitation=787 nm; emission >800 nm) and spectral-domain optical coherence tomography (SD-OCT) (Spectralis HRA+OCT; Heidelberg Engineering) imaging. Two readers independently measured the size (area) and the width of GA (on horizontal SD-OCT scan cutting the fovea), and evaluated the foveal sparing in each examination.
Results A total of 32 eyes (22 patients, mean age 79.2±8 years) with GA were included. Intragrader and intergrader agreement considering the evaluation of the size and width of GA was high for all the examinations. MultiColor and FAF showed the greatest intergrader agreement for GA area measurement (intraclass correlation (ICC)=0.990, 95% CI 0.980 to 0.995; ICC=0.998, 95% CI 0.996 to 0.999, respectively). SD-OCT showed the highest intergrader agreement of foveal involvement (k=1), followed by MultiColor and NIR-FAF (k=0.68).
Conclusions We demonstrated that several different imaging modalities currently available in clinical practice are reliable for evaluating GA due to AMD. MultiColor is an excellent tool for the measurement of GA area and width, and for the detection of foveal sparing.
- Imaging
- Retina
Statistics from Altmetric.com
Introduction
Age-related macular degeneration (AMD) is the most common cause of legal blindness among elderly individuals in developed countries.1 ,2 Geographic atrophy (GA) represents the end stages of the dry type of AMD, and its potentially poor visual consequences are similar to the late stages of the exudative type.
GA is responsible for approximately 35% of late AMD cases.3 ,4 GA is defined, in stereoscopic colour fundus photography (CFP), as any sharply demarcated area of apparent absence of retinal pigment epithelium (RPE), measuring at least 175 μm in greatest linear diameter within the macula, with typically visible choroidal vessels and no neovascularisation.5 These atrophic areas typically initially appear in the extrafoveal region (a phenomenon called foveal sparing) and progress into the fovea only late in the course of the disease.
Several different procedures are currently used in clinical practice for the evaluation of severity and progression of dry AMD. CFP, which has represented the gold standard in many epidemiological eye diseases studies,6 indeed presents limitations especially due to media opacities, low contrast between atrophic and intact retina, which makes it inaccessible to any automated or semiautomated detection algorithm, and interpatient variability of fundus pigmentation. Fundus autofluorescence (FAF) (excitation 488 nm, emission 500–700 nm) is predominantly based on the fluorescent characteristics and distribution of lipofuscin within the RPE layer. GA is characterised by a loss of FAF, because of the loss of lipofuscin contained within the altered RPE.7 Near-infrared FAF (NIR-FAF; excitation 787 nm, emission >800 nm) may derive from the degradation products of blood, lipofuscin deposits and/or melanin, a fluorophore in the RPE cells and the choroid.8–10 NIR-FAF abnormalities have been reported in dry AMD, including GA.11 Spectral domain optical coherence tomography (SD-OCT) is a non-invasive, high-resolution imaging modality capable of producing high-speed, high-resolution, high-density three-dimensional cross-sectional images covering the central macula.12 SD-OCT provides qualitative information, such as ultrastructural changes during follow-up,13 as well as quantitative parameters, such as area and volume of the studied lesions.12 ,14
Recently, the MultiColor mode has been developed for Spectralis SD-OCT (Spectralis SD-OCT; Heidelberg Engineering, Heidelberg, Germany). MultiColor images are composed of three simultaneously acquired reflective images, using three laser wavelengths with a confocal scanning laser ophthalmoscope (cSLO): blue reflectance (486 nm), green reflectance (518 nm) and infrared (IR) reflectance (815 nm).
MultiColor is increasingly gaining interest among retinal physicians, as it is possible to record en face cSLO fundus/angiographic and cross-sectional imaging by means of one single imaging device. However, so far, no studies have been published on the ability of MultiColor to evaluate GA extension. In this study, we compared different imaging modalities currently available in clinical practice, and investigated the ability of MultiColor to evaluate GA secondary to AMD.
Methods
Study population
All consecutive patients with AMD with GA, participants of a 2-year prospective controlled trial to assess the effects of rheopheresis treatment on patients with non-exudative AMD (local Ethic Committee approval: ref 2006-A00671-50), who presented at the University Eye Clinic of Creteil between January 2013 and May 2013, underwent several different macular imaging modalities on the same day. Informed consent was obtained from all patients in agreement with the Declaration of Helsinki for research involving human subjects.
Criteria for inclusion were age >55 years, presence of GA on fundus biomicroscopy (unifocal or multifocal) secondary to AMD in at least one eye defined as a lesion measuring at least 175 μm in greatest linear diameter within the macula, with visible choroidal vessels, typically associated to AMD-related phenotypic changes such as hyperpigmentations or soft drusen, with no signs of choroidal neovascularisation, intraretinal or subretinal fluid, or haemorrhage.
Exclusion criteria were, significant media opacities, myopia >6 dioptres, evidence of diabetic retinopathy or any other retinal vascular disease and signs of hereditary retinal dystrophy. Eyes with GA extending outside the arcades were excluded. Before evaluation of GA, image quality for each modality was assessed by one of the authors (GQ); when documented as ‘poor’ (low contrast between atrophic and intact retina in each imaging modality), the corresponding study eyes were excluded from the analysis.
Study protocol
All patients underwent MultiColor, CFP, FAF, NIR-FAF and SD-OCT imaging on the same day.
CFP were obtained using a high-resolution digital retinal camera (TRC-50X, Topcon, Tokyo, Japan; Nikon D2H Camera; field of view 50°×50°; image resolution 1576×1224 pixels).
For high-resolution multimodal fundus imaging, we used a combined instrument (Spectralis SD-OCT, Heidelberg Engineering) that allows for simultaneous recording of cSLO and SD-OCT images.12 By suppressing light from planes anterior and posterior to the plane of interest, cSLO image acquisition results in high-contrast fundus images. Using automated eye tracking and image alignment based on cSLO images, the software allows averaging a variable number of single images in real time (Automatic Real Time Module; Heidelberg Engineering). Individual brightness and contrast settings were optimised after image acquisition. Image brightness was improved by stretching the pixel histogram using the entire range of available pixel values (0–255).15 Image contrast was manually adjusted by subjectively maximally enhancing the visualisation of the details.15 A standardised imaging protocol was performed in all patients, which included acquisition of blue FAF (excitation λ=488 nm; emission λ>500 nm; field of view, 30°×30°; image resolution 768×768 pixels), NIR-FAF (excitation λ=787 nm; emission λ=800 nm; field of view, 30°×30°; image resolution, 768×768 pixels) and MultiColor (a recent imaging mode developed for Spectralis SD-OCT). MultiColor images are composed of three simultaneously acquired reflective images. Each of these images is acquired with a distinctive laser wavelength with cSLO: blue reflectance (486 nm), green reflectance (518 nm) and IR reflectance (815 nm). The final MultiColor image is an overlay of these three images. MultiColor images were acquired in real time and the automatic real-time averaging (up to 100 single images) was used to minimise noise. The ‘standard’ presentation mode was used for the MultiColor images. Owing to chromatic aberration, the tree images composing the MultiColor image all have a slightly different focal plane (∼0.5 to 1 dioptres between IR and blue) and, thus, depending on the focus, distinct retinal structures become more or less visible. To limit potential and important source of error, the focal plane was chosen so that the visualisation of the GA details at the posterior pole was subjectively maximally enhanced. Simultaneous SD-OCT scanning, using a second independent pair of scanning mirrors (λ=870 nm; acquisition speed, 40 000 A-scans per seconds; scan depth, 1.8 mm; digital depth resolution, approximately 3.5 μm per pixel; optical depth resolution, 7 μm; lateral optical resolution, 14 μm), was associated with cSLO imaging.
To test the ability of MultiColor to evaluate GA, we investigated the equivalence of MultiColor, CFP, FAF, NIR-FAF and SD-OCT imaging in measuring atrophic areas and detecting foveal sparing.
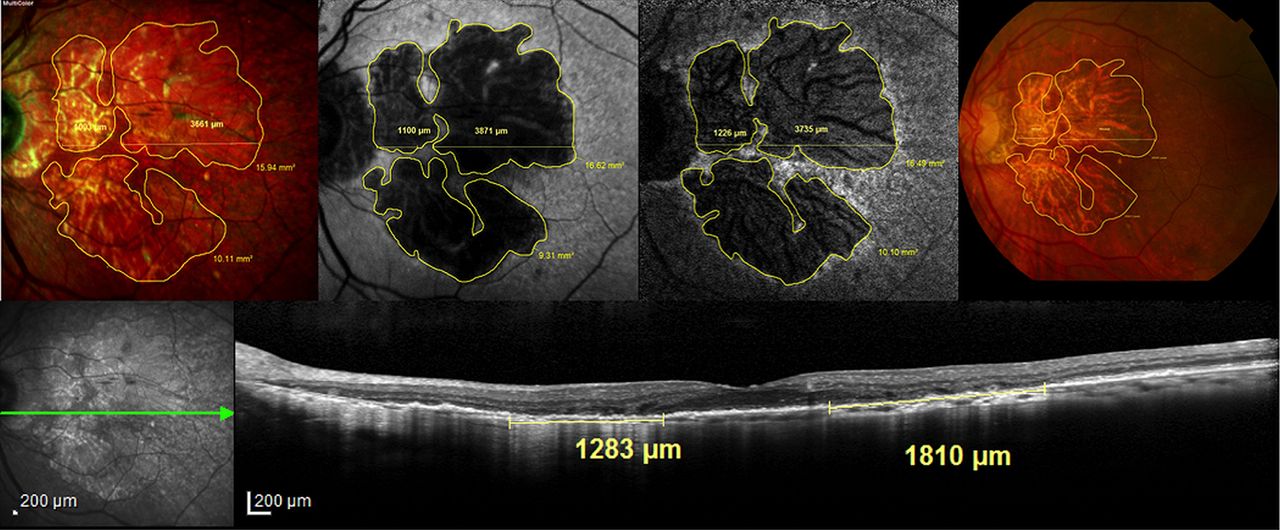
Two readers (NBM and AG) measured the total GA area and width through the fovea on the digital images using the built-in measurement software programs (IMAGEnet system; TRC-50IX, Topcon, Tokyo, Japan; Spectralis Acquisition and Viewing Modules; V.5.6.1.0, Heidelberg Engineering, Heidelberg, Germany). Each grader independently made two measurements at two different times. When grading one image, each reader was blind to all other images from the same patient. Using the computer mouse, all GA areas and width through the fovea were manually traced in CFP, FAF, NIR-FAF and Multicolor (figure 1). In CFP and MultiColor, GA was recognised as sharply demarcated areas of partial or complete depigmentation of RPE typically associated with improved visualisation of the choroidal vasculature. Areas corresponding to drusen were not included in the computation. In FAF, and NIR-FAF, GA was recognised as sharply demarcated areas of reduced autofluorescence, generally surrounded by a hyperautofluorescent outer border.

Multimodal imaging in the evaluation of geographic atrophy in the right eye of a patient with age-related macular degeneration and a foveal sparing. The geographic atrophy area and width were measured manually on MultiColor (top left panel), fundus autofluorescence (top middle left panel), near-infrared autofluorescence (top middle right panel) and on colour fundus photography (top right panel) imaging. Spectral-domain optical coherence tomography B scan passing through the fovea (bottom panel) showing the abrupt increase of choroidal signal because of the disruption and loss of photoreceptors and retinal pigment epithelium, which allows the measurement of geographic atrophy width.
The built-in measurement software programs (IMAGEnet system; TRC-50IX, Topcon; Spectralis Acquisition and Viewing Modules; V.5.6.1.0, Heidelberg Engineering) were used to calculate the area of each encircled region by automatic conversion of pixels to square millimetre (based on the magnification factors of the corresponding device). Total GA area for each image was calculated by summing all the areas of GA and subtracting demarcated areas of retinal sparing.
The two readers, at two different times, independently measured the width of GA on horizontal SD-OCT scan cutting the fovea, manually using the built-in measurement software (Spectralis Acquisition and Viewing Modules; V.5.6.1.0, Heidelberg Engineering). The GA limits were identified by choroidal signal enhancement due to RPE loss and excluding areas with foveal sparing (figure 1).
Finally, the two readers independently evaluated at two different times the presence of foveal sparing in GA on MultiColor, CFP, FAF, NIR-FAF and SD-OCT images.
For each study, the two readers also reported on an Excel sheet (Microsoft Office Excel 2010, Microsoft Corporation, Redmond, Washington, USA) the difficulties encountered while analysing GA limits and foveal sparing on MultiColor, CFP, FAF and NIR-FAF images, particularly with respect to the presence of artefacts, xanthophyl pigment or low contrast.
Statistical analysis
Statistical analysis was performed with SAS V.9.2 statistical software (SAS Institute, Inc, Cary, North Carolina, USA). Intergrader and intragrader agreements were determined using intraclass correlation (ICC) coefficient. The mean of two measurements was used for each grader. Student t test for paired data was used for means comparisons. To quantify intergrader and intragrader agreement concerning the foveal involvement, a κ coefficient was computed. A significant p value was <0.05.
Results
Population characteristics
Twenty-two consecutive patients (15 women, 7 men; mean age 79.2±8.0 years) were enrolled. Of the 32 included eyes (22 patients), 11 were right eyes and 21 were left eyes. Twelve fellow eyes of 12 enrolled patients did not meet the inclusion criteria (GA extended outside the arcades in 3 eyes; GA was absent in 4 eyes; GA was complicated by choroidal neovascularisation in 5 eyes) and thus were excluded from the analysis. Good image quality (contrast between atrophic and intact retina in each imaging modality) was documented in all patients.
GA evaluation
Intragrader and intergrader reliability between graders 1 and 2 was assessed using ICC coefficient. A value of 1.00 means perfect correlation, whereas a value of 0 means no correlation.
Table 1 shows the good intragrader agreement considering the evaluation of size and width of GA areas for MultiColor, CFP, FAF, NIR-FAF and SD-OCT images.
Intragrader agreement considering the evaluation of geographic atrophy (area and width)
Intergrader agreement considering the evaluation of size and width of GA areas was high for all imaging modalities. MultiColor and FAF showed the greatest intergrader agreement for GA area measurement (ICC=0.990, 95% CI 0.980 to 0.995; ICC=0.998, 95% CI 0.996 to 0.999, respectively). The ICC was equivalent between MultiColor, CFP and SD-OCT images in the evaluation of the width of GA on simultaneous SD-OCT scan passing through the fovea (ICC=0.933, 95% CI 0.866 to 0.967; table 2).
Intergrader agreement considering the evaluation of geographic atrophy (area and width)
The mean GA area was 12.64, 13.7, 12.35 and 13.26 mm2 on MultiColor, CFP, FAF and NIR-FAF images, respectively. There were no statistically significant differences between the different measurements (p=0.19; table 3). Difference between measurements of GA area using MultiColor and FAF or using MultiColor and NIR-FAF were close to zero for the two graders (0.29 and 0.62 mm2, respectively; table 3).
Description of geographic atrophy area (mm2) considering the different measurement methods
Measure of GA width through the fovea showed significantly higher differences for SD-OCT (ie, smaller GA width) compared with all other examinations, except MultiColor (table 4).
Description of geographic atrophy width (µm) considering the different measurement methods
The difficulties to analyse GA limits on MultiColor, CFP, FAF and NIR-FAF images are reported in table 5. These difficulties were particularly caused by the presence of imaging artefacts in the macular area misinterpreting the limits of GA, the dependence of certain images to the presence of the xanthophyl pigment that could be misinterpreted as an atrophic area, or to the presence of low contrast.
Difficulties to analyse images in each examination (GA limits, and FS) with respect to the presence of artefacts, xanthophyl pigment or low contrast
Foveal sparing evaluation
For all 32 eyes, foveal sparing by the atrophic process was independently assessed on MultiColor, CFP, FAF, NIR-FAF and SD-OCT images.
The identification of the fovea was possible for all imaging modalities with high intragrader agreement (table 6). MultiColor and NIR-FAF showed a good intergrader agreement in detecting foveal sparing in GA areas followed by CFP and FAF (table 7). SD-OCT showed the highest intergrader agreement of foveal sparing detection (k=1) followed by MultiColor and NIR-FAF (k=0.68; table 7).
Intragrader agreement considering the evaluation of foveal involvement (foveal sparing—yes/no) in patients with geographic atrophy
Intergrader agreement considering the evaluation of foveal involvement (foveal sparing—yes/no) in patients with geographic atrophy
The difficulties encountered while analysing foveal sparing on MultiColor, CFP, FAF and NIR-FAF images, particularly with respect to the presence of artefacts, xanthophyl pigment or low contrast, are reported in table 5.
Discussion
In this study, we compared several different imaging modalities currently available in clinical practice, and investigated the ability of MultiColor to evaluate GA secondary to AMD. The intragrader and intergrader agreement considering the evaluation of the size and width of the GA area was high for all the examinations. Similar to previous studies comparing CFP and FAF,16 NIR-FAF and FAF,11 or even simultaneous FAF, NIR-FAF and SD-OCT,14 we found a high intergrader and intragrader agreement in the evaluation of GA due to AMD (size and width) for several different imaging modalities.
In the current clinical practice, for obvious practical reasons, an increasing number of retinal physicians prefer using MultiColor over CFP, as this makes it possible to record different aspects of macular lesions (en face cSLO fundus/angiographic and cross-sectional imaging) using one single imaging device. To the best of our knowledge, no published study has evaluated the reliability of MultiColor for measuring GA size and width. The current analysis demonstrates a high intragrader and intergrader agreement for GA area measurement by MultiColor. Moreover, SD-OCT showed the highest intergrader and intragrader agreement in identification of foveal sparing, followed by MultiColor and NIR-FAF. The excellent ability of SD-OCT to detect foveal sparing was reported in previous studies.14 ,15 ,17 Forte et al14 investigated the ability of cSLO and SD-OCT in evaluating the foveal sparing in GA due to AMD. They found that SD-OCT showed the highest certainty and intergrader agreement in identification of foveal sparing, followed by NIR-FAF and FAF. Schmitz-Valckenberg et al15 reported that SD-OCT imaging provides greater insights into the retinal alterations of atrophy lesions in patients with GA than en face imaging such as FAF or CFP. Sayegh et al17 evaluated the ability of SD-OCT in providing reliable and reproducible parameters for grading GA compared with FAF. They reported that the lesion size is precisely determinable by SD-OCT, and foveal involvement is more accurate by SD-OCT than by FAF. Wolf-Schnurrbusch et al18 analysed the differences in image quality, FAF patterns and lesion size, when using conventional blue-light (488 nm) and green-light (514 nm) FAF. They reported that the green-light FAF images are superior for the accurate analysis of small, central, pathological changes and for the determination of the central GA lesion size. They found that using only blue-light FAF could lead to an overestimation of the size of atrophic patches and the centre involvement, because it suggests the presence of atrophy in the fovea. This seems in disagreement with our measurements of GA, as we found the mean area to be smaller on blue FAF as compared to on the other imaging modalities. However, a comparison between the two studies is not possible because different imaging modalities have been investigated. Moreover, the differences recorded may be related to a different proportion and entity of foveal sparing between the two studies.
Differences between measurements of GA width were significantly higher for SD-OCT compared to all the other examinations, except MultiColor. However, both SD-OCT and MultiColor showed a smaller GA width as compared to the other imaging modalities. These findings seem in disagreement with those reported by Schmitz-Valckenberg et al,15 which showed a good agreement in the measurements of GA width between FAF and SD-OCT (choroidal signal enhancement). However, while Schmitz-Valckenberg et al15 used Pearson's correlation, in the current study we used ICC to investigate the agreement in the measurements of GA width between FAF and SD-OCT; therefore, despite both studies having included eyes with a foveal sparing, a comparison between the two values is not possible.
FAF is commonly used to assess and follow patients with GA secondary to AMD and has shown to detect metabolic changes and loss of RPE integrity that correspond to visual function impairment in patients with AMD.19 ,20 In agreement with previous studies,13–17 in the current study FAF (and MultiColor) showed the greatest intergrader agreement for GA area measurement. The greatest intergrader agreement could be explained, at least in part, by less difficulty in analysing images of FAF and MultiColor (table 5), particularly with respect to contrast.16
Limitations of this study are mainly related to the low number of eyes included. Moreover, we cannot exclude that artefacts related to comparison between images obtained with different cameras (such as different recording angles by head movement or placing the patient in front of another device) may have influenced the measured size of the GA area. However, given the good intragrader and intergrader agreement, the results of the current analysis should be considered as reliable and meaningful. Another limitation is due to chromatic aberration by the three images composing the MultiColor image, as all have a slightly different focus plane: depending weather one focuses on the blue or on the IR image (∼0.5–1 dioptres between IR and blue) distinct retinal structures become more or less visible. To limit this potential and important source of error, the focus plane was chosen so that the visualisation of the GA details at the posterior pole was subjectively maximally enhanced. Finally, as visibility of the GA in MultiColor images seems to be mainly due to the IR component of the image, further studies will evaluate whether the MultiColor mode has any advantage compared with the IR mode alone.
In conclusion, we demonstrated that several different imaging modalities currently available in clinical practice are reliable for evaluating GA. MultiColor is an excellent tool for the measurement of GA area and width, and for the detection of foveal sparing.
References
Footnotes
-
Contributors GQ and EHS were involved in design and conduct of the study, management, analysis, interpretation of the data, review and approval of the manuscript; NBM, AG and VC in collection; and NBM and GQ in preparation of the manuscript.
-
Competing interests None.
-
Ethics approval Local Ethic Committee approval: ref 2006-A00671-50.
-
Provenance and peer review Not commissioned; externally peer reviewed.
Linked Articles
- At a glance