Article Text

Abstract
Aim To evaluate corneal elevation, pachymetry and keratometry in keratoconic eyes according to the clinical stage of the disease.
Methods This prospective comparative study was performed on one hundred and twenty-six eyes of 83 patients who had keratoconus, and 42 normal eyes of 42 age-matched subjects. Corneal elevation, pachymetry and keratometry were measured using a rotating Scheimpflug camera (Pentacam HR, Oculus) in these eyes. The area under the receiver operating characteristic (AUROC) curves was used to analyse the diagnostic significance of these parameters, with respect to each stage of Amsler-Krumeich classifications. AUROC was calculated to describe the predictive accuracy of the different indices and to determine the cut-off points where sensitivity and specificity were maximised.
Results Posterior (0.980) and anterior (0.977) elevation differences showed the highest AUROCs, followed by dioptres (D) value (0.941), percentage thickness increase (PTI) 2 mm (0.931), PTI 4 mm (0.927), progression index (0.927), minimal pachymetry (0.923), average keratometry (0.914), anterior elevation (0.909), PTI 6 mm (0.906), posterior elevation (0.898), central pachymetry (0.889), PTI 8 mm (0.870), PTI 10 mm (0.864), corneal thickness spatial profile 2 mm (0.835) and cylinder (0.796). The differences in AUROC curves between anterior and posterior elevation difference measurements and other diagnostic parameters tended to be larger at the earlier stages of keratoconus.
Conclusions Anterior and posterior corneal surface height data obtained by enhanced ectasia display, effectively discriminates keratoconus from normal corneas. Elevation difference measurements may provide useful information for improving the diagnostic accuracy of keratoconus, especially in the early stage of the disease.
- Cornea
Statistics from Altmetric.com
Introduction
Keratoconus is a progressive non-inflammatory disorder characterised by ectasia and thinning of the cornea. The progressive thinning and subsequent anterior protrusion of the cornea can result in severe myopic astigmatism and asymmetrical irregular astigmatism, leading to distorted vision. Placido disk-based corneal topography and biomicroscopic examination are widely used in the clinical diagnosis of keratoconus. Although Placido disk-based corneal topography is a highly sensitive and specific diagnostic tool, it only examines the anterior surface of the cornea and does not evaluate the curvature and elevation of the posterior corneal surface, which is considered to be significant in early-stage keratoconus detection. Moreover, alteration of the reference point or of the viewing angle using this instrument may lead to inaccuracy in measurements of curvature. With the advent of rotating Scheimpflug imaging and slit-scanning topography, anterior and posterior elevation measurements as well as curvature measurements have become available in the clinical setting. With the height data, anterior protrusion and corneal shape parameter changes can be assessed, since they are different from curvature map assessments of relative distortions of the cornea, and can provide useful diagnostic information for the detection of keratoconus.1–5
Although the clinical diagnosis of moderate to advanced keratoconus is not very problematic due to the characteristic topographical pattern and the typical clinical signs, the clinical diagnosis of early keratoconus in patients with normal best spectacle-corrected visual acuity and no clinical symptoms can still be challenging. Actually, keratoconus has been diagnosed in as many as 6.4% to 9.6% of refractive surgery candidates,6 ,7 indicating that more patients with keratoconus seek refractive surgical procedures than we expected. This identification of keratoconus is especially important in the preoperative screening of the candidates for refractive corneal surgeries, since keratorefractive surgical procedures for patients with keratoconus may cause iatrogenic keratectasia and unpredictable refractive outcomes after surgery. In addition to biomicroscopy and curvature mapping using Placido disk-based corneal topography, ophthalmologists have used average keratometry, corneal thickness and corneal higher-order aberrations as effective indices to assist in the diagnosis of keratoconus.8–17 However, anterior and posterior corneal elevation, especially using an enhanced ectasia display, has so far not been fully accepted as an aid in the diagnosis of keratoconus. Moreover, there have been only a few studies of these height parameters in a large cohort of patients with keratoconus with respect to each clinical stage of the disease. The purpose of the present study is to prospectively determine the efficacy of corneal elevation, pachymetry and keratometry in discriminating between normal and keratoconic eyes with respect to the stage of the Amsler-Krumeich classification.
Patients and methods
One hundred and twenty-six eyes of 83 patients with keratoconus (90 male and 36 female eyes, mean age: 37.6±12.3 years) and 42 normal eyes of 42 subjects (25 male and 17 female eyes, mean age: 37.9±10.2 years) were examined in this study. Diagnosis of keratoconus was established by the Amsler-Krumeich classification, based on astigmatism, corneal power, corneal transparency and corneal thickness, obtained using a rotating Scheimpflug imaging instrument (Pentacam HR, Oculus, Wetzlar, Germany) and slit-lamp biomicroscopy (table 1).18 The study group was divided into four subgroups; Grade 1 (36 eyes), Grade 2 (34 eyes), Grade 3 (19 eyes) and Grade 4 (37 eyes) keratoconus groups, according to this classification. The control group consisted of subjects with normal corneal and ocular findings applying for a contact lens fitting or a refractive surgery consultation. The control subjects were age matched and had a refractive error (spherical equivalent) of less than 6 dioptres (D) and/or astigmatism of less than 3 D. The patients who wore rigid contact lenses were asked to stop using them for 3 weeks, and the use of soft contact lenses was stopped for at least 1 week before this assessment.
Clinical classification of keratoconus by stage
All diagnostic elevation, pachymetry and keratometry parameters were determined with the rotating Scheimpflug imaging instrument (Pentacam HR, software V.1.15) by three experienced examiners, who were masked to the clinical condition of the subjects. The readings were taken as recommended in the instruction manual of the instrument. In brief, the patient's chin was placed on the chin rest and the forehead against the forehead strap. The patient was asked to open both eyes and stare at the fixation target on the black background in the centre of the blue fixation beam. After attaining perfect alignment, the instrument automatically took 25 Scheimpflug images within 2 s. Image quality was checked, and for each eye only one examination with a high quality factor was recorded. The following parameters were obtained with this instrument: the mean keratometric readings along the flattest (K1) and steepest (K2) meridians, corneal astigmatism (cylinder), corneal thickness at the centre (central pachymetry) and at the thinnest point of the cornea (minimal pachymetry), local elevation (anterior elevation, anterior elevation difference, posterior elevation and posterior difference elevation) values, corneal thickness spatial profile (CTSP), percentage thickness increase (PTI), progression index and D value. For height data measurement, the best-fit-sphere (BFS) served as a reference body using the float option and the automatic diameter setting. The diameter of the reference surface was 8 mm. Corneal elevation maps show the difference in height between the cornea and the reference body. Corneal elevation values were determined by using a conventional BFS as the reference surface, and corneal elevation difference values were taken as the differential changes in corneal elevation between the BFS and the enhanced BFS (with exclusion of a 3.5-mm optical zone in the thinnest portion of the cornea) obtained with the Belin/Ambrỏsio enhanced ectasia display software (V.3). All these elevation data were read as the maximum values above the BFS in the central 5 mm of the cornea, which in patients with keratoconus was located in each case at the site of the thinnest point of the cornea. The Belin/Ambrỏsio enhanced ectasia display also contains a comprehensive pachymetric evaluation. Pachymetric values at the apex and thinnest points are displayed and the displacement of the thinnest point from the corneal apex is calculated along with the direction of the displacement. Graphical representations of the progressive thickening of the cornea from the thinnest point to the periphery are depicted in the CTSP. The PTI refers to the percentage of increase from the thinnest point to the periphery. The averages of the pachymetric values at 22 concentric rings (2, 4, 6, 8, and 10 mm in diameter) were calculated to create the CTSP centered on the thinnest point. The progression index is calculated as the progression value (average) at the different rings, referenced to the mean curve. The display also contains five new terms (D values for SD from the mean) representing the front surface (Df), back surface (Db), pachymetric progression (Dp), thinnest point (Dt) and thinnest point displacement (Dy). The D is the final overall map reading taking each of the five parameters into account. Each individual parameter D and the final D value have been normalised to their mean value and are reported as SDs from the mean.
Receiver operating characteristic (ROC) curves were produced from measurements of the eyes of patients with keratoconus and normal subjects, and analysed for the diagnostic significance of these parameters with respect to each clinical stage of the Amsler-Krumeich classification. These curves are obtained by plotting sensitivity against 1−specificity, calculated for each value observed. The area under the ROC curve (AUROC) was calculated in order to describe the predictive accuracy of the different indices and to determine the optimised cut-off points that maximised sensitivity and specificity in distinguishing keratoconus from a normal cornea. An AUROC value between 0.7 and 0.8 is considered ‘acceptable’, and between 0.8 and 0.9 ‘excellent’ discrimination. An area of 100% implies that the test perfectly distinguishes keratoconus from normal corneas. The best cut-off point known to be closest to the upper left-hand corner of the ROC curve was determined where the test characteristics were maximised.
All statistical analyses were performed using JMP Pro software V.10.0 (SAS, Cary, North Carolina, USA). The Mann-Whitney U test was used to compare the data between the two groups. The results are expressed as mean±SD, and a value of p<0.05 was considered statistically significant.
Results
The demographics of the study population are shown in table 2. We found no significant differences in terms of age (p=0.53, Mann-Whitney U test), gender (p=0.15) or CTSP (6–10 mm)(p=0.60 for 6 mm, p=0.43 for 8 mm and p=0.62 for 10 mm), but significant differences were seen in other diagnostic parameters (p<0.001) such as mean keratometry, cylinder, central and minimal pachymetry, anterior and posterior elevation, CTSP (2–4 mm), PTI (2–10 mm), progression index and D value, between the keratoconic and control groups.
Patient demographics of the study population
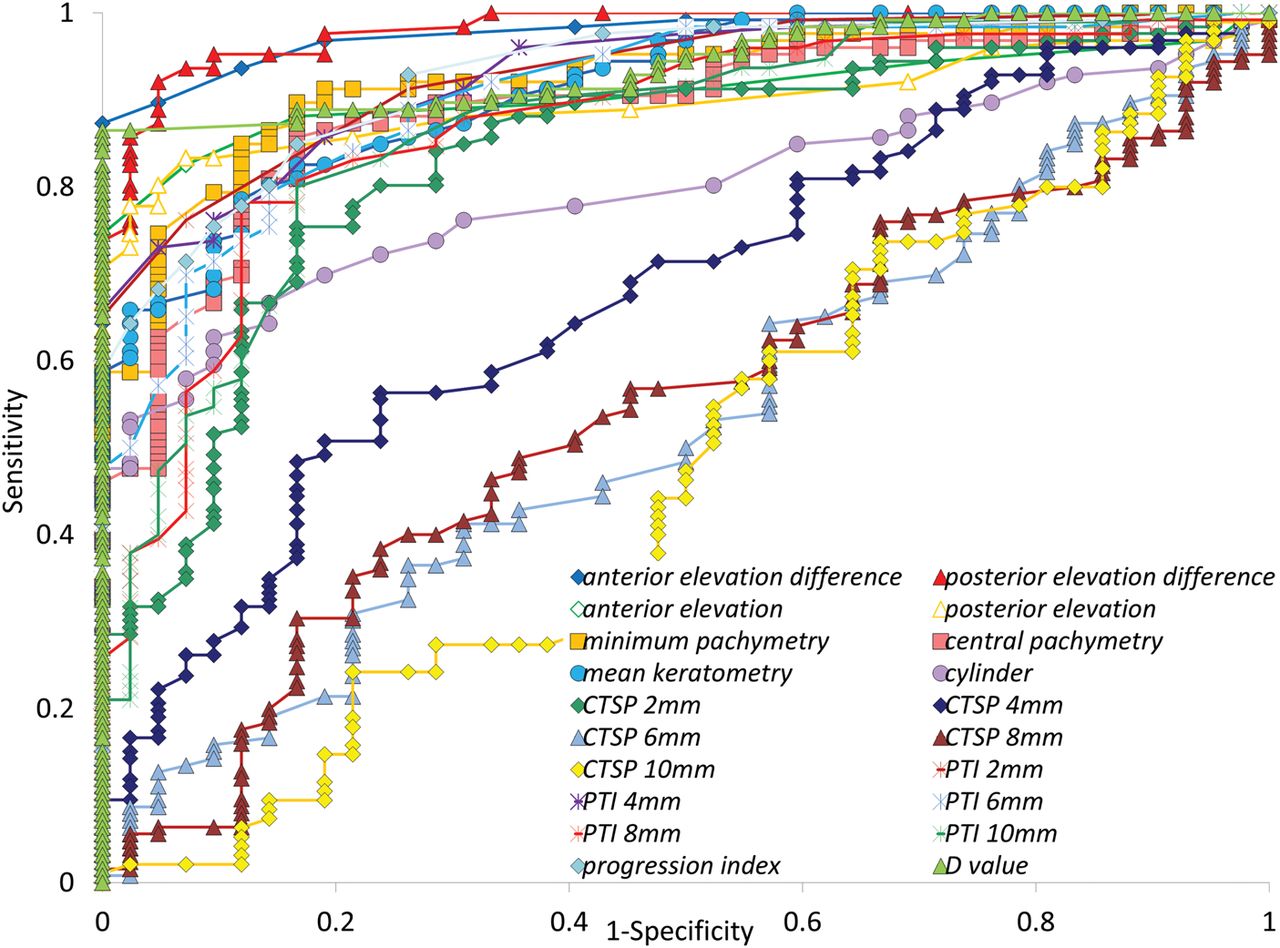
The ROC curve analysis for each parameter in the entire population is shown in figure 1. Posterior (0.980) and anterior (0.977) elevation differences show the highest AUROCs, followed by D value (0.941), PTI 2 mm (0.931), PTI 4 mm (0.927), progression index (0.927), minimal pachymetry (0.923), average keratometry (0.914), anterior elevation (0.909), PTI 6 mm (0.906), posterior elevation (0.898), central pachymetry (0.889), PTI 8 mm (0.870), PTI 10 mm (0.864), CTSP 2 mm (0.835), cylinder (0.796) and CTSP 4–10 mm (0.527 to 0.679). We found no significant differences in the AUROCs of anterior and posterior elevation differences (p=0.75). The AUROC of posterior elevation difference was significantly higher than that of D value (p=0.02), PTI 2 mm (p=0.002), PTI 4 mm (p=0.003), progression index (p=0.003), minimal pachymetry (p=0.008), average keratometry (p=0.003), anterior elevation (p=0.002), PTI 6 mm (p=0.002), posterior elevation (p<0.001), central pachymetry (p<0.001), PTI 8 mm (p<0.001), PTI 10 mm (p<0.001), CTSP 2–10 mm (p<0.001) and cylinder (p<0.001). The AUROC of anterior elevation difference was also significantly higher than that of D value (p=0.04), PTI 2 mm (p=0.02), PTI 4 mm (p=0.02), progression index (p=0.02), minimal pachymetry (p=0.01), average keratometry (p=0.005), anterior elevation (p=0.001), PTI 6 mm (p=0.001), posterior elevation (p<0.001), central pachymetry (p<0.001), PTI 8 mm (p<0.001), PTI 10 mm (p<0.001), CTSP 2–10 mm (p<0.001) and cylinder (p<0.001). The sensitivity and specificity identified by the cut-off points of all diagnostic parameters are also shown in table 3. A posterior elevation difference cut-off value of 14 μm had a sensitivity of 92.1% and a specificity of 95.2%, while the sensitivity and specificity of an anterior elevation difference cut-off value of 6 μm were 89.7% and 95.2%, respectively, in the process of distinguishing between keratoconus and normal eyes.
Receiver operating characteristic curve analysis for each diagnostic parameter with respect to each stage of the Amsler-Krumeich classification

Receiver operating characteristic curves show the sensitivity and specificity of all diagnostic parameters. Data points in the upper left portion of the graph represent higher sensitivity and specificity. Area under the curve as close to 1 is better in diagnostic ability. CTSP, corneal thickness spatial profile; D, dioptres; PTI, percentage thickness increase.
In the subgroup analyses, the ROC curve analysis for each parameter with respect to each stage of the Amsler-Krumeich classification can also be seen in table 2. The ROC curve analysis showed that the anterior and posterior elevation difference measurements were greater in the AUROC than other elevation, pachymetry and keratometry measurements, suggesting that the elevation differences were the best diagnostic parameters for distinguishing between keratoconus and normal corneas in the study population. Moreover, the differences in the AUROC between the elevation differences and other diagnostic measurements tended to be larger, the earlier the stage of keratoconus.
Discussion
In the present study, our results demonstrated that corneal height information, especially when an enhanced ectasia display is used, provides a potential index for distinguishing between keratoconus and normal corneas. The ROC curve analysis showed that the predictive accuracy of various elevation, pachymetry and keratometry indices was overall high, but that posterior and anterior elevation differences were the most effective parameters for the diagnosis of keratoconus. A posterior elevation difference cut-off value of 14 μm showed a 92.1% sensitivity and a 95.2% specificity in distinguishing between keratoconus and normal eyes. An anterior elevation difference cut-off value of 6 μm showed a sensitivity of 89.7% and a specificity of 95.2%. These sensitivity and specificity values are comparable with those obtained with other topographical indices derived from Placido disk-based videokeratography,8 ,11 ,13 ,19 suggesting the clinical significance of enhanced ectasia display. Although the Placido disk-based corneal topography is known to be a highly sensitive and specific diagnostic tool for keratoconus, the combination of the curvature map and the height data may hold promise for the improvement of diagnostic accuracy.
It is remarkable that early-stage keratoconus demonstrated a more significant value for the diagnosis of the anterior and posterior elevation differences than other elevation, pachymetry and keratometric measurements, in terms of the AUROC, and that later Amsler-Krumeich stages showed increasingly less differences in the AUROC between the elevation differences and other diagnostic values. These findings imply that these elevation differences obtained by enhanced ectasia display are the most effective diagnostic parameters even for the detection of early keratoconus for clinical use. We believe that this information will be clinically meaningful since the precise preoperative diagnosis of early keratoconus is still difficult in daily practice.
There have been several previous studies on corneal elevation using conventional BFS in keratoconic and normal eyes.3 ,4 ,20 ,21 Sanctis et al also reported the high overall predictive accuracy of posterior elevation, which was measured as the maximum value above the BFS in the central 5 mm of the cornea, for keratoconus (AUROC 0.99) and subclinical keratoconus (0.93).3 Miháltz et al4 showed the best predictive accuracy for posterior (AUROC 0.97) and anterior elevation (0.96), followed by minimal (0.89) and central pachymetry (0.88), but the corneal elevation difference values were not assessed in their study. Piñero et al reported that the anterior and posterior BFS values were strongly correlated in the control and subclinical groups, but that the correlation was weaker in the two clinical keratoconus groups.20 Falavarjani et al stated that the mean interocular difference was 2.17 μm for maximum anterior elevation, and 3.62 μm for maximum posterior elevation in the normal population.21 We previously reported that corneal elevation differences were significantly correlated with the keratoconus severity index, suggesting that corneal height information was also useful for indicating keratoconus severity.5 However, diagnosis of keratoconus suspect or forme fruste keratoconus is critical, especially in refractive surgery screenings, because proper preoperative recognition of such patients can eliminate the possible risk of iatrogenic ectasia after keratorefractive surgery. A new study to investigate the efficacy of these parameters in distinguishing such eyes from normal eyes is currently being conducted.
The anterior and posterior elevation differences values were available in the Belin/Ambrỏsio enhanced ectasia display software for the Pentacam proposed by Belin et al.22 This software device is beneficial in the visualisation of any anterior protrusion of the thinned cornea. Although the enhanced BFS is not substantially different from the conventional BFS in normal eyes, the former value in eyes with keratoconus is more distinct and higher in elevation in the area corresponding to the protruding portion of the cornea. Although enhanced BFS shows little elevation difference in normal corneas, it marked an elevation difference in keratoconus, making possible early detection of this disorder. Anterior and posterior corneal elevation differences determined with enhanced BFS may provide more accurate diagnostic information for keratoconus than the amounts of anterior and posterior corneal elevation themselves determined with conventional BFS. Indeed, as table 2 shows, we demonstrated that the AUROCs in the anterior and posterior elevation differences were greater than those in the anterior and posterior elevations themselves in each clinical stage of keratoconus. Corneal elevation analysis using enhanced BFS may increase the sensitivity and specificity of the disease, in particular in the corneal periphery, possibly because the amount of elevation using conventional BFS is more likely to be influenced by astigmatism, which causes difficulty in setting a stable cut-off point for defining keratoconus. Corneal elevation differences evaluate not a limited corneal area, but the whole cornea, and thus can provide diagnostic information for the disorder.
In conclusion, according to our experience, the measurements of anterior and posterior elevation differences were effective indices in aiding with the diagnosis of patients with keratoconus, and that this advantage over other measurements was marked, especially in the detection of the disease in its early stages. Corneal height data measurements obtained by enhanced ectasia display may provide useful information for improving the accuracy of keratoconus diagnosis in a clinical setting.
References
Footnotes
-
Contributors The authors were involved in the design and conduct of the study (KK, KS, RI); collection, management, analysis and interpretation of data (KK, RI, AI); and preparation, review and approval of the manuscript (KK, KS, AI).
-
Funding None.
-
Competing interests None.
-
Patient consent Obtained.
-
Ethics approval Institutional Review Board at Kitasato University School of Medicine.
-
Provenance and peer review Not commissioned; externally peer reviewed.