Article Text

Abstract
Aim: To evaluate the use of preoperative optical coherence tomography (OCT) findings as predictive factors for macular hole (MH) surgery outcomes.
Methods: 46 eyes from 46 patients with a diagnosis of MH were included in this study. In all cases, a pars plana 25-gauge vitrectomy with peeling of the internal limiting membrane was performed. Before and after surgery, a complete clinical examination and a detailed macular analysis, which included the MH minimum and base diameter, the MH height, the Macular Hole Index (MHI), Diameter Hole Index (DHI) and Tractional Hole Index (THI), were performed. Predictive factors for visual prognosis after surgery were obtained by receiver operating characteristic curve analysis.
Results: Minimum and base diameter as well as THI and MHI correlated significantly (p<0.01, p = 0.01, p = 0.04, p = 0.03, respectively) with postoperative best spectacle corrected visual acuity at 3 months, but DHI and MH height did not. Cut-off values of 311 µm and 1.41 were obtained for the minimum diameter and THI, respectively, from receiver operating characteristic curve analysis, providing an acceptable sensitivity and specificity.
Conclusion: An MH minimum diameter of <311 µm or a THI >1.41 are predictive factors for a good visual prognosis after MH surgery.
Statistics from Altmetric.com
An idiopathic full-thickness macular hole (MH) affects approximately three in 1000 people, resulting in variable reduction in central vision.1 Our understanding of the relationship between the posterior vitreous cortex and the macular area has been greatly enhanced by optical coherence tomography (OCT).2 3 OCT has helped to establish the role of anteroposterior4 5 and tangential forces caused by contraction of the internal limiting membrane (ILM) in MH development, although the exact pathogenesis has not been determined.6
These findings have led to the present surgical procedures for MH, consisting of pars plana vitrectomy with ILM peeling. Removal of the ILM was introduced as an additional surgical step.7 8 It has been proved that surgical success is more common after ILM removal,9 but the prediction of postoperative visual function is difficult because the repair process is not fully understood.10 11
Some authors have studied the possible correlation between preoperative OCT findings and anatomical12 and functional13–15 outcomes after MH surgery. In addition, Villate et al16 have studied the correlation with postoperative OCT findings.
The objective of our study was to evaluate the use of preoperative OCT findings as predictive factors for MH surgery outcomes.
PATIENTS AND METHODS
We performed a retrospective case series study of 46 eyes from 46 patients with a diagnosis of MH grade 2 (11 eyes), 3 (22 eyes) and 4 (13 eyes) and operated on at the Alicante Institute of Ophthalmology by one surgeon (JMR-M) with at least 3 months of follow-up. Cases were recruited from June 2002 until December 2006. All MHs were primary. The only exclusion criterion was lack of accuracy in the OCT analysis. It was considered to be accurate when all six scans were correctly centred in the MH. The nature of the procedure had been explained to the patients before surgery, and written consent was obtained. Data gathering was approved by the local ethics committee. The procedures were performed in accordance with the ethics standards of the Helsinki Declaration of 1975, as revised in 1983.
A three-port pars plana 25-gauge vitrectomy under peribulbar anaesthesia was carried out. Detachment of the posterior hyaloid was induced by suction, with the vitrectomy probe around the optic disc if necessary and epiretinal membranes were removed if present. ILM peeling within a circular area of about two optic disc diameters was performed after staining with indocyanine green (0.125%, 1.25 mg/ml, 1 min). Saline infusion was turned off to limit dispersion of indocyanine green during this time, and intraocular illumination was switched off to avoid phototoxicity. Finally, fluid–air and air–gas exchange with 14% perfluoropropane was performed. The face-down position was maintained for 1 week after surgery.
Before and after surgery a complete clinical examination was performed in all patients, which included an OCT macular thickness analysis with the Stratus 2 OCT (Carl Zeiss Meditec AG, Jena, Germany). The preoperative OCT analysis was performed 1–15 days before surgery. All OCT measurements were performed by two trained examiners (CS, JMR) certified to carry out this kind of measurement. Three parameters were measured with this device: minimum diameter of the MH, diameter of the MH at the level of the retinal pigment epithelium (MH base diameter), and distance from the retinal pigment epithelium to the innermost aspect of the MH (MH height). We calculated the Macular Hole Index (MHI) as described by Kusuhara et al14 (defined as the ratio of the MH height to the diameter of the base) and two new indexes defined by us: Diameter Hole Index (DHI) and Tractional Hole Index (THI). The DHI was defined as the ratio of the minimum diameter of the MH to the base diameter. The THI was defined as the ratio of the maximal height to the minimum diameter of the MH (fig 1). OCT morphological analyses were performed to examine the appearance of cystic changes in the MH. We determined how they correlated with postoperative functional results.

Statistical analysis of the data was performed using the software SPSS V11.0 for Windows (SPSS, Chicago, Illinois, USA), except the ROC curve analysis. Non-parametric statistics were carried out, because normality of the data distributions could not be assumed (Kolmogorov–Smirnov test). The Wilcoxon rank sum test was used to analyse comparisons between preoperative and postoperative measurements.
The Spearman coefficient was calculated to assess correlations between the best spectacle corrected visual acuity (BSCVA) at 3 months after surgery and the parameters that define the geometry of the MH. In addition, linear regression analysis was performed to obtain a linear model defining the relation between the significantly correlated parameters.
Finally, a receiver operating characteristic (ROC) curve analysis was performed to obtain critical values (cut-off values) allowing the prediction of the visual prognosis. Specifically, we tried to obtain the critical or cut-off value of the minimum diameter, base diameter, MHI and THI (parameters that correlated significantly with BSCVA at 3 months) for the prediction of a good visual result after treatment. These cut-off values corresponded to the points of the curve associated with the highest accuracy (minimum false negative and positive results). “Good visual result” or “good visual prognosis” was arbitrarily defined as a gain of two or more Snellen lines of BSCVA.
The area under the ROC curve was also calculated. This parameter is a measure of the test accuracy. An area of 1 represents a perfect test, whereas an area of 0.5 represents a worthless test. The closer the curve follows the left-hand border and therefore the top border of the ROC curve space, the more accurate the test. Specifically, this means that the test is able to identify more true positives while minimising the number of false positives. All ROC curve analysis, including graphics was performed using the statistical package software MedCalc V9.3.1.0 (MedCalc Software, Mariakerke, Belgium).
RESULTS
Twenty-five of the patients were female. The mean (SD) age was 69.00 (8.33) (range 58–84). Mean (SD) follow-up was 42 (12) months (range 12–60). Thirty-two eyes (69.57%) were pseudophakic at the moment of surgery, and 14 (30.43%) were phakic. Primary successful MH closure was achieved in 96% of cases (44/46). No complications, such as retinal detachment or toxicity, were noted.
Functional results
BSCVA improved significantly from a mean (SD) value of 0.24 (0.27) (range 0.01–0.80) before surgery to 0.38 (0.25) (range 0.01–1.00) at 3 months (Wilcoxon rank sum test, p<0.01). A significant increase in BSCVA (0.40 (0.25)) was observed at 6 months (Wilcoxon rank sum test, p<0.01) (fig 2).

BSCVA improvement was observed in 32 eyes (69.57%) at 3 months, whereas no change was seen in 12 eyes (26.09%). Visual acuity decreased by one line or more as the result of a persistent MH in two eyes (4.35%).
Configuration parameters of the MH
The mean (SD) preoperative minimum diameter of the MH was 415.69 (183.66) μm (range 149–935), and the mean base diameter was 767.53 (288.22) μm (range 174–1484). The mean height was 380.16 (116.47) μm (range 184–784).
The mean (SD) MHI was 0.55 (0.25) (range 0.27–1.33), mean DHI was 0.59 (0.25) (range 0.12–1.00), and mean THI was 1.16 (0.79) (range 0.33–4.26). MHI and THI correlated significantly with postoperative BSCVA at 3 months (table 1).
Table 1 shows correlation coefficients between postoperative BSCVA at 3 months and OCT parameters. The correlation between the height of the MH and the postoperative BSCVA was not significant, nor was the correlation between DHI and postoperative BSCVA.
Analysis by linear least-squares fit showed significant linear relationships between postoperative BSCVA and minimum diameter (p = 0.03), and between postoperative BSCVA and base diameter of the MH (p = 0.01) (fig 3). The predictability was very poor for both linear models (postoperative BSCVA–minimum diameter, R2 = 0.11; postoperative BSCVA–base diameter, R2 = 0.14). No significant linear relationship was found between postoperative BSCVA and MHI or between postoperative BSCVA and THI (p = 0.09 and p = 0.17, respectively) (fig 3). R2 was 0.07 and 0.04, respectively.

Figure 4 shows ROC curves obtained for the minimum diameter, base diameter, THI and MHI as predictors of a good visual prognosis. The cut-off values were 311 μm, 748 μm, 1.41 and 0.50 for the minimum diameter, base diameter, THI and MHI, respectively. The associated sensitivity and specificity were 56.25% and 75.86% for the cut-off value of 311 μm, 68.75% and 58.62% for the cut-off value of 748 μm, 50.00% and 86.21% for the cut-off value of 1.41, and 62.50% and 62.07% for the cut-off value of 0.50 (fig 4).

The area under the ROC curve for the minimum diameter of the MH as a predictor of a good visual prognosis was 0.66 (95% CI 0.50 to 0.79), being at the level of statistical significance (p = 0.05). The area under the ROC curve for the THI was 0.67 (95% CI 0.51 to 0.80), also at the level of statistical significance (p = 0.05). No significant areas under the ROC curve were obtained for the base diameter (p = 0.31) and the MHI (p = 0.16).
Cystic retinal changes
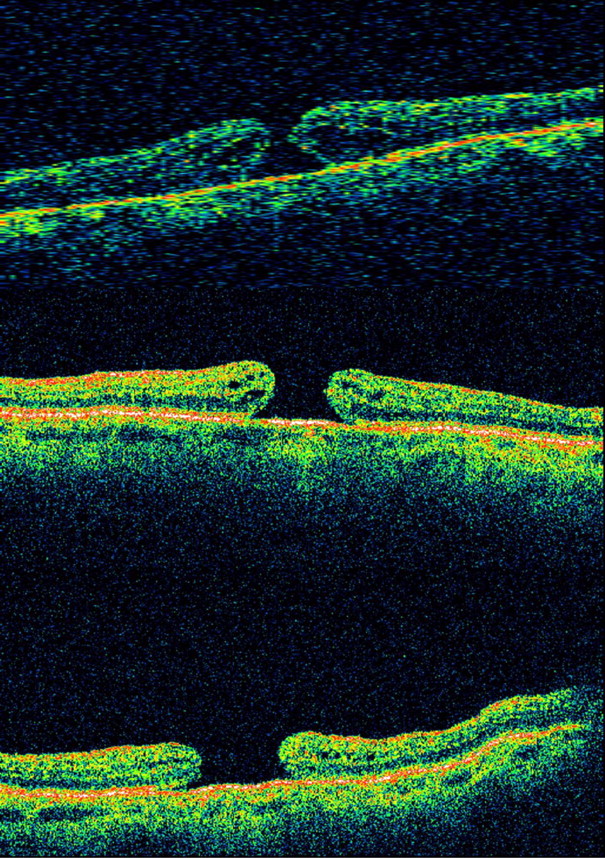
Twenty-two eyes showed preoperative cystic changes. Postoperative BSCVA improved in these cases from a mean of 0.20 (0.16) (range 0.05–0.60) to 0.36 (0.24) (range 0.05–0.75) (p<0.01; Wilcoxon rank sum test). Anatomical closure of the MH with the disappearance of cystic retinal changes was obtained in all cases (fig 5). In cases without cystic changes, postoperative BSCVA improved from 0.26 (0.17) (range 0.01–0.80) to 0.40 (0.25) (range 0.05–1.00) (p<0.01; Wilcoxon rank sum test).

DISCUSSION
Anatomical closure of the MH does not always correlate with a good functional result.15 Analysis of the MH by OCT has provided a better knowledge of MH geometry and features.
In our study, we tried to find a correlation between postoperative BSCVA and different preoperative OCT parameters. We did not consider other variables such as age, axial length, duration of symptoms and preoperative visual acuity. No significant correlations were found in previous studies between these parameters and postoperative functional outcomes,13 14 although other authors have found that they are relevant.16 We looked at BSCVA at 3 months to avoid the influence of cataract development or cataract surgery in the visual acuity results of our series.
In addition to the MHI defined by Kusuhara et al,14 we calculated two new indexes from the three measurements (MH minimum diameter, base diameter and maximal height) obtained in the preoperative analysis by OCT. We believe that the DHI indicates how strong the tangential traction is. Glial cells and newly formed collagen may play an important role in MH development exerting tangential traction, and this tangential traction is directly related to the minimum diameter of the MH. The minimum diameter may equal the base diameter if the tangential traction reaches its maximum (figs 1 and 6).

THI is the ratio between the anteroposterior vitreomacular traction and/or retinal hydration,14 and tangential traction (fig 1). It represents the relationship between the two tractions responsible for the MH and should correlate closely with postoperative BSCVA.
In our series, a significant negative correlation was found between postoperative BSCVA and the minimum diameter and base diameter of the MH. A better visual result was observed in patients with larger THI values (stronger anteroposterior vitreomacular traction and weaker tangential traction) and larger MHI values (table 1).
Several authors have tried to correlate the preoperative features of the MH determined by OCT with the anatomical and functional results of surgery.12–15 Ip et al12 obtained an anatomical closure rate of 92% for MHs smaller than 400 µm, whereas this percentage decreased to 56% when the MH was larger than 400 µm.
Kusuhara et al14 calculated the MHI, defined as the ratio of the MH height (putative anteroposterior vitreomacular traction or retinal hydration) to the diameter of the base of the MH (putative tangential traction) (fig 1), and tried to use it to predict visual outcome after surgery.14 Eyes with MHI ⩾ 0.5 experienced a more significant improvement in BSCVA than those with MHI < 0.5.
Regarding the diagnostic capability of the different MH parameters measured by OCT, we performed a ROC curve analysis. The ROC curves obtained for the different OCT parameters as predictors of a good visual prognosis are close to the line of no discrimination, especially for base diameter and MHI. This means that the diagnostic value of these parameters is not very high. The area under the curve was significant at the limit value (p = 0.05) for minimum diameter and THI, indicating that these parameters can be used as predictors of visual prognosis. We can say that the minimum diameter of the MH and the THI are fair predictors of a gain of two or more lines of decimal BSCVA after MH surgery. A good visual prognosis can be expected for an MH with a minimum diameter <311 μm and a THI >1.41 after MH surgery. The specificity of these cut-off values was good with an acceptable sensitivity.
Our results agree with those of Ullrich et al13 with regard to minimum MH diameter. They found a correlation between the preoperative data determined by OCT (base diameter, minimum diameter and MH form factor) and postoperative visual acuity. They concluded that the base and minimum diameters seemed to be factors of predictive value in MH surgery and that the minimum diameter seemed to be a better predictor than the MH form factor.13
Significant correlation was found between postoperative BSCVA and the base diameter of the MH, which agrees with the results of others.13 15 Haritoglou et al15 studied the correlation between postoperative BSCVA and base and minimum diameter of the MH, MH height and MH form factor. They found a significant negative correlation of BSCVA with base diameter and MH height and a poor correlation with MH form factor. They stated that the long-term predictive value of the MH form factor could be questioned. In contrast with these results, we found no significant correlation between postoperative BSCVA and MH height.
Ullrich et al13 and Haritoglou et al15 found a poor correlation between postoperative BSCVA and MH form factor. On the other hand, Kusuhara et al14 found that only the MHI had a statistically significant correlation with postoperative BSCVA. The MHI and MH form factor represent approximately the same ratio.14 17 We found a significant correlation of postoperative BSCVA with the MHI (p = 0.03) and the THI (p = 0.04), but not with the DHI (p = 0.91). In our opinion, the THI represents the ratio between the two tractions that are responsible for the MH, and therefore may be a good predictive index of postoperative BSCVA.
According to our results, an MH with minimum diameter <311 µm or THI >1.41 would have a better visual prognosis. Both criteria have good specificity scores and acceptable sensitivity. However, because of the disparity between our results and previous data, a study with a larger sample is needed to confirm which preoperative OCT parameters and indexes are the best predictive factors for functional results after MH surgery.
A standardised protocol for the study of MHs by OCT is necessary because all the MH parameters depend on correct centring of the OCT scans. We suggest that a variation of less than 10% in MH size must be observed in six scans to avoid bias in the minimum diameter.
REFERENCES
Footnotes
Funding: This study was supported in part by a grant from the Spanish Ministry of Health, Instituto Carlos III, Red Temática de Investigación Cooperativa en Salud “Patología ocular del envejecimiento, calidad visual y calidad de vida” (RD07/0062).
Competing interests: None.