Article Text

Abstract
AIMS To compare methods available to correct the magnification of images that result from the optics of the eye and identify errors, and source of error, of the methods.
METHODS 11 methods were applied to ocular biometry data from three independent cohorts. Each method was compared with the method of Bennett, which uses most biometric data. The difference between each method and Bennett’s is the “error” of the method. The relation between the error and axial length, ametropia, and keratometry was explored by linear regression analysis.
RESULTS Methods using axial length had the lowest mean (+0.5 to +2.6%) and standard deviation (0.6 to 1.2%) of errors. Of methods using keratometry and ametropia only, the lowest mean (−1.4% to +4.4%) and standard deviation (2.9 to 4.3%) of errors was found for a new method described in this paper, and that used by the Heidelberg retina tomograph (HRT). The highest mean error (+2.2 to +7.1%) was found for Littmann’s method. Littmann’s correction was larger than the HRT’s by 3.5 to 3.7%. The mean difference between the new and HRT methods and the “abbreviated axial length” method of Bennett is −1.3 to +2.0%. The error of the “keratometry and ametropia” methods is related to axial length.
CONCLUSIONS Methods using axial length are most accurate. The abbreviated axial length method of Bennett differs little from more detailed calculations and is appreciably more accurate than methods using keratometry and ametropia alone. If axial length is unknown, the new and the HRT methods give results closest to the abbreviated axial length method.
- Littmann
- magnification
- optic disc
- imaging
Statistics from Altmetric.com
Primary open angle glaucoma is an optic neuropathy in which characteristic morphological changes at the optic disc are related to visual field loss. These changes, which reflect the loss of ganglion cell axons that occurs in glaucoma,1 include an increase in optic cup size and a reduction in neuroretinal rim area. Since the 1970s it has been recognised that the size of the optic cup is related to the size of the optic disc in the normal population,2 3 and, similarly, the area of the neuroretinal rim is related to optic disc size.4-6 For this reason, it is necessary to make actual measurements of the size of optic disc features, rather than relative measurements which vary with optic disc size (such as the cup/disc ratio), in order to distinguish pathological from physiological states. It is not possible to measure the dimensions of the optic disc directly in vivo, except during vitreoretinal surgery,7 and so clinicians have to rely on measurements made on images of the optic disc. The size of an image of a feature in the fundus of the eye is dependent on magnification due to the camera and magnification due to the eye, as well as factors such as the position of the feature of interest in the fundus (eccentricity)8 9 and the position of the camera with respect to the eye.10-13 Various methods to correct for eye-camera14 15 and eye9 16-18magnification have been published, and all make assumptions about the optics of the eye to a greater or lesser extent. The purpose of this study was to compare the available methods for equivalence, identify errors where they occur, and establish whether these errors are systematic or random in nature.
Materials and methods
Data of the ocular biometry from three independent cohorts of patients were collected.
Set 1 comprised 90 consecutive subjects from the ocular hypertension clinic at Moorfields Eye Hospital. Each underwent keratometry, measurement of spectacle refraction, and ultrasound biometry. All measurements were made by one clinician. Keratometry was performed using a calibrated Javal-Schiotz (Haag-Streit) keratometer, the mean of two meridians being taken. Ultrasound biometry was performed with a calibrated Allergan Humphrey ultrasound biometer (Model 820) using a tonometer mounted, hard tipped probe, and operated in the semiautomatic mode. The median of five good quality measurements was taken.
Set 2 comprised 59 consecutive glaucoma patients from the Medical Research Council 5-FU Trabeculectomy Trial at Moorfields Eye Hospital. Each underwent keratometry, refraction by an optometrist, measurement of the optical anterior chamber depth, and ultrasound biometry. All measurements were made by one of two experienced optometrists. Keratometry was performed using a calibrated Javal-Schiotz (Haag-Streit) keratometer, the mean of two meridians being taken. Optical pachymetry was performed with Haag-Streit depth measuring device II, taking the median of three readings. Ultrasound biometry was performed with a calibrated Allergan Humphrey ultrasound biometer (Model 820) using a tonometer mounted, hard tipped probe, and operated in the semiautomatic mode. The median of three good quality measurements was taken.
Set 3 comprised 60 consecutive glaucoma patients from The National Medical Research Council (Singapore) 5-FU Trabeculectomy Trial at the Singapore National Eye Centre. Each underwent keratometry, refraction by a trained optometrist, measurement of the optical anterior chamber depth, and ultrasound biometry. Refraction and keratometry were carried out in a routine refraction clinic by the duty optometrist. All ultrasound biometry and optical pachymetry were carried out by a single ophthalmologist. Keratometry was performed using a calibrated Topcon KR 3000, averaging five readings, the mean of two meridians being taken. Optical pachymetry was performed with Haag-Streit depth measuring devices I and II, taking the median of three readings. Ultrasound biometry was performed with a calibrated Storz “Compuscan” using a tonometer mounted, hard tipped probe, taking the mean of 16 high quality readings, having a standard deviation of less than or equal to 0.12 mm.
Subject characteristics are summarised in Table 1.
Subject demographic data
The study design followed the tenets of the Declaration of Helsinki and informed consent was obtained from each subject after the nature of the procedures was fully explained.
The data collected were used to calculate the ocular factor “q” by 11 different methods: Bengtsson and Krakau (BK1, BK2, BK3),15 Littmann (L1, L2),16 17Bennett, Rudnicka and Edgar (BRE1, BRE2),9 Wilms (W1, W2),18 Heidelberg retina tomograph (HRT) (personal communication), new method (derivation appended).
Calculations were performed for each data set using, firstly, the anterior chamber depth (ACD) and axial length as measured by ultrasound and, secondly, the ACD as measured optically and the modified axial length (ultrasound axial length plus the difference between the optical and ultrasound ACD). For data set 1, the optical ACD was taken to be the ultrasonic depth plus 0.25 mm (mean from the literature19-22). For data set 2, optical ACD was measured, and a constant 0.55 mm corneal thickness was added. For data set 3, optical ACD was measured from anterior corneal epithelium to anterior lens capsule and optical corneal thickness was measured from anterior epithelial to posterior endothelial surface.
Calculations were made using the following assumptions: the refractive index of aqueous and vitreous humour were taken as 1.336,23 the equivalent power of the cornea as 331.5/r1 24 and the ametropia, A, as A = Fsp/(1 − 0.001v Fsp), where Fspis the spectacle refraction and “v” is the vertex distance (a value of 14 mm was assumed).
The calculation of “q” by method BRE1 is regarded as nearest to the “true” value. The other methods, divided into those that use axial length (BK1, BRE2, L2, and W2), keratometry and ametropia only (L1, BK3, W1, HRT, and the new method), and ametropia only (BK2) were compared. In addition to calculated values for “q”, an arbitrary (constant) value was also compared. The difference between method BRE1 and the various methods is expressed as the “error” of the method.
STATISTICS
Methods were compared by plotting the difference between two methods against the mean of the methods.25 Where the difference between the methods was not related to the magnitude of the result, methods were compared using a paired t test. The mean error (difference between BRE1 and other methods) is a measure of systematic bias of a method, and the standard deviation of errors is a measure of the random error (consistency of estimations). The relation between the error and the axial length, keratometry, and ametropia was explored by linear regression analysis.
Results
Biometric data for the data sets are summarised in Table 2.
Summary of ocular biometry
The mean error of each method is displayed in Table 3. The standard deviation of “errors” is given in Table 4.
Mean “error” (%) for each method
Standard deviation of the “error” for each method
Linear regression analysis was performed with the error of the “keratometry and ametropia” methods (L1, BK3, W1, HRT, and new) as the dependent variable and (modified) axial length as independent variable. The regression lines for data set 2 are shown in Figure 1A. The analysis was significant for all methods and all data sets (r 2 = 0.09 to 0.46 and p = 0.003 to < 0.000).
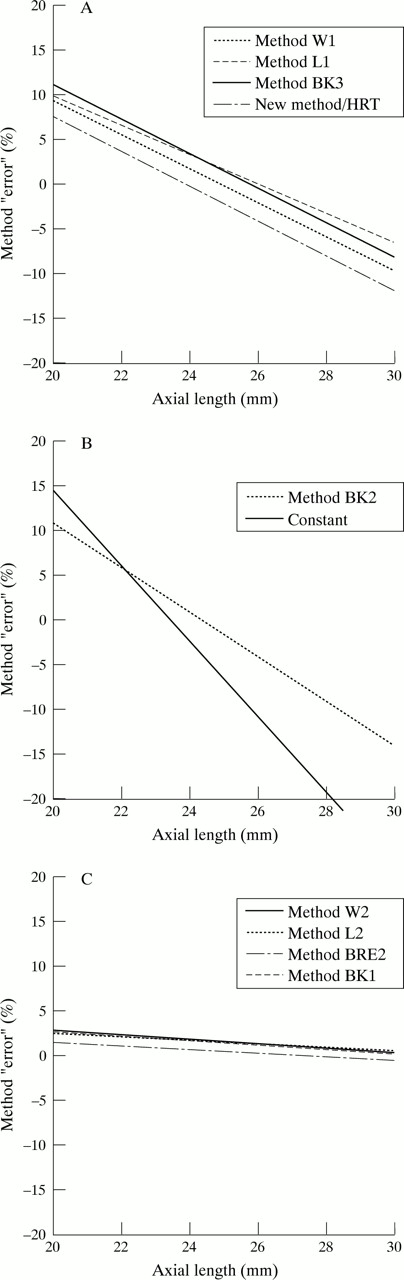
(A) Relation between (modified) axial length and the “error” of the “keratometry and ametropia” methods to determine “q” (regression lines shown). (B) Relation between (modified) axial length and the “error” of the “ametropia only” method and the “error” resulting from using a constant value for “q” (regression lines shown). (C) Relation between (modified) axial length and the “error” of the “axial length” methods to determine “q” (regression lines shown).
Linear regression analysis was performed with the error of the “spectacle refraction” method (BK2) and the error from assuming a constant as the dependent variables and (modified) axial length as independent variable. The regression lines for data set 2 are shown in Figure 1B. The analysis was significant for all data sets (r 2 = 0.35 to 0.56 and p < 0.000).
Linear regression analysis was performed with the error of the “axial length” methods (BK1, BRE2, L2, and W2) as the dependent variables and (modified) axial length as independent variable. The regression lines for data set 2 are shown in Figure 1C. The analysis was significant for all methods in data set 2 (r 2= 0.07 to 0.39, p = 0.045 to < 0.000). The analysis was not significant for any method in data sets 1 and 3.
The error of method L2 was related to the ametropia (r 2 = 0.12 to 0.29, p < 0.000) and the error of method BK2 was related to the keratometry (r 2 = 0.26 to 0.35, p < 0.000). No other consistent relations were found.
COMPARISONS WITH LITTMANN’S METHOD (L1)
L1 demonstrated the largest mean difference from BRE1 of any “keratometry and ametropia” method (+2.2 to +7.1%).
L1 was significantly larger than L2 in all data sets by 1.1% to 4.3% (p = 0.017 to < 0.000).
There was no significant mean difference between L1 and BK3 for any data set.
L1 was significantly larger than BK2 in all data sets by 1.7 to 2.8% (p < 0.000).
L1 was significantly larger than HRT in all data sets by 3.5 to 3.7% (p < 0.000).
L1 was significantly larger than the new method in all data sets by 3.5 to 3.7% (p < 0.000).
COMPARISONS WITH THE NEW METHOD
The difference between the new method and HRT was 0.03% in each data set (p < 0.000).
These methods demonstrated the smallest mean difference from BRE1 of any “keratometry and ametropia” method (−1.4 to +3.4%). They also demonstrated the smallest mean difference from the “abbreviated axial length” method (BRE2), using the modified axial length (−1.3 to +2.0%).
COMPARISONS WITH THE CONSTANT
The standard deviation of the calculation error was reduced by 84–90% using the “abbreviated axial length” method (BRE2), by 23–38% using the “keratometry and ametropia” methods (new and HRT) and by 5–26% using the “ametropia” method (BK2).
Discussion
In their paper of 1977, Bengtsson and Krakau14described the nature of camera and ocular magnification for the purpose of measuring the size of an optic disc from a photographic image. In this paper, they presented a method to correct for ocular magnification based on the spectacle refraction of the eye. Since then other authors have presented methods based on ametropia and keratometry,15 16 18 axial length only,9 15 axial length and ametropia,17 18and axial length, anterior chamber depth, crystalline lens thickness, keratometry, and ametropia.9 All these different methods make certain assumptions about the optics of the eye, and it is important to establish how the results of these methods compare and identify potential errors, in order to interpret studies that have used different methods.
PRINCIPLES OF CAMERA AND OCULAR MAGNIFICATION
For features close to the optical axis, the linear size of a photographic image (s) is related to the size of the retinal feature (t), a factor related to the camera (p) and a factor related to the eye (q), so that t = p.q.s.9 16 The camera constant (“p”, in °/mm) relates the angle of the emergent ray (U°), at the first principal point (P), to the size of the image on the camera film (“s” mm), so that p = U°/s. The magnification of the camera varies with each model, and therefore needs to be established for the particular camera used for a study.15 26 The ocular factor (“q”, in mm/°) relates the size of the retinal feature (“t” mm) to the angle (U′ °) subtended by the retinal feature at the second principal point (P′) (Fig 2). It is assumed that the angle subtended at the second principal point by the retinal feature, U′, equals the angle of the emerging ray, subtended at the first principal point, divided by the refractive index of the final ocular medium (1.336),9—that is, U′ = U/1.336.

Chief rays from a parafoveal retinal feature forming the external angular difference (U). U′ = angle subtended at second principal point (P′) by retinal feature with height “t”; k′ = distance from second principal point (P′) to fovea; A1P′ = distance from apex of cornea to second principal point; U = external angular difference (= U′.(1.336)).
Ocular magnification is entirely dependent on the vergence of the internal axis of the eye (K′).14 K′ (measured in dioptres) represents the reduced and inverted distance between the second principal point and the fovea (k′) (Fig 2)—that is, K′ = 1.336/ k′.
The retinal feature height (t) may be expressed as9:
t = k′ U′(“U” in radians, t in metres)
k′ = 1.336/K′ and U′ = U/1.336 (above),
therefore
t = U/ K′
or
t = (17.455).U°/K′(with “U” in degrees and “t” in millimetres)
p = U°/s (above),
therefore
U° = p s
t = (17.455).U°/K′ and U° = p s,
therefore
t = (17.455/ K′).p.s
t = p.q.s,
therefore
q = 17.455/ K′
The objective of the various methods to calculate “q” is to estimate K′. As information about the optical dimensions of the eye is usually incomplete, certain assumptions have to be made about missing data.
ANALYSIS OF THE METHODS TO DERIVE “q”
The most accurate method to determine K′ is by ray tracing. This is possible with a knowledge of variables such as the anterior and posterior radii of curvature of the cornea and crystalline lens, the asphericity of these surfaces, the thickness of cornea and lens, the anterior chamber depth, the axial length, the refractive indices of the ocular media (including layers of the crystalline lens), and the eccentricity of the retinal feature. It is not possible to collect this amount of data in clinical practice, and so K′ has to be estimated on the basis of fewer, easily obtained variables.
The most accurate estimation of K′ is possible if the distance k′ is known. k′ can be calculated with knowledge of the axial length of the eye and the distance (A1P′) from the apex of the cornea to the second principal point (Fig 2). The axial length is typically measured by ultrasound. The distance A1P′ can be estimated from the effective power of the cornea (derived from the keratometry), the axial length, anterior chamber depth, crystalline lens thickness, and the ametropia.23 27 The estimate of “q” by this means is the method (BRE1)9 used in this study as the basis for comparison with the other methods, as this method utilises more information, and makes fewer assumptions, about the optical dimensions of the eye.
When axial length is known, but anterior chamber depth and crystalline lens thickness are not, the distance A1P′ cannot be estimated, and a constant, “normal”, value can be assumed. Bengtsson and Krakau (method BK1)15 took a value of 1.60 mm for A1P′ from Gullstrand’s exact schematic eye and Bennett et al (method BRE2)9 took 1.82 mm from the Bennett and Rabbetts’s schematic eye.23
When the keratometry and ametropia are known, but the axial length is not, more assumptions have to be made about the optical dimensions of the eye. Littmann published his much used method (method L1) in 1982.16 28 A value for “q” was derived by tracing the chief ray from an extrafoveal point through the Gullstrand No 1 schematic eye, using the constants of that eye and varying the corneal radius of curvature according to the measured value.29Ametropia was generated by varying the axial length in the model. Littmann provided a nomogram from which it is possible to read off a value of “q” from a series of curves if the keratometry and ametropia are known. This method was not easily accessible until equations were published to enable computerisation.9The constants assumed include “normal” values for the effective power of the crystalline lens (19.11 D) and an axial length for emmetropia of 24.18 mm. A similar approach was taken by Bengtsson and Krakau (method BK3).15 Gullstrand’s “normal” value for the refractive power of the eye (58.64 D) was taken, and variations from this were calculated from the observed ametropia and keratometry. The new method presented in this study (see ) assumes a “normal” value for the effective power of the crystalline lens and the anterior chamber depth (21.76 D and 3.60 mm, from the Gullstrand-Emsley schematic eye). Wilms (method W1)18takes a similar approach, assuming a “normal” value for the lens power of 20.112 D. The HRT method uses a gradient index model for the optical properties of the crystal lens, with constants for the focal length of the crystalline lens and for the anterior chamber depth.
Finally, Littmann published curves for use when the axial length is known (method L2).16 17 The Gullstrand No 1 schematic eye again was the model. The axial length measurement is used to derive a notional radius of corneal curvature for the observed refractive error of the eye. This notional radius of corneal curvature is then used to derive “q” using the original published curves. Wilms’s axial length method (method W2)18 similarly derives a notional radius of corneal curvature for use in his original equation.
ERRORS OF THE METHODS
Axial length methods
For those methods assuming a constant value for A1P′, the error is small (Fig 1C). The distance A1P′ varies little in the population so that the maximum error in calculating “q”, from the assumption of a constant 1.82 mm (method BRE2), is unlikely to exceed +/−2.5%.9 Ninety five per cent of estimations using this method were within 1.8% of the more detailed method, BRE1, in this study.
Keratometry and ametropia methods
The mean offset error associated with these methods (Table 3) varies, with Littmann’s correction exhibiting the greatest bias and the HRT and new methods the least. The magnitude of error arises from the assumptions made about the equivalent power of the crystalline lens (or refractive power of the eye). The value used by Littmann of 19.11 D for the crystalline lens (and 58.64 D for the eye) is lower than the mean value of all three data sets in this study. It was suspected by Bengtsson and Krakau15 that this value was too low and the assumption explains the overestimation of “q” when compared with axial length methods.
Figure 1A illustrates the error in estimating “q”, using the “keratometry and ametropia” methods, with respect to axial length. All make a relative underestimation of “q” in long eyes compared with short eyes. This arises from the assumption of a constant value for the equivalent power of the crystalline lens for all eyes, whereas, in reality, the equivalent power of the crystalline lens declines with increasing axial length of the eye.30 31 Assuming a constant lens power results in overestimation of K′ in long eyes (as lens power is overestimated) and consequent underestimation of “q”. Analysis of our data demonstrates that it is not possible to predict the power of the lens from the keratometry and ametropia, in agreement with previous reports,31 so that it is not possible to correct for this error if axial length is unknown.
The relatively smaller errors of the keratometry and ametropia methods in data set 2, when compared with sets 1 and 3, may be attributed to the longer (mean) axial length in this group, which is nearer to the value assumed in the schematic eyes.
The improvement in the accuracy of determining “q” (23–38%) using these methods over the use of a constant value is moderate. The variability of lens power in the data sets in this study is greater than that of corneal power (Table 2), and this prevents more accurate estimation of “q”.
Spectacle refraction method
The offset bias of this method is relatively small, because the assumed “normal” value of the refractive power of the eye in this method (60 D) approximates the values found by calculation (Table 2). There remains a systematic underestimation of “q” in long eyes (Fig1B) because only part of the variation in axial length is manifest by ametropia, the remainder being masked by the “emmetropising” effects of changes in corneal and crystalline lens power.
MEASUREMENT/OBSERVATION ERROR
However accurate the theoretical calculations, measurements have to be made of various optical components of the eye, and these are all subject to measurement error. The principal measurements that are made for subsequent calculations are refraction, keratometry, axial length, ACD, and lens thickness (LT). The repeatability of these measurements has been assessed, and the 95% confidence intervals for measurements repeated on two32 33 to five34 occasions were found to be: subjective refraction +/−0.63D,33keratometry +/−0.93 D33 and +/−0.48 D,34axial length +/−0.18 mm32 and +/−0.35,34ACD (contact probe) +/−0.29 mm33 and +/−0.12 mm,32 and LT +/−0.20 mm,33 and +/−0.12 mm.32 However, estimations of repeatability tell us nothing of accuracy, and it is possible for “offset” errors to occur. The keratometer is simply calibrated with a sphere of known curvature. Offset errors are unlikely to occur, provided the equipment has been correctly calibrated for the user, though subsequent calculation of equivalent corneal power varies from instrument to instrument.24 Offset errors are also unlikely to occur in measurement of subjective refraction in the presbyopic age group. Refraction measurement error is minimised by the HRT because refraction does not have to be measured separately (it is taken from the divergence of the laser beam required to obtain the image). The measurement is also in the plane of the optic disc, rather than the fovea, as in subjective refraction.
Ultrasound measurements of the ACD, LT, and axial length are more difficult to validate. Comparison of ACD measurements with a contact ultrasound probe with those using an immersion technique19found the contact technique to measure an average of about 0.3 mm shorter than the immersion, which in turn has been found to give very similar measurements to optical methods.35 Contact ultrasound measurements of ACD have recently been shown to underestimate optical measurements by a mean 0.16 mm.22This is in broad agreement with the findings in this study. Similarly, contact methods give shorter axial length measurements than immersion methods by 0.14 mm to 0.28 mm.19-21
The accuracy of ultrasound biometry and keratometry, and the optical assumptions made, are tested in everyday clinical practice, in the form of predicting intraocular lens power for cataract surgery. A theoretical model36 has been evaluated. This model makes the same assumptions for corneal power calculation as are made in this study and assumes the same refractive index of aqueous and vitreous humour. It was found that, once corrections were made for the position of the intraocular implant (postoperative ACD), the mean error in postoperative refraction could be accounted for by underestimation of the axial length using a contact ultrasound probe.37 38The underestimation, of 0.16 mm to about 0.30 mm, is consistent with anterior chamber shallowing, caused by the contact ultrasound probe. We therefore recalculated the ocular magnification for the data sets using the optical ACD (with an equivalent adjustment to the axial length). Results are shown in Tables 2 and 3.
The overall accuracy of the method can be deduced from the postoperative refraction results of cataract surgery, once the axial length offset error (contact probe) correction has been made.37 39 40 The standard deviation of postoperative refractions is up to 0.87 D, so that 95% of results should fall within 1.70 D. This represents about 2.8% of the average refractive power of the eye.
COMPARISON WITH PREVIOUS REPORTS
Mansour41 and Jonas et al 42 found Littmann’s method L1 to overestimate method L2 by a mean 3.6% and 3% respectively. This compares with 1.1% to 4.2% in the same direction for our data sets. Barr29 made a theoretical assessment of the accuracy of the Littmann method (L2). He found that, within the range of +/−4 D ametropia, the mean error was +3.3% and the error increased with hypermetropia. The result is similar to that found in the real eyes of our data sets with a mean error of +1.5 to 2.7%, and with larger errors in eyes with shorter axial lengths.
Mansour41 found measurements by method L1 to be larger than those by BK2 by 0.9 % +/−2.2%, which compares to a mean difference in this study of 2.6 to 2.9% in the same direction. The explanation for this is the difference in the assumed “normal” power of the eye in the methods, 58.64 D for L1 and 60.00 D for BK2 (a difference of 2.3%). Like Bengtsson and Krakau15 we found no mean difference between the methods L1 and BK3.
RECOMMENDATIONS
This study confirms that the abbreviated axial length method (BRE2) differs little from the more detailed calculations that use keratometry, ametropia, ACD, and lens thickness in addition (method BRE1), and is appreciably more accurate than the methods that use keratometry and ametropia alone. Therefore, if axial length is known, method BRE2 should be used in preference to methods that rely on only keratometry and ametropia. Axial length measured using a contact ultrasound probe probably underestimates true axial length by around 0.25 mm, and a correction for this should be made. If axial length is not known, then the “keratometry and ametropia” methods that give results closest to the axial length methods are the new method, described herein, and the HRT method.
Acknowledgments
The authors would like to thank Dr Gerhard Zinser for providing the calculation routine used by the Heidelberg retina tomograph to correct for ocular magnification.
Grant support: Mr Garway-Heath is funded by a grant from the Guide Dogs for the Blind Association, UK. Mr Lowe is funded by a grant from the Medical Research Council, UK (grant no G9330070). Mr Foster is funded by the Singapore National Medical Research Council (Grant no NMRC/0044/1944)
DERIVATION OF THE NEW METHOD
K′ = Fe + A (Fe = refractive power of the eye, A = ametropia/principal point refraction)
q = 17.455/K′, and K′ = 17.455/q
therefore,
17.455 /q = Fe + A
Fe = F1 + FL − [(w/n).F1.FL] (F1 = refractive power of the cornea, FL = equivalent power of the crystalline lens)27
F1= 331.5/ r1 (r1= radius of curvature of the anterior surface of the cornea)24
FL = 21.76 dioptres (constant taken from the Gullstrand-Emsley schematic eye)
w/n = 0.0043 (constant taken from the Gullstrand-Emsley schematic eye)
substituting FL and w/n,
Fe = F1 + 21.76 − [(0.0043).F1.(21.76)] = F1 + 21.76 − (0.094.F1) = (0.906).F1 + 21.76
substituting F1,
Fe = (0.906).(331.5/ r1) + 21.76 = (300.3/r 1) + 21.76
Therefore,
K′ = (300.3/ r1) + 21.76 + A
and
17.455/q = (300.3/ r1) + 21.76 + A
1/q = (17.21 / r1) + 1.247 + (A / 17.455)