Article Text

Abstract
Objectives: Following a 3.7-fold increase in the rate of cataract surgery in the UK between 1989 and 2004, concern has been raised as to whether this has been accompanied by an excessive decline in the threshold such that some operations are inappropriate. The objective was to measure the impact of surgery on a representative sample of patients so as to determine whether or not overutilisation of surgery is occurring.
Design: Prospective cohort assessed before and 3 months after surgery.
Setting: Ten providers (four NHS hospitals, three NHS treatment centres, three independent sector treatment centres) from across England.
Participants: 861 patients undergoing first eye (569) or second eye (292) cataract surgery provided preoperative data of whom 745 (87%) completed postoperative questionnaires.
Main outcome measures: Patient-reported visual function (VF-14); general health status and quality of life (EQ5D); postoperative complications; overall view of the operation and its impact.
Results: Overall, visual function improved (mean VF-14 score increased from 83.2 (SD 17.3) to 93.7 (SD 13.2)). Self-reported general health status deteriorated (20.3% fair or poor before surgery compared with 25% afterwards) which was reflected in the mean EQ5D score (0.82 vs 0.79; p = 0.003). At least one complication was reported by 66 (8.9%) patients, though this probably overestimated the true incidence. If the appropriateness of surgery is based on an increase in VF-14 score of 5.5 (that corresponds to patients’ reporting being “a little better”), 30% of operations would be deemed inappropriate. If an increase of 12.2 (patients’ reports of being “much better”) is adopted, the proportion inappropriate is 49%. Using a different approach to determining a minimally important difference, the proportion inappropriate would be closer to 20%. Although visual function (VF-14) scores were unchanged or deteriorated in 25% of patients, 93.1% rated the results of the operation as “good,” “very good” or “excellent,” and 93.5% felt their eye problem was “better.” This partly reflects inadequacies in the validity of the VF-14.
Conclusions: Improvement in the provision of cataract surgery has been accompanied by a reduction in the visual function threshold. However, methodological difficulties in measuring the impact of cataract surgery on visual function and quality of life mean it is impossible to determine whether or not overutilisation of cataract surgery is occurring.
Statistics from Altmetric.com
The rate of surgery for cataract has increased dramatically in many countries over the last 20 years.1 In the UK it rose from 173 to 637 per 100 000 between 1989 and 2004,2 excluding privately funded surgery. During the 1990s, the increase was due to the advent of day surgery, the introduction of phacoemulsification and the shift from general to local anaesthesia. Despite the rate having increased 2.5-fold in England by 2000, patients still faced an average wait for surgery of 7 months. In response, the Department of Health published Action on Cataracts, which led to a further 63% increase in the surgical rate.3 4 And in 2003, the government funded the introduction of additional providers, in the form of Independent Sector Treatment Centres, to boost the rate still further.5
Concern about possible overuse of cataract surgery was first expressed in Canada in 2002. Wright and colleagues reported that for 27% of patients treated in Vancouver in 1999–2000, their self-reported visual function was the same or worse following surgery.6 In 2004 in the UK, the Royal College of Ophthalmologists re-emphasised the need to ensure that surgery was only performed when a patient’s lifestyle was restricted by their symptoms7 (though their guidelines made an exception for patients with ocular comorbidity).
There is no doubt that an increasing rate of surgery in many countries has been accompanied by a lowering of the threshold of visual dysfunction, as determined by patients’ reports of any difficulties they are encountering because of their vision. Using the most commonly employed patient-reported measure, the VF-148 in which a score of 100 represents no difficulties, eight studies in the 1990s in USA, Spain, Canada, Denmark, UK and Sweden found the mean preoperative score was 62.9–76.0.9–14 In contrast, three studies in Canada, Australia and Scotland carried out since 2000 report the mean score has risen to 73.0–84.4.6 12 15
A suggestion that increased rates of surgery in England might have been accompanied by an excessive reduction in the threshold, leading to unnecessary surgery, has recently been made,2 prompting the suggestion that observational studies of patients’ outcomes are needed.16 To investigate the appropriateness of cataract surgery, we examined the impact of surgery on a representative cohort of patients.
METHODS
Ten providers (four NHS hospitals, three NHS treatment centres, three independent sector treatment centres) from a wide geographical area of England agreed to participate. This paper is based on an opportunistc analysis of data collected in a project to test the feasibility of routine collection of data from NHS patients before and after surgery.17 Ethics approval was obtained from an MREC. During the recruitment period in 2006, 1485 patients underwent cataract removal, but 253 (17.0%) were judged to be incapable of completing a written questionnaire in English because of cognitive impairment, poor sight, literacy or language-comprehension problems. Of the 1232 eligible patients, 1025 (83.2%) were invited by local staff to participate, of whom 860 (83.9%) agreed.
Patients completed a preoperative questionnaire either in a preoperative assessment clinic or on admission for surgery. The following information was collected: age, sex and postcode (to determine an Index of Multiple Deprivation. a proxy measure of socio-economic status where higher scores represent greater deprivation); duration of symptoms; history of previous similar surgery; general health status; comorbidities (21 categories);18 the VF-14; and the index part of the EQ-5D, a generic measure in which higher scores represent better health-related quality of life.19
Postoperative questionnaires were mailed 3 months after surgery to patients’ homes from the Royal College of Surgeons of England. Non-responders were sent a reminder letter and replacement questionnaire 5 weeks after the original mailing. Of the 860 patients recruited, 745 (87%) completed postoperative questionnaires. The questionnaires contained: the EQ-5D and the VF-14; a question relating to four generic postoperative complications (allergy or reaction to drug, and urinary, bleeding or wound problems);20 a question on the overall result of the operation; and a question on its overall impact on the patient’s eye problem.
Preoperative data are shown for all 860 recruited patients. Prepost comparisons are limited to the 745 postoperative respondents. The association between general health status and EQ5D was tested by regression with general health status treated as a continuous variable. Oldham’s method was used to show the association between change and initial value of the VF-14.21 Multivariable regression models (linear and logistic) were built to identify which factors influenced postoperative VF-14 and EQ-5D scores and the complication rate. Variables were retained in the models if p<0.1.
RESULTS
Characteristics of patients
The mean age of the patients was 74.2 (SD 9.8) years, and 57.5% were women. The median IMD score (socio-economic status) was 15.6 (interquartile range (IQR) 10.1 to 24.4).
The median time that patients had suffered from visual symptoms was 2 years (IQR 1–4 years). About a third (34%) were undergoing second-eye cataract surgery. The median number of systemic co-morbidities reported (from a list of 21) was 1.5 (IQR 1–3).
About 80% of patients described their general health as at least good: good 44.6%; very good 29.1%; excellent 6.0%. Of the rest, 18.3% reported fair and 2.0% poor. This distribution was reflected in their EQ5D scores: mean 0.81 (SD 0.23). There was a positive association between self-rated general health and EQ-5D (p<0.0001)—as general health increases towards “excellent” the mean EQ-5D score increases.
The mean preoperative VF-14 score was 82.7 (SD 17.3) (83.2 for those who subsequently completed a postoperative questionnaire). The distribution (fig 1) reveals a large proportion reporting little or no dysfunction. The 292 (34%) patients undergoing second-eye surgery were more likely to have a score of 90 or more than those having surgery for the first time (56% vs 44%).

Outcome
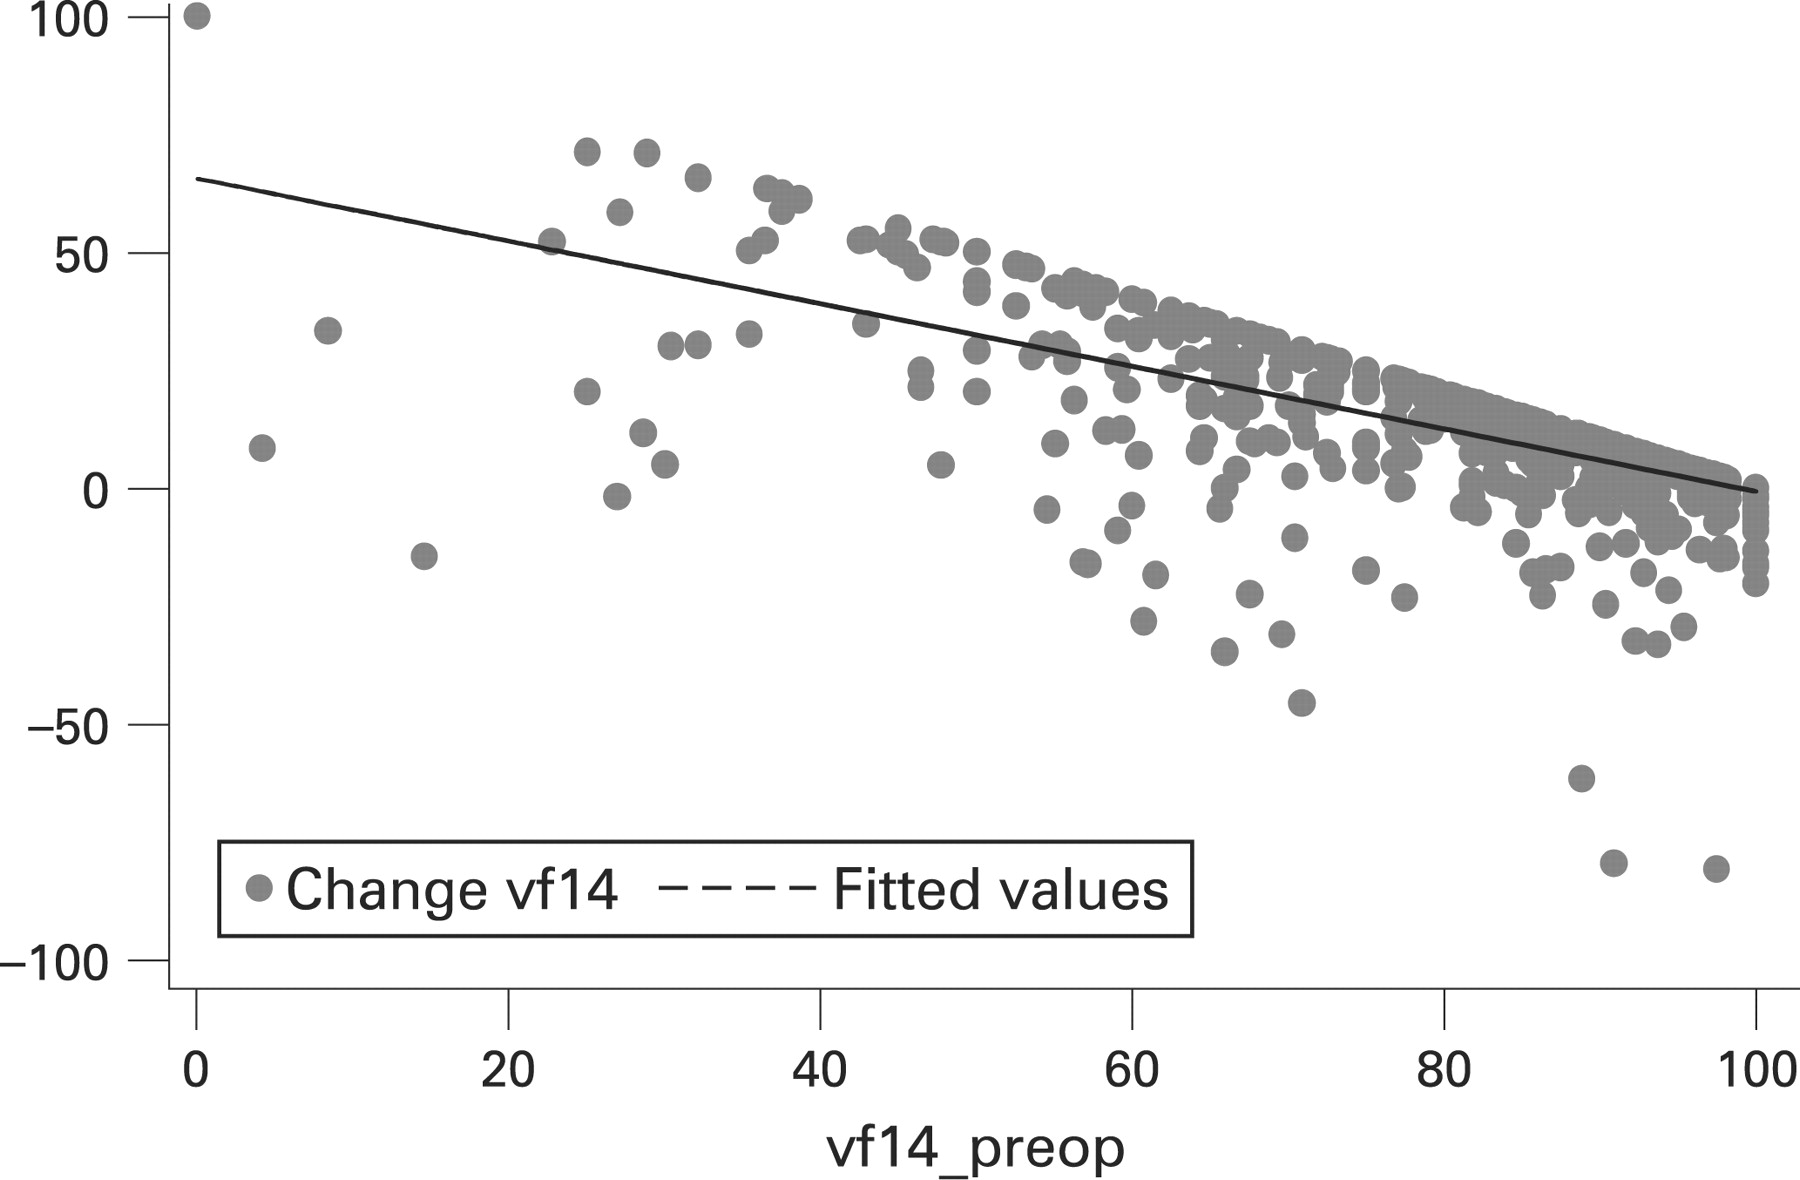
Three months after surgery, the mean VF-14 score was 93.7 (SD 13.2), representing a mean improvement of 10.5 (SD 16.5). The extent of improvement was related to the degree of preoperative visual dysfunction: the worse a patient’s visual function was before surgery, the greater was the extent of their improvement. While this was partly due to regression to the mean, a statistically significant association remains after this is taken into account (fig 2). Positive scores on the vertical axis refer to improvement. A quarter of the patients reported no change or a worsening of their visual function.

There was some deterioration in patients’ general health: 25.0% reported their general health as only fair or poor (compared with 20.3% before surgery), and the mean EQ-5D score declined from 0.82 to 0.79 (p = 0.003). Postoperative general health complications were reported by 66 (8.9%) patients: allergy/reaction to drug 3.0%; urinary problem 1.7%; bleeding 3.0%; and wound problem 2.7%. The decline in the EQ-5D score was not associated with the occurrence of complications: the score declined in 77% of those with no complication and in 78% of those reporting a complication.
Most patients (93.1%) described the results of their operation as good or better: 17.6% good; 29.6% very good; 45.9% excellent. The mean change in VF-14 scores was greater in patients who were more satisfied with the results of their operation (table 1).
Overall, most patients felt their visual problem was much better (82.0%) or a little better (11.5%) following surgery. Only 3.4% felt no benefit or worse. Again, these views were reflected in the changes in VF-14 scores (table 2).
Determinants of outcome
Multivariate analyses revealed three factors influenced the postoperative VF-14 score: preoperative VF-14 score, age and general health status. These three variables explained 20% of the variation between patients in postoperative VF-14 score.
Determinants of the postoperative EQ-5D score were: preoperative EQ-5D, age, general health status and comorbidity. They explained 46% of the variation between patients in postoperative EQ-5D score.
The only variable associated with complication rate was preoperative EQ-5D (area under ROC curve = 0.61) (ie, the poorer a patient’s preoperative quality of life, the more likely they reported a complication).
Appropriateness of surgery
If a change in VF-14 score of 5.5 is taken as an indication of a worthwhile improvement in visual function (following Jaeschke et al,22 based on the 85 patients reporting their problem to be “a little better” in table 2), then a patient would need to have a preoperative VF-14 score of less than 94.5 to be able to achieve minimal benefit from surgery. On this basis, 30.3% of patients would be deemed inappropriate. However, 94.3% of such patients reported the results of their operation as “good,” “very good” or “excellent” (table 3), and 95.7% reported their vision as “a little better” or “much better” using a global retrospective measure (table 4).
If the more stringent requirement of “much better” is adopted (change in VF-14 score of 12.2), then 49.3% of patients would be deemed inappropriate. Again, the majority of those deemed inappropriate based on longitudinal data were, on the basis of a single retrospective assessment, pleased with the outcome (tables 3, 4).
DISCUSSION
Findings
This study confirmed that preoperative visual function, measured using the VF-14, has increased among NHS patients from a mean of 68.1 in 1994/199523 to 82.7 in 2006. The proportion of patients with a score of 90 or more has risen from 18.1% to 45.0%. The mean VF-14 score is now similar to that reported for privately funded patients in 2001 (83.2) and in 2005/2006 (84.4) (BUPA, personal communication). Based on the VF-14, a high proportion of patients, 30–50%, can achieve little or no improvement according to patients’ reports of the impact on their visual function. Despite this, most patients were satisfied with the result of their operation: 93.1% viewed the outcome as good to excellent; 93.5% reported that their problem was better.
Before considering explanations for such a discrepancy and the issue of whether or not unnecessary surgery is taking place, some limitations of the study need to be addressed.
Limitations
First, although we achieved a high recruitment rate (84% of those invited) and high postoperative response rate (87%), the exclusion of 17% of patients as ineligible because of difficulties in completing the questionnaires probably excluded some of those with the worst visual function and general health. This would mean we may have underestimated slightly the mean impact of surgery on visual function. Despite this, participants were representative of those currently being treated in the NHS as regards socio-demographic characteristics and general health status. The proportion of patients undergoing second eye surgery (34.0%) is similar to that reported elsewhere.
A second concern is the validity of our estimation of a minimally important difference in VF-14 score. There is no agreed method for determining what size of change on a scale constitutes a “useful” benefit to a patient. We employed an anchor-based method, using patients’ reports of “a little better” but as has been seen, patients reporting they were “about the same” achieved a similar level change in VF-14 score (table 2). This suggests that the use of 5.5 might underestimate a minimally important difference and, as a result, underestimate the proportion of inappropriate operations. Conversely, the use of an anchor-based method can be challenged. An alternative approach is to derive a minimally important difference statistically based on 0.2 of the standard deviation of the preoperative VF-14. This gives a value of about 3.5, suggesting that about 20% of cases may be inappropriate.
Third, the incidence of complications may be overestimated. A patient may report discomfort from a wound as a “wound problem” even though a surgeon may deem their experience as “normal and expected” rather than an abnormal, adverse outcome. Also, if a patient experiences urinary symptoms during the postoperative period, they may ascribe this to the operation, whereas a clinician may perceive it as being unrelated. For these reasons, the incidence of patient reported “complications” is likely to be higher than that reported by clinicians.
And finally, ocular comorbidity (such as glaucoma) was not taken into account, as it was felt accurate information could not be obtained directly from patients. A small proportion of the patients with good visual function may have suffered from concomitant conditions that would justify cataract surgery.
Explanations
These limitations do little to explain the apparent inconsistency we have found: 25% of patients report no change or a worsening of visual function, yet only 6.9% report the result of surgery as only fair or poor, and even fewer (3.4%) report no benefit or a worsening of their eye problem. There are two likely explanations.
The first challenges the validity of the so-called “transition questions” (ie, how are you now compared to before surgery?). Consistent with studies of other surgical operations, most patients report that they feel better and have no regrets about having undergone surgery. Such views do not always reflect the impact an operation has had on their functional health and quality of life.24–26 This probably reflects patients’ reduced anxiety having come through surgery and an understandable need to justify to themselves that the decision to undergo surgery had been the correct one. We have some evidence to support this—the transition score correlates more with the postoperative VF-14 (Spearman coefficient 0.37) than with the preoperative score (0.09).
Second, the responsiveness and the validity of the VF-14 may be inadequate. Studies demonstrating its satisfactory psychometric properties were mostly conducted in the 1990s when patients’ preoperative severity was greater than today: internal consistency (α = 0.74–0.85; item-total correlations = 0.32–0.61);8 21 intrarater reliability (ICC 0.79; 0.84);14 27 construct validity;8 21 28 29 and responsiveness (effect size 0.87–1.49).27 28 However, by 2006, the severity of cataracts and the accompanying visual dysfunction had decreased considerably, throwing into doubt the validity of the VF-14.
Its validity could have been compromised in two ways. First, it has been suggested that the VF-14 does not reflect all the concerns of cataract patients.30 A review of patients awaiting surgery in Vancouver who had a score of 100 (no difficulties) found that, on closer questioning, 72% reported they experienced glare, double or blurry vision. These, and other effects, have recently been described in the UK.31 Second, it could be that patients are unaware of any visual dysfunction before surgery because any deterioration has been so gradual. It is only after surgery, when their vision is restored, that they become aware of how much brighter and clearer the world can be. This is an example of response shift. Such patients report no or little dysfunction before surgery and the same afterwards, but still report that the operation has had a beneficial impact.
Implications
There is a need for a new, improved instrument for assessing the impact of cataract surgery on patients’ visual function and quality of life. However, it is not clear how the challenge of unperceived deficits can be tackled, a challenge that has been recognised by others.32 If patients only become aware of visual dysfunction after their function has been restored, how can the extent of that improvement be measured? It clearly cannot be done by comparing before and after assessments. The only way would be by retrospective assessment, an approach with major psychometric challenges. Yet until improvements in patients’ health-related quality of life can be measured, the cost–utility of cataract surgery and an appropriate treatment threshold cannot be determined. It would therefore be unwise for purchasers of healthcare to use the preoperative VF-14 score as an indicator of appropriateness. Our concerns about the validity of the VF-14 have recently been accepted by the English Department of Health who have decided not to include cataract surgery as one of the first elective procedures to be routinely assessed using patient reported outcome measures.33 However, the warning that unnecessary surgery might be occurring and the need for “a reality check” remain.34
Acknowledgments
We thank: the many patients who participated by completing questionnaires; the staff of the surgical centres who recruited patients, assisted in supplying data on the activity of their centres, and provided valuable insights and information about the process; and A Vallance-Owen and C Minett for data on BUPA members; advice from J Sparrow, A Malik, J Brazier, D Nuttall, D Franklin, A Simpkins and A Glanz.
REFERENCES
Footnotes
Competing interests: None.
Funding: The sponsor (the Department of Health Policy Research Programme and Commercial Directorate) had no part or influence on any aspect of this study, the writing of the report or the decision to submit the article for publication.
Contributors: NB, JB, JvdM and JL designed the study; LJ and LC managed data collection and cleaning; JL conducted statistical analyses; NB drafted the paper; JB, JvdM and JL commented and contributed to the final version. NB is guarantor.
Ethics approval: Ethics approval was provided by Wales MREC.
Patient consent: Obtained.