Article Text

Abstract
Background/aims To investigate the rates of structural and functional progression of primary open-angle glaucoma in an African ancestry cohort and identify risk factors for progression.
Methods This retrospective study included 1424 eyes from glaucoma cases in the Primary Open-Angle African American Glaucoma Genetics cohort, with ≥2 visits for retinal nerve fibre layer (RNFL) thickness and mean deviation (MD) measurements over ≥6-month follow-up. The rates of structural progression (change in RNFL thickness/year) and functional progression (change in MD/year) were calculated from linear mixed effects models, accounting for intereye correlation and longitudinal correlation. Eyes were categorised as slow, moderate or fast progressors. Risk factors for progression rates were assessed using univariable and multivariable regression models.
Results The median (interquartile) rates of progression were −1.60 (−2.05 to –1.15) µm/year for RNFL thickness and −0.40 (−0.44 to –0.34) decibels/year for MD. Eyes were categorised as slow (structural: 19%, functional: 88%), moderate (structural: 54%, functional: 11%) and fast (structural: 27%, functional: 1%) progressors. In multivariable analysis, faster RNFL progression was independently associated with thicker baseline RNFL (p<0.0001), lower baseline MD (p=0.003) and beta peripapillary atrophy (p=0.03). Faster MD progression was independently associated with higher baseline MD (p<0.0001), larger cup-to-disc ratios (p=0.02) and lower body mass index (p=0.0004).
Conclusion The median rates of structural and functional progression in this African ancestry cohort were faster than the rates reported from previously published studies in other ethnic groups. Higher baseline RNFL thickness and MD values were associated with faster progression rates. Results highlight the importance of monitoring structural and functional glaucoma progression to provide timely treatment in early disease.
- Glaucoma
- Optic Nerve
Data availability statement
Data are available upon reasonable request. Detailed phenotypic data from the Primary Open-Angle African American Glaucoma Genetics (POAAGG) cohort, including the progression data included in this paper, is accessible to interested parties by contacting the corresponding author. All POAAGG genotype files are available from the dbGap database (accession number phs001312.v1.p1; URL: https://www.ncbi.nlm.nih.gov/projects/gap/cgi-bin/study.cgi?study_id=phs001312.v1.p1).
This is an open access article distributed in accordance with the Creative Commons Attribution Non Commercial (CC BY-NC 4.0) license, which permits others to distribute, remix, adapt, build upon this work non-commercially, and license their derivative works on different terms, provided the original work is properly cited, appropriate credit is given, any changes made indicated, and the use is non-commercial. See: http://creativecommons.org/licenses/by-nc/4.0/.
Statistics from Altmetric.com
WHAT IS ALREADY KNOWN ON THIS TOPIC
The course of primary open-angle glaucoma (POAG) progression varies greatly among patients, with some progressing very slowly with conservative treatment, while others deteriorate rapidly despite more aggressive interventions. Prior studies on risk factors for POAG progression have primarily been conducted in white populations.
WHAT THIS STUDY ADDS
This study investigated the rates of structural and functional progression in a large African ancestry population and identified demographic, systemic and ocular risk factors for progression rates.
HOW THIS STUDY MIGHT AFFECT, RESEARCH, PRACTICE OR POLICY
Median rates of decline from POAG were faster in our African ancestry cohort than rates reported from other ethnic groups. Better understanding of the course of POAG progression and its risk factors in African ancestry individuals can inform decisions on treatment choice and escalation.
Introduction
Glaucoma is a group of optic neuropathies characterised by progressive optic nerve degeneration and corresponding visual field loss.1 Primary open-angle glaucoma (POAG), the most common form of the disease, affects approximately 53 million individuals worldwide, with an estimated 6 million progressing to bilateral blindness.2 The course of the disease can vary widely among patients, with some individuals experiencing rapid visual field loss despite more aggressive intervention and others progressing slowly with conservative treatment.3 Careful monitoring of POAG progression over time allows ophthalmologists to identify at-risk patients, provide timely intervention and modify treatment when needed.4
African ancestry individuals are especially at risk for rapid progression of POAG and subsequent vision loss. These individuals are 5–6 times more likely to be diagnosed with POAG and up to 15 times more likely to experience vision loss or blindness from the disease, compared with European Americans.5–7 African ancestry individuals are also diagnosed with POAG at a younger age,8 9 present with more severe disease,10 11 and experience faster disease progression than European Americans.12 POAG is highly familial; irreversible vision loss early in adulthood can affect multiple family members and contribute to subsequent adverse economic and health outcomes.13
To evaluate POAG progression, ophthalmologists assess both structural and functional changes in the eye. Optical coherence tomography (OCT), the most common method of assessing structural progression, provides quantitative and reproducible measures of neural loss from different anatomic regions of the eye, including retinal nerve fibre layer (RNFL) thickness.14 RNFL thinning is an established risk factor for POAG and is predictive of subsequent visual field loss.15 16 The gold standard for assessing functional loss in POAG is visual field testing using standard automated perimetry.17 Global indices such as mean deviation (MD) provide the rate of progression of field loss in decibels (dB) per year, though they may not be sensitive to all localised changes.18
Several clinical trials and studies have investigated risk factors for progression of POAG over time, with slightly varying results. The Early Manifest Glaucoma Trial (EMGT) identified older age, higher baseline intraocular pressure (IOP), thinner central corneal thickness (CCT) and more severe MD as prognostic factors for progression.19 In contrast, the Advanced Glaucoma Intervention Study (AGIS) reported that better visual fields were associated with increased risk of progression.20 Other established risk factors include self-reported diabetes (AGIS, Collaborative Initial Glaucoma Treatment Study10), low blood pressure (EMGT19) and migraine and optic disc haemorrhages (Collaborative Normal Tension Glaucoma Study21). These risk factors were identified in populations of primarily white individuals, and thus require explicit investigation in African ancestry individuals.
In this study, we investigated the rates of structural and functional progression in an African ancestry cohort and identified risk factors for progression. Eligible glaucoma cases from the Primary Open-Angle African American Glaucoma Genetics (POAAGG) study were included in analyses. The rates of structural progression (change in RNFL thickness/year) and functional progression (change in MD/year) were calculated and used to categorise each eye as a slow, moderate or fast progressor. We then evaluated the demographic, systemic and ocular risk factors for progression rates in this cohort.
Methods
Study population
The POAAGG study cohort consists of patients who self-identified as black (African Americans, African descent or African Caribbean) and were 35 years or older from Philadelphia, Pennsylvania, USA. Eligible patients were recruited between July 2010 and March 2019 from regularly scheduled appointments with ophthalmologists at the University of Pennsylvania, Philadelphia VA Medical Center and two external sites (Temple University; private practice of Windell Murphy, MD), as well as through community outreach events.
Each patient received a clinical examination, including an onsite interview and ophthalmic exam. A glaucoma specialist or ophthalmologist classified each patient as a case, control or suspect based on detailed criteria.22 All patients signed an informed consent form and provided a genomic DNA sample. The study design, inclusion and exclusion criteria, and phenotyping methods were described in detail elsewhere.22 The study protocol and consent statement were approved by the University of Pennsylvania institutional review board (IRB), and the research adhered to the tenets of the Declaration of Helsinki.
Risk factors for progression
A number of risk factors for progression were assessed in this study, as detailed below:
Demographic, behavioural and systemic data: Demographic, behavioural and systemic disease information was collected from each patient during the onsite enrolment interview. Demographic information included age at enrolment, gender and self-identified racial group. Behavioural information, such as tobacco and alcohol use, was collected using a questionnaire. History of systemic disease (diabetes, hypertension), body mass index (BMI) and family history of glaucoma were also collected at the enrolment interview and supplemented through electronic medical records, as detailed in a prior publication.23
Ocular data: During the onsite exam, glaucoma-related phenotypes were collected from cases and entered into the Research Electronic Data Capture database. These phenotypes included visual acuity, cup-to-disc ratio (CDR), IOP, CCT, MD, pattern standard deviation and RNFL thickness.
Qualitative features of the optic cup and disc were also evaluated in this study. At enrolment and subsequent visits, 30° colour stereo disc photos were taken using the Topcon TRC 50EX retinal camera (Topcon Corp. of America, Paramus, New Jersey, USA). Three non-physician graders were trained by glaucoma specialists to grade these digital stereo colour images using a stereo viewer (Screen-Vu stereoscope, Portland, Oregon, USA), as detailed elsewhere.24 Two graders independently completed a standardised grading of each photo for numerous features of the optic cup and disc.25 The Reading Center Director adjudicated any discrepancies between the two graders.
Genetic data: In a preliminary genome-wide association study (GWAS) on cases and controls in the POAAGG cohort, several single nucleotide polymorphisms (SNPs) were associated with POAG and related quantitative traits. Based on these findings, two of these variants were selected to assess their association with POAG progression in this study: genotypes for the SNP rs112369934 (TT wildtype and TC variant), implicated with case–control status near the TRIM66 gene on chr1126 and the SNP rs187699205 (GG wildtype and GC variant) in the intron of the LMX1B gene, associated with MD.27
Statistical analyses
This study included eyes from glaucoma cases with ≥2 visits with RNFL measurements and ≥2 visits for MD measurements over ≥6-month follow-up. The rates of structural progression (annual rate of change of global RNFL thickness) and functional progression (annual rate of change of MD from visual fields) for each eye were calculated from linear mixed effects models with random intercepts and random slopes, accounting for intereye correlation from the same patient and longitudinal correlation for the same eye over time. Best linear unbiased prediction was used to estimate individual slopes of RNFL thickness and MD for each eye. We reported the slope estimates from the linear mixed effects models, rather than those obtained from the ordinary least squares linear regression models, to be more precise, particularly when the number of time points for estimating linear slope was small.28 29
Based on the calculated progression rates of RNFL thickness and MD, each eye was classified into a slow, moderate or fast group for structural and functional progression based on predetermined cut-offs.30 For structural progression, RNFL rate of change was >−1 μm/year for slow progressors, between −2 and −1 μm/year for moderate progressors and ≤−2 μm/year for fast progressors. For functional progression, the MD rate of change was >−0.5 dB/year for slow progressors, between −0.5 and −1 dB/year for moderate progressors and ≤−1 dB/year for fast progressors.
We assessed the correlation between rates of structural and functional progression by calculating the Spearman correlation coefficient between rates of RNFL thickness and MD. The 95% CI of the Spearman correlation coefficient was calculated using cluster bootstrap.31
We performed univariable and multivariable risk factors analysis for progression rates (as continuous measures) of structural and functional progression using linear regression models and using logistic regression models for being fast progressor (yes/no). The risk factors associated with p<0.10 in univariable analyses were included in the initial multivariable regression model, which went through backward stepwise variable selection using p<0.10 as entry criteria and p<0.05 as the staying criteria, so that the final multivariable regression models only kept statistically significant risk factors. In all regression models for risk factors analyses, the intereye correlation was accounted for by specifying the compound symmetry correlation structure in the generalised estimating equations.32 The collinearity among continuous risk factors was checked by their correlation coefficients and the variance inflation factor from multivariable models. Two-sided p<0.05 was considered to be statistically significant, and all statistical analyses were performed in SAS V.9.4 or R Statistical Software (V.4.1.0, R Foundation for Statistical Computing, Vienna, Austria).
Results
A total of 1424 eyes from 757 glaucoma cases were included in the study. The mean (SD) age at enrolment was 69 (10.54) years, with mean (SD) follow-up of 3.1 (2.3) years for structural progression and 5.1 (5.0) years for functional progression. The mean (SD) number of visits per eye was and 2.9 (1.3) for structural progression and 3.8 (3.1) for functional progression, with a total number of visits of 4152 and 5346, respectively.
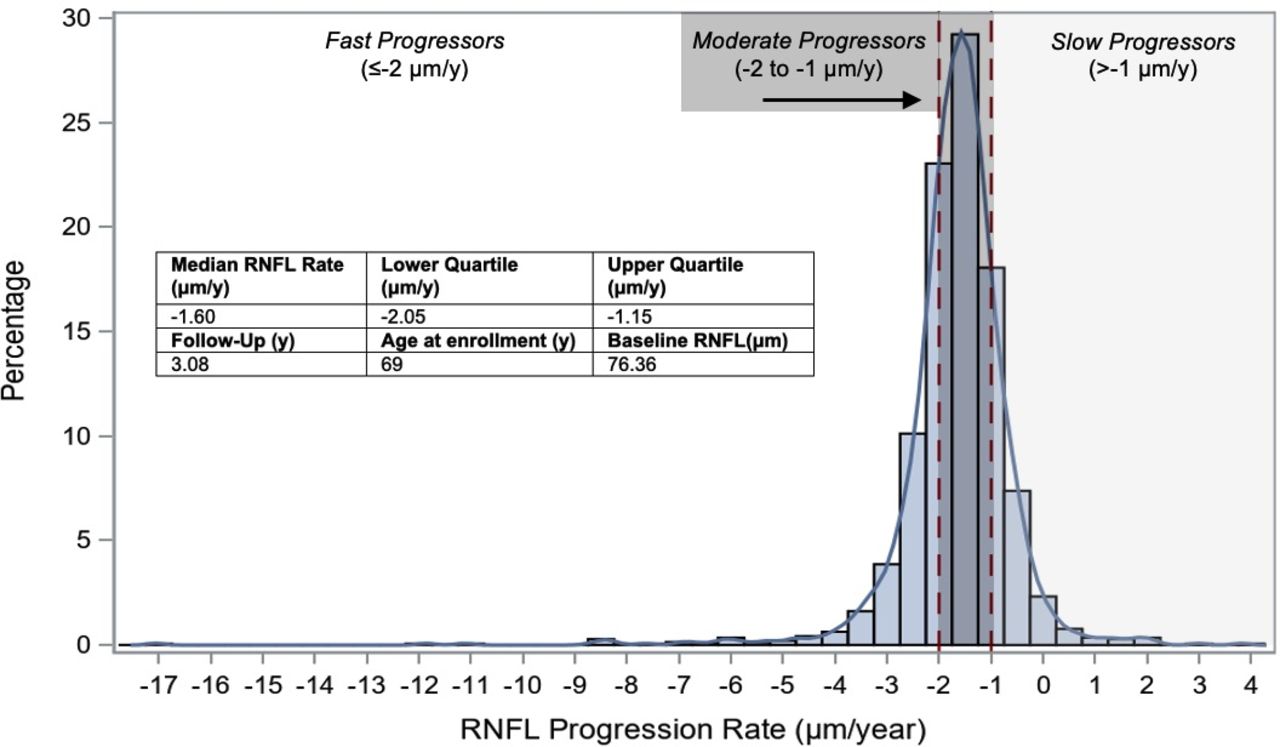
The mean (SD) baseline RNFL thickness for 1424 eyes was 76.36 (17.8) μm. The median (interquartile) rate of progression for RNFL thickness was −1.60 (–2.05 to –1.15) µm/year (figure 1). For structural progression, eyes were classified into slow (19%), moderate (54%) and fast (28%) progression groups (table 1). Online supplemental tables 1−6 show the univariable analysis of demographic, ocular and qualitative phenotype risk factors for being a fast progressor (online supplemental tables 1−3) and increasing RNFL progression rate (online supplemental tables 4−6). In multivariable analysis, faster RNFL progression was independently associated with thicker baseline RNFL (p<0.0001), lower (worse) baseline MD (p=0.003) and beta peripapillary atrophy (p=0.03; table 2). Thicker baseline RNFL (OR=2.64 per 10 µm increase in baseline RNFL, p<0.001) was a risk factor being a fast progressor in multivariable analysis, while baring of the lamina cribrosa (LC) was protective (OR=0.56, p=0.02) (table 3).
Supplemental material

Distribution of rate of change of retinal nerve fibre layer (RNFL) thickness. The median rate of RNFL decline was −1.60 (−2.05 to –1.15) µm/year, with baseline RNFL thickness of 76.36 µm (N=1424 eyes). There was a fairly even distribution between slow (19%), moderate (54%) and fast (28%) structural progressor groups.
Classification of glaucoma cases as slow, moderate and fast progressors (N=1424 eyes from 757 patients)
Multivariable analyses for baseline risk factors of structural and functional progression rates
Multivariable analyses of baseline risks factors for being a fast structural progressor and a moderate/fast functional progressor
The mean (SD) baseline MD of 1424 eyes was −6.26 (7.62) dB. The median (interquartile) rate of progression was −0.40 (−0.44,–0.34) dB/year (figure 2). The rate of functional progression in MD was weakly correlated with the rate of structural progression in RNFL (Spearman correlation coefficient=0.08, 95% CI: 0.02 to 0.15). For functional progression, most eyes were categorised as slow progressors (88%), while moderate (11%) and fast (1%) progressors were less common (table 1). Online supplemental tables 7−9 show the univariable analysis of demographic, ocular and qualitative phenotype risk factors for being a moderate or fast progressor (online supplemental tables 7−9) and increasing MD progression rate (online supplemental tables 10−12). In multivariable analysis for MD progression rate, faster MD progression was independently associated with higher (better) baseline MD (p<0.0001), higher CDR (p=0.02) and lower BMI (p=0.0004) (table 2). Increased IOP (p=0.004) and the TRIM66 TC variant (p=0.003, females only) were risk factors for being a moderate or fast functional progressor (table 3).

Distribution for the rate of change of mean deviation (MD). The median rate of MD decline was −0.40 (−0.44 to –0.34) dB/year, with baseline MD of −6.26 dB (N=1424 eyes). The majority of eyes were classified as slow functional progressors (88%), while moderate (11%) and fast (1%) progressors were less common.
Discussion
This study investigated the course of POAG progression in African ancestry individuals. We found that both structural and functional progression rates in these individuals were faster than rates reported in other ethnic groups in previous studies. We also identified several risk factors for faster disease progression in our cohort. A deeper understanding of the more rapid progression rates in African ancestry individuals and their risk factors can help to better identify high risk patients and to inform best decisions on treatment choice and escalation.
The median rates of structural and functional decline in our African ancestry POAG cohort were faster than rates reported in most non-African cohorts of POAG patients. In all below comparisons, we used the median rate of progression wherever available; if not reported, we used the mean. Eyes in our study experienced RNFL loss at a median rate of change of −1.60 µm/year, which is almost three times as much as the normal age-related rate of change (−0.52 µm/year).30 33 The Duke Glaucoma Registry and the Diagnostic Innovations in Glaucoma Study reported slower mean rates of decline (−0.76 μm/year and −0.98 μm/year, respectively) in these cohorts, which were primarily white.15 34 Similarly, the median rate of MD loss in the POAAGG cohort was −0.40 dB/year. Studies in predominantly white cohorts, such as the Duke Glaucoma Registry and Portsmouth Visual Field Database, reported slower rates of MD loss (median of −0.15 dB/year for both cohorts).30 35 The African Descent and Glaucoma Evaluation Study reported a mean rate of −0.24 dB/year in black patients.36 Two studies reported faster rates of functional loss in their cohorts (mean of −0.45 dB/year; median of −0.62 dB/year), but both studies included eyes with other forms of glaucoma, making it difficult to draw direct comparisons to our POAG cohort.37 38 These results suggest that African ancestry populations experience more rapid structural and functional progression of POAG than other ethnic groups. Further research is needed to confirm these conclusions as they were drawn from comparison with other cohorts.
There were a wide range of RNFL and MD progression rates among eyes in our cohort. There was a fairly even distribution of structural progression rates among the slow, moderate and fast categories. In contrast, functional progression rates were classified as slow for almost 90% of eyes. Additionally, while almost one-third of eyes were fast structural progressors, only 1% were fast functional progressors. The functional progression rate and structural progression rate were only weakly correlated (correlation coefficient=0.08). These findings emphasise the importance of closely monitoring patients with rapid RNFL decline, even if their visual fields do not show concurrent significant loss. Studies have shown that these individuals are at high risk for severe visual field loss during follow-up.15 It is also important to note that the clinical significance of these categorisations largely depends on a patient’s age and life expectancy. For example, a 50-year-old patient with ‘slow’ progression rates may be at higher risk for vision loss over their lifetime compared with a 90-year-old patient with ‘fast’ progression rates.17
Another important finding from this study was how progression rates relate to baseline RNFL and MD values. We found that thicker baseline RNFL was associated with more rapid RNFL decline and increased risk of being a fast structural progressor. This could be the result of the non-linear nature of glaucoma progression, where progression in eyes with early disease exhibits a steeper slope before plateauing in advanced stages. RNFL thinning is no longer observable through OCT imaging after reaching this ‘floor effect’ in advanced disease, but patients may still experience disease progression.39 Other studies have also reported associations between thicker baseline RNFL and faster rates of RNFL loss, both in healthy33 and glaucomatous eyes.40 On a similar note, our study found that higher (better) MD at baseline was associated with faster rates of MD loss. While some studies have shown that worse baseline MD values were risk factors for progression,10 16 19 studies such as AGIS also found that worse visual fields at baseline were protective against further visual field loss.20 These results may also be due to the steeper slope of glaucoma progression in early disease, when patients have better MD values, before rates flatten in later disease stages.17 Additionally, it is also possible that patients with better RNFL or MD values at baseline received less aggressive interventions, contributing to faster subsequent progression. Interestingly, our study also found that higher (better) MD at baseline was associated with slower rates of RNFL loss, which is the opposite of what would be expected based on the above results. However, it is possible that individuals with less visual field damage at baseline require a higher level of insult to the optic nerve to cause damage and thus have slower structural progression rates.
We found that several well-known risk factors for POAG were associated with faster progression, including elevated IOP and larger CDR. These variables were associated with increased risk of being a moderate/fast functional progressor and with faster rates of MD loss, respectively. Prior studies have shown that higher baseline or peak IOP is a major risk factor for faster visual field decay.16 19 Though IOP control is not always sufficient to slow disease progression, with approximately 30% of patients progressing despite treatment, it still remains an essential component of treatment.41 Increased cupping of the optic nerve is also an important clinical indicator of worsening POAG, as it corresponds to death of retinal ganglion cells (RGCs).42 However, higher baseline CDR was not a major risk factor for POAG progression in most studies in non-black populations. A previous study in our African ancestry cohort found that legally blind glaucoma cases were more likely to have a higher CDR at diagnosis than non-blind glaucoma cases.43 Other studies have shown that CDR is larger in individuals of African descent compared with Caucasians.44 These findings suggest that enlarged cupping at baseline may be a risk factor for disease progression, especially in African ancestry populations.
Interestingly, the only demographic, behavioural or systemic variable associated with progression in this study was BMI. We found that lower BMI was associated with faster rates of MD loss in multivariable analysis. While there have been some conflicting reports regarding the relationship between glaucoma and BMI, the majority of studies have reported either an inverse relationship between these variables45 or no significant relationship.46 47 A study in normal-tension glaucoma patients also found that a lower BMI was associated with faster visual field loss.48 Though the exact mechanisms of this association are not definitively known, some researchers refer to the linear relationship between BMI and cerebrospinal fluid pressure as an explanation. Lower cerebrospinal fluid pressure affects the trans-LC pressure difference gradient, leading to increased deformation of the LC, decreased neuroretinal rim area and increased visual field defects.49 50
Two qualitative variables were associated with structural progression in this study: presence of beta parapapillary atrophy (PPA) (risk factor) and LC baring (protective). Like other qualitative features, both features were observed on stereo disc images by trained graders and recorded on a standardised grading form. Beta PPA was distinguished by marked atrophy of the retinal pigment epithelium and the choriocapillaris, giving a white background with good visibility of choroidal vessels and/or sclera. Our group found that beta PPA was a risk factor for faster RNFL loss, which is consistent with prior studies51–53; some groups suggest that this feature can be a potential diagnostic marker for POAG.54 The LC is the primary site of axonal injury in glaucomatous eyes. Bundles of axons and retinal blood vessels pass from the eye to the neural canal through LC pores, which are specific openings between the laminar cribriform plates.55 In this study, baring of the LC (defined by graders as >3 visible LC pores) was protective against being classified as a fast structural progressor. Several prior studies reported that the number of LC pores does not differ between glaucomatous and normal eyes.56 57 However, most prior studies focused more on the shape and size of LC pores, rather than the quantity, finding that pores typically become larger and more elongated during glaucoma.56 57 More research is needed to understand the association reported in our study. We plan to investigate the shape of LC pores and examine longitudinal changes in future studies.
Finally, we found that females with the TC genotype in the TRIM66 gene were at higher risk of being a moderate or fast functional progressor. In a prior GWAS in our cohort, this gene was associated with case–control status and led to expression in relevant cell lines under conditions of oxidative stress. A subsequent genotype/phenotype study found that this variant was associated with thinner RNFL and larger CDR in males only.26 This protein plays an important role in protection of RGCs against oxidative stress.
This study has several limitations that could affect the results. First, we included glaucoma cases with ≥2 visits with RNFL measurements and ≥2 visits with MD measurements over ≥6-month follow-up. We based these inclusion criteria on the prior literature, with the goal of including as many African ancestry patients as possible; however, we acknowledge that slope estimates can be imprecise (especially for eyes with only two visits), and that this sample may not be representative of the entire POAG cohort. Additionally, patients excluded due to lack of follow-up visits may represent those with worse adherence to treatment and possibly faster progression. Second, we tracked visual field loss by using MD, which is a global measure that is not as sensitive to localised glaucomatous damage. MD values can also be affected by factors beyond worsening glaucoma, such as cataract.58 Third, the results in this study were dependent on the cut-offs used to classify progression rates as slow, moderate and fast. We based these cut-offs on the range of the instruments and prior reports in the literature,30 but fully acknowledge that the percentages in each group would shift depending on the chosen cut-offs. Because there was a low number of eyes in the fast functional progressor group, we needed to combine moderate and fast functional progressors in order to complete the subsequent risk factors analysis. Fourth, some risk factors examined in this study had a large amount of missing data and were not considered in subsequent multivariable analyses, which may limit the generalisability of study findings. Finally, another potential limitation to this paper is that, although the earliest enrolled patients in this cohort have been followed for 12 years, and earliest age of enrolment was 35 years of age to capture early disease, we cannot establish that all patients were at the same stage of disease when we evaluated risk factors for progression.
In conclusion, this study provides important information about the course of POAG progression and its risk factors in African ancestry individuals. We showed that African ancestry individuals experience faster structural and functional progression compared with other ethnic groups. Fast progression was more frequent for structural progression than for functional progression, emphasising the importance of monitoring RNFL OCT results to identify at-risk patients and providing timely treatment in early disease stages. We confirmed risk factors for progression, such as higher IOP, larger CDR and beta peripapillary atrophy, while also identifying lesser-known risk factors, such as the TRIM66 TC genotype and better RNFL and MD values at baseline. Better understanding of the course of glaucoma progression in African ancestry individuals can inform decisions on treatment choice and escalation. Combined with other important factors, such as age, lifetime expectancy and baseline of visual field loss, ophthalmologists can make an informed prognosis of the likelihood of lifetime visual disability for patients—and make every effort to slow progression and delay this outcome.
Data availability statement
Data are available upon reasonable request. Detailed phenotypic data from the Primary Open-Angle African American Glaucoma Genetics (POAAGG) cohort, including the progression data included in this paper, is accessible to interested parties by contacting the corresponding author. All POAAGG genotype files are available from the dbGap database (accession number phs001312.v1.p1; URL: https://www.ncbi.nlm.nih.gov/projects/gap/cgi-bin/study.cgi?study_id=phs001312.v1.p1).
Ethics statements
Patient consent for publication
Ethics approval
This study involves human participants. The study protocol and consent statement were approved by the University of Pennsylvania institutional review board (IRB protocol #812036, continuing review approved on 16 February 2022). All patients provided informed consent. Participants gave informed consent to participate in the study before taking part.
References
Supplementary material
Supplementary Data
This web only file has been produced by the BMJ Publishing Group from an electronic file supplied by the author(s) and has not been edited for content.
Footnotes
Contributors Conceptualisation: RS and JMO'B. Data curation: YC, SZ-G, RL and ED. Formal analysis: YC and G-sY. Funding acquisition: JMO'B. Investigation: RS, SZ-G, RL, HVG, IDR, AR, QNC, EM-E, VA, PSS, ED and JMO'B. Resources: JMO'B. Supervision: ED, G-sY and JMO'B. Visualisation: RS and YC. Writing—original draft: RS. Writing—review & editing: all authors. Guarantor: JMO'B.
Funding This work was supported by the National Eye Institute, Bethesda, Maryland (grant #1RO1EY023557-01) and Vision Research Core Grant (P30 EY001583). Funds also come from the F.M. Kirby Foundation, Research to Prevent Blindness, The UPenn Hospital Board of Women Visitors, and The Paul and Evanina Bell Mackall Foundation Trust.Support also came from Regeneron Genetics Center, the Ophthalmology Department at the Perelman School of Medicine, and the VA Hospital in Philadelphia, PA.
Disclaimer The sponsor or funding organisation had no role in the design or conduct of this research.
Competing interests JMO’B reports income from consulting from Atheneum Partners (New York, New York), Cerner Enviza (Kansas City, Missouri), Calico (San Francisco) and Kantar Health (New York, New York). AR reports a financial relationship with Gyroscope Therapeutics.
Patient and public involvement Patients and/or the public were not involved in the design, or conduct, or reporting, or dissemination plans of this research.
Provenance and peer review Not commissioned; internally peer reviewed.
Supplemental material This content has been supplied by the author(s). It has not been vetted by BMJ Publishing Group Limited (BMJ) and may not have been peer-reviewed. Any opinions or recommendations discussed are solely those of the author(s) and are not endorsed by BMJ. BMJ disclaims all liability and responsibility arising from any reliance placed on the content. Where the content includes any translated material, BMJ does not warrant the accuracy and reliability of the translations (including but not limited to local regulations, clinical guidelines, terminology, drug names and drug dosages), and is not responsible for any error and/or omissions arising from translation and adaptation or otherwise.