Article Text

Abstract
Aims Diabetic retinopathy (DR) is the most common cause of vision loss in the working age. This research aimed to develop an artificial intelligence (AI) machine learning model which can predict the development of referable DR from fundus imagery of otherwise healthy eyes.
Methods Our researchers trained a machine learning algorithm on the EyePACS data set, consisting of 156 363 fundus images. Referrable DR was defined as any level above mild on the International Clinical Diabetic Retinopathy scale.
Results The algorithm achieved 0.81 area under receiver operating curve (AUC) when averaging scores from multiple images on the task of predicting development of referrable DR, and 0.76 AUC when using a single image.
Conclusion Our results suggest that risk of DR may be predicted from fundus photography alone. Prediction of personalised risk of DR may become key in treatment and contribute to patient compliance across the board, particularly when supported by further prospective research.
- Macula
- Retina
- Diagnostic tests/Investigation
Data availability statement
Data may be obtained from a third party and are not publicly available. De-identified data used in this study are not publicly available at present. Parties interested in data access should contact JC (jcuadros@eyepacs.com) for queries related to EyePACS. Applications will need to undergo ethical and legal approvals by the respective institutions.
This is an open access article distributed in accordance with the Creative Commons Attribution Non Commercial (CC BY-NC 4.0) license, which permits others to distribute, remix, adapt, build upon this work non-commercially, and license their derivative works on different terms, provided the original work is properly cited, appropriate credit is given, any changes made indicated, and the use is non-commercial. See: http://creativecommons.org/licenses/by-nc/4.0/.
Statistics from Altmetric.com
WHAT IS ALREADY KNOWN ON THIS TOPIC
The development of diabetic retinopathy in diabetics with no retinal complications may be predicted from fundus imaging.
WHAT THIS STUDY ADDS
Improved results compared with the previous study on the subject.
HOW THIS STUDY MIGHT AFFECT RESEARCH, PRACTICE OR POLICY
The prediction of personal risk may allow doctors to prioritise patients at higher risk as well as impressing on patients the importance of personal diabetes management and awareness.
Introduction
Diabetic retinopathy (DR) is a common retinal vascular complication of diabetes mellitus, which is characterised by retinal microaneurisms, haemorrhages, neovascularisation, and oedema in the retina.1 DR can advance to blindness and is the leading cause of vision loss at the working age. While over 80% of diabetics develop retinopathy of some degree after 20 years of the disease,2 more than 90% of the sight-threatening cases can be treated, if found early, in time to prevent loss of sight.3
Current public health guidelines for individuals with diabetes prescribe screening every 12–24 months for the presence of DR.4 5 Clinical studies have demonstrated that screening can lead to early detection and timely treatment, which ultimately can prevent serious visual impairment and blindness.6 7 While retinal screening is essential for patients with diabetes, it requires a specialised eye exam which is often inaccessible for patients. A large percentage of individuals with diabetes forego retinal exams and present late in the course of the disease.8–11 Early intervention is the key to mitigation of DR risk factors and damage. As such, early detection is the most promising way of mitigating the damages of DR.
Artificial Intelligence (AI) and machine learning have recently been successfully applied to the autonomous diagnosis of referable (more than mild) DR. One FDA-approved AI system reported sensitivity of 87% and specificity of 90%.12 More recently, we reported results of a Pivotal FDA study with 93% sensitivity and 91% specificity for referable DR on images obtained by a desktop device, and 92% and 94% sensitivity and specificity, respectively, on images obtained by a portable camera.13 Additionally, we presented strong efficacy for DR detection using a portable camera on a separate data set.14
Recent work has shown that otherwise ‘normal’ fundus images can be informative and predictive when presented to a machine learning algorithm.15–17 AI algorithms can interpret subclinical information of the retinal anatomy and make predictions about diseases, even those unrelated to the eye—such as chronic kidney disease,15 diabetes,16 and cardiovascular risk factors.17 An additional algorithm was shown effective in predicting progression to wet age-related macular degeneration (AMD) in previously healthy eyes of patients with wet AMD in one eye.18 Furthermore, machine learning algorithms have been trained to predict gender information with high accuracy from mere fundus photography—something previously unattainable with the standard clinical exam.
While some work has been done on finding risk factors for DR, using patient data such as age, haemoglobin A1c (HbA1c) levels, gender, duration of disease, and the like,19 20 clinicians are traditionally unable to predict the development of DR in patients. However, a previous article published findings of AUC 0.79 using a machine learning algorithm to predict DR development over 2 years using fundus photography.21 These findings improved to 0.81 when combined with patient-specific information on risk factors. In this study, we present the development and validation of a first-in-class machine learning algorithm, which predicts the development of future DR from otherwise normal retinal anatomy. The current study improves on previous work by predicting the development of DR over a longer period of time, namely improving the prediction period from 2 to over 3 years, which may be clinically significant. Moreover, these improved results are shown using the same dataset the previous study used, namely the EyePACS data set.
Materials and methods
Data set
We used a data set compiled and provided by EyePACS (http://www.eyepacs.org), a teleretinal DR screening service, comprised of fundus retinal images and expert readings of said images. The data consisted of 156 363 images from 21 730 patients who visited one of the American primary care clinics using the EyePacs system at least two times between 2016 and 2021. Patients with only one visit on file were excluded. The pictures were taken using various cameras (for exact distribution, see online supplemental appendix C). 19.6% of visit pairs were ≤12 months apart, 55% were 12–24 months apart, 19.8% were 24–36 months apart, and 5.5% of visits were ≥36 months apart (online supplemental appendix A). Of the patients, 37% were men and 63% were women or other; mean age was 55 years old (table 1). HbA1C values were collected for 19 375 patients, with mean of 7.98 (for exact distribution, see online supplemental appendix D). All images and data were deidentified according to the Health Insurance Portability and Accountability Act ‘Safe Harbor’ before they were transferred to the researchers. Institutional Review Board exemption was obtained from the Sterling Independent Review Board.
Supplemental material
Key characteristics of the dataset
The data set contained up to six images per patient visit: one macula-centred image, one disk-centred image, and one centred image, per eye. Each eye was graded individually by an expert ophthalmologist for the presence and severity of DR. DR severity (none, mild, moderate, severe, or proliferative) was graded according to the International Clinical Diabetic Retinopathy Scale.22 23
The image categorisation in the current research was simplified to three severity categories by combining categories 3 to 5 into ‘more-than-mild DR’, as only these levels usually necessitate referral to an ophthalmologist and/or medical and surgical management.24 25
In order to prepare the data set for model training and validation, each image was labelled by the maximal DR rating the patient was diagnosed within a time period following the visit. Towards this purpose, each patient visit was rated two times on the DR scale, once for each of the patient’s two eyes. Pairs were then created consisting of all possible pairings of each patient’s visits in a given time period. Values of the pairings were calculated by measuring the difference in DR ratings, and then taking the maximum value. Each time point (visit) was then assigned the highest value from the pairings in which that timepoint was the first, and each image was labelled by that value. Negative differences were disregarded, as the regression cause was unknown: true disease regression, clinical intervention, or misdiagnosis. Models were created for each of the chosen time periods.
For instance, a given patient has visited a clinic n times, once a year: v1, v2, …, vn. The cut-off for the given time period is set at 2 years, resulting in the following n-1 data points: v1 compared with v2 and v3 (taking the maximal difference), v2 compared with v3 and v4 (taking the maximal difference), etc. Further models using this patient’s data are also created, set at different time periods (3 years, 4 years, and so on). For a visual of the data set creation process, see online supplemental appendix K.
There were two reasons for choosing the maximal difference as the label. First, the main clinical value is in predicting whether a patient will develop DR, not in which eye it will be. Second, correlation found between the maximal right and left eye differences was relatively high (0.5), which indicates that difference between the eyes may well be incidental.
Patient and public involvement
Neither patients nor the public were involved in the design, conduct, choice of outcome measures or recruitment for this research. This is due to neither patients nor the public being involved in any stage of this research: as formerly stated, all data were anonymised, and all research was conducted within AEYE Health Inc. Efforts to disseminate this research by members of the public are welcomed and encouraged.
Algorithm development
To evaluate the models’ performance, a random 10% of the patients were designated as the validation set and not used for the training of models. Of these, all images deemed fully gradable were used. Given that this same 10% were used as the validation set across tasks, this choice made the fair comparison of different models and timeframes easier.
In order to train the model, all the datapoints representing a progression were included, and a subset of the negative datapoints was included at a ratio of 2:1.
Models were trained on four different tasks:
Progression among DR patients (mild to more-than-mild).
Prediction of DR development (normal to any DR).
Prediction of clinically significant DR (from non-referable to referable DR).
General progression (progress): any change for the worse in the DR condition.
The model used was a convolutional neural network (CNN) (for full architecture, see supplementary R) with an Adam optimizer and a learning rate of 0.001. The model was trained on two GTX 2080 Ti graphic cards. The hyperparameters for the model training were chosen beforehand, and not changed, to prevent overfitting.
Risk factor predictive value
For 80% of the patients in the data set, HbA1c level was recorded by the clinic, and disease duration was recorded for 98% of patients. HbA1c level and disease duration were treated as risk-level scores. AUC was then calculated in order to rate predictive value for each of the scores, which were then compared with the predictive value of the model on each task (table 2).
The models' score, in AUC, in predicting DR within 2 years
Results
Transitional retinopathy results
The calculated baseline transition odds between different DR levels are displayed in Supplemental Table P (for a more detailed table, see online supplemental appendix B). This is observational data, as regression-related and progression-related factors are unknown; regression may have been caused by clinical intervention, and progression may be understated due to patients who experienced vision loss and, therefore, did not return for subsequent visits.
Prediction results
The model’s performance in determining the risk of mild DR becoming more-than-mild DR is comparable to risk factor-based prediction (area under the receiver operating curve (AUC) 0.65 vs 0.66, respectively). For the other tasks, more images were available (online supplemental appendix I) and performance improved significantly. The results improved still by using all available (up to six) images per patient, which were produced at the same time point, and taking the mean of the scores. The model scored best on the task of prediction of clinically significant DR, with the aggregated score resulting in AUC 0.81 (CI 95% 0.77 to 0.84) (table 2). Additional timeframes and ROC curves are available in online supplemental appendices E–G). As the HbA1c levels and disease duration were not available for all patients, model scores were also calculated for the subsets of patients who had those scores, resulting in effectively the same scores (online supplemental appendix L). The Pearson correlation between our model’s score and HbA1c levels was 0.12 (CI 95% 0.06 to 0.21). Correlation with disease duration was 0.21 (CI 95% 0.22 to 0.30).
To further analyse the model’s prediction value in that task, the empirical risk as a function of the model’s score was investigated (figure 1A). When the model was trained to predict the transition to more-than-mild DR, the top 5% of patients who were highest scored by the model were at 54% risk of getting DR, while the baseline odds in the validation set were 10%—almost a fivefold increase.
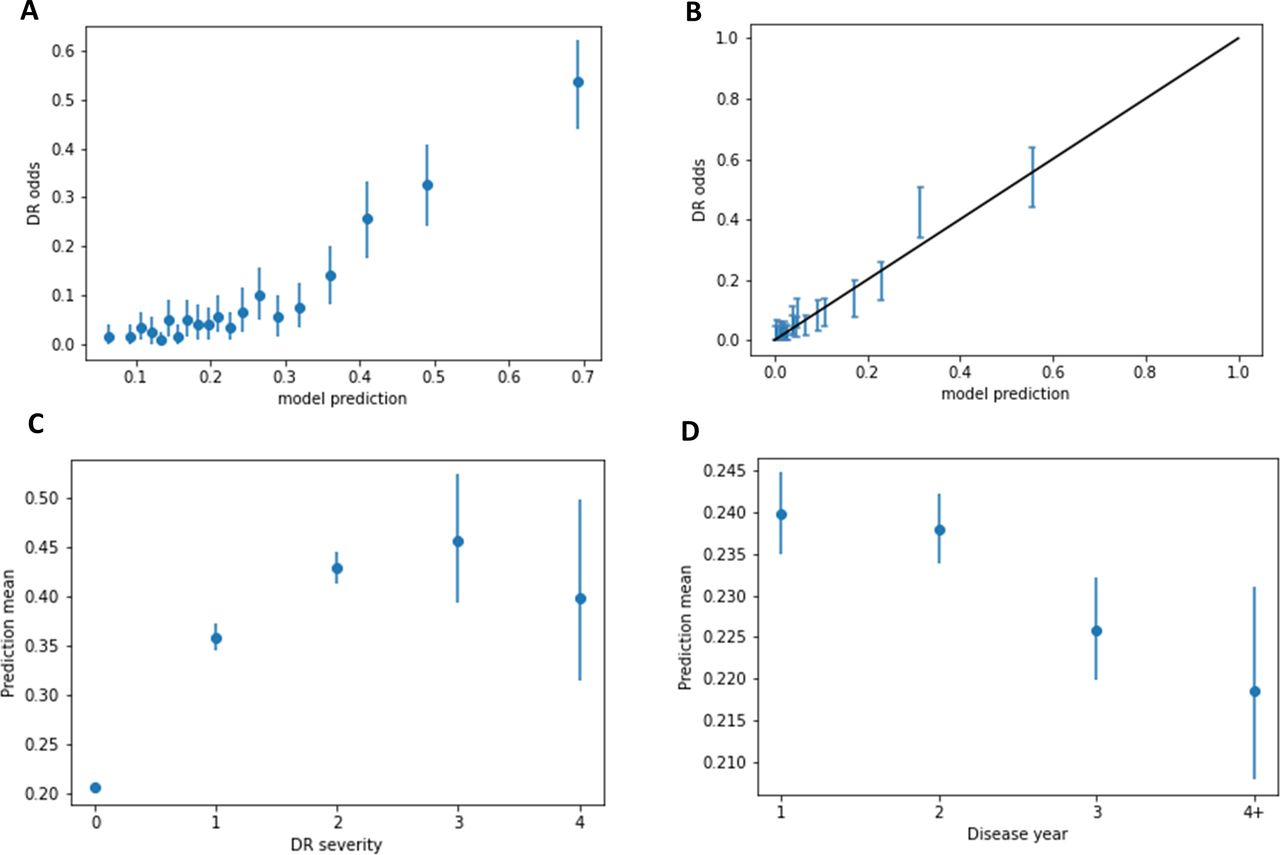
(A) The odds of the patient from a representative sample being diagnosed with clinically significant DR in 2 years, as a function of the model's score. Each dot represents 5% of patients. Additional figures in online supplemental appendix K. (B) The calibration curve showing the fit between the results of the calibration process and the patient’s actual chance of developing mtmDR. Predictions on the calibration dataset were divided into ventiles (5%), after which each the average probability of developing DR was calculated within each ventile. (C) The model's score as a function of the final diagnosed severity of the DR. The model is more confident of future occurrence given higher severity. (D) The model's mean score as a function of how many years after the visit DR was diagnosed. As expected, model average score decreases in accordance with time elapsed between first visit and diagnosis. DR, diabetic retinopathy.
In order to convert the model score into disease probability, the prediction was calibrated by dividing the model’s predictions on the calibration data set into ventiles (1/20) according to the model’s result value, after which each of the average probability of developing DR was calculated within each ventile. The calibration curve (figure 1B) shows the fit between the results of the calibration process and the patient’s actual chance of developing mtmDR. Curve slope is 1.02, intercept is 0.004, with an r2 of 0.95.
In order to further analyse the model’s performance as a function of time, sets of images were split into four groups based on time elapsed between first and second visits and imaging (table 3). In order to analyse the relation between the model’s assigned scores and the severity of developed DR, the scores assigned by the model were averaged and compared across different subgroups; normal patients who were diagnosed with DR up to 2 years after initial images taken were sorted into subgroups based on DR severity. The groups of mild, moderate, and severe DR were score averaged at 0.36, 0.43, and 0.46, respectively (figure 1C). Additionally, model robustness for various subgroups including patient age and camera model was tested (online supplemental appendices M–O).
Comparison of model performance as a function of time
Additionally, the model’s predictive effectiveness regarding the more rapid development of DR was analysed. Assigned scores were averaged and compared across subgroups organised by time elapsed between initial imaging and diagnosis: one, two, three, and four or more years. It was hypothesised that the healthier the eye appeared, the more time would elapse between initial imaging and diagnosis. As expected, the model’s score declined in congruence with time passed before diagnosis (see figure 1D). One example may be seen in figure 2, in which a patient who presented with healthy eyes received a model score in the top 2% of severity, implying more than fivefold the baseline risk of developing more than mild DR in the following 2 years. One year later, the patient was diagnosed with severe and proliferative DR in the right and left eyes, respectively.

Left: the right eye at the first timepoint, rated healthy by a human expert. Right: the same eye one year later, with severe DR. The model score for both healthy eyes was in the top 2% of severity, implying more than fivefold the baseline risk of developing more than mild DR in the following 2 years. One year later, the patient was diagnosed with severe and proliferative DR in the right and left eyes, respectively. DR, diabetic retinopathy.
When compared with the results presented by Bora et al, our model shows an improvement in performance from 0.79 AUC to 0.8221 as well as the ability to predict the development of DR across a longer timeframe, from over 3 and up to 5 years, which may allow for earlier detection and constitute additional clinical significance. Comparison was performed between results presented by each algorithm, which used the same data set. When additional relevant patient metadata was used, the former article improved results to 0.81 AUC. Given the lack of metadata in the data set utilised for this research, results for this model may improve accordingly if validated on other data sets.
Discussion
The aim of this research was to develop a method of predicting the chances of future development of DR, before detection methods can even be applied. Given the relatively high prevalence of DR,2 the difficulty in permanently reversing retinal damage,26 and current patient non-compliance,8–11 prevention and not only treatment of DR is crucial to health outcomes. As such, prediction of individual DR risk may become a key element. Currently, to the best of our knowledge, there are two methods of doing this: risk factor based, which is of limited predictive clinical utility,19 20 and that developed by Bora et al,21 which uses both deep learning and risk factors for optimal results.
The current research was conducted using CNNs, a standard state of the art computer vision algorithm. Such algorithms have been reliably incorporated in multiple medical fields, such as ophthalmology,27 radiology,28 endocrinology,29 and others.30 The algorithms presented in this work, which are easily implemented and display promising performance, may carry widespread implications related to better DR prediction. For instance, given the knowledge that some patients are at very low risk of developing DR, screening may be able to be feasibly reduced according to individual risk levels, reducing strain placed on both patients and medical staff. Furthermore, in high-risk cases which have not yet manifested, patients may be forewarned of impending risk, increasing chances of mitigation and prevention through diabetes management. Bora et al previously demonstrated the ability to predict the development of DR within 2 years.21 The current research is able to predict development within over 3, which may have practical and clinical implications. Due to clinical guidelines recommending routine patient check-ups every 1 to 2 years, the increase in predictive time may decrease the number of screenings required for patients, affording longer periods of time between necessary check-ups.
A lack of patient education regarding the risks of diabetes, and DR specifically, has been cited as a contributing factor in patient non-compliance.8 Furthermore, patients may not attend screenings due to belief that they do not require retinal examinations or treatment as their vision is too good, or their diabetes is too mild to be relevant. The ability to concretely discuss personal risk levels with the patient may do much to mitigate these beliefs, contributing to higher compliance. Improved patient compliance in terms of DR may also improve compliance in terms of general diabetes management, bettering patient outcomes across the board.
One limitation of the current research is that the transition odds are observatory, rather than experimental. As such, there is the possibility of an understatement of risk, given that blinded people likely did not continue to return for check-ups. Odds of regression may similarly be overstated, as regression factors are unknown and regression may have been caused by surgical or medical intervention.
Recommendations for future research include studies on how to incorporate the model into usual diabetes standards of care, in order to better mitigate and prevent DR. As the model’s score was not strongly correlated to risk factor score, there may be added value in including metadata on levels of previously recognised risk factors among patients in order to improve predictive value, as demonstrated in previous studies.21 Additionally, there is great value in examining whether use of this algorithm does, in fact, improve patient compliance. This model may also contribute to future research of DR risk factors and prevention, as at-risk patients with previously unknown risk factors may become recognisable, allowing for a more holistic understanding of contributing influences, both biological and behavioural.
Data availability statement
Data may be obtained from a third party and are not publicly available. De-identified data used in this study are not publicly available at present. Parties interested in data access should contact JC (jcuadros@eyepacs.com) for queries related to EyePACS. Applications will need to undergo ethical and legal approvals by the respective institutions.
Ethics statements
Patient consent for publication
Ethics approval
Institutional Review Board exemption was obtained from the Sterling Independent Review Board.
References
Supplementary material
Supplementary Data
This web only file has been produced by the BMJ Publishing Group from an electronic file supplied by the author(s) and has not been edited for content.
Footnotes
Contributors YR analysed the data, designed the study and conducted research. ZD-A conceived the study and supervised research, and is guarantor of the study. TI provided medical and strategic guidance and oversight. RA wrote and edited the manuscript with input from all authors.
Funding Employees and board members of AEYE Health designed and carried out the study; managed, analysed and interpreted the data; prepared, reviewed, and approved the article; and were involved in the decision to submit the article.
Competing interests Employees and board members of AEYE Health designed and carried out the study; managed, analysed and interpreted the data; prepared, reviewed, and approved the article; and were involved in the decision to submit the article.
Provenance and peer review Not commissioned; externally peer reviewed.
Supplemental material This content has been supplied by the author(s). It has not been vetted by BMJ Publishing Group Limited (BMJ) and may not have been peer-reviewed. Any opinions or recommendations discussed are solely those of the author(s) and are not endorsed by BMJ. BMJ disclaims all liability and responsibility arising from any reliance placed on the content. Where the content includes any translated material, BMJ does not warrant the accuracy and reliability of the translations (including but not limited to local regulations, clinical guidelines, terminology, drug names and drug dosages), and is not responsible for any error and/or omissions arising from translation and adaptation or otherwise.