Article Text

Abstract
Background/aims We previously used archetypal analysis (AA) to create a model that quantified patterns (archetypes (ATs)) of visual field (VF) loss that can predict recovery and reveal residual VF deficits from eyes in the Optic Neuritis Treatment Trial (ONTT). We hypothesised that AA could produce similar results for ON VFs collected in clinical practice.
Methods We applied AA to a retrospective data set of 486 VFs collected in 1 neuro-ophthalmology service from 141 eyes with acute ON and typical VF defects, to create a clinic-derived AT model. We also used the ONTT-derived AT model to analyse this new dataset. We compared the findings of both models by decomposing VFs into component ATs of varying per cent weight (PW), correlating presentation AT PW with mean deviation (MD) at final visits for each eye and identifying residual deficits in VFs considered normal.
Results Both models, each with 16 ATs, decomposed each presentation VF into 0–6 abnormal ATs representative of known patterns of ON-related VF loss. AT1, the normal pattern in both models, correlated strongly with MD for VFs collected at presentation (r=0.82; p<0.001) and the final visit (r=0.81, p<0.001). The presentation AT1 PW was associated with improvement in MD over time. 67% of VFs considered ‘normal’ at final visit had 1.2±0.4 abnormal ATs, and both models revealed similar patterns of regional VF loss.
Conclusions AA is a quantitative method to measure change and outcome of ON VFs. Presentation AT features are associated with MD at final visit. AA identifies residual VF deficits not otherwise indicated by MD.
- Optic Nerve
- Vision
Data availability statement
All data relevant to the study are included in the article or uploaded as online supplemental information.
This is an open access article distributed in accordance with the Creative Commons Attribution Non Commercial (CC BY-NC 4.0) license, which permits others to distribute, remix, adapt, build upon this work non-commercially, and license their derivative works on different terms, provided the original work is properly cited, appropriate credit is given, any changes made indicated, and the use is non-commercial. See: http://creativecommons.org/licenses/by-nc/4.0/.
Statistics from Altmetric.com
WHAT IS ALREADY KNOWN ON THIS TOPIC
Archetypal analysis (AA) is an unsupervised machine learning method that has been used to characterise patterns of visual field loss in optic neuritis (ON) and idiopathic intracranial hypertension using data from randomised control trials.
WHAT THIS STUDY ADDS
This study demonstrates that AA of visual fields (VFs) from eyes with acute ON shows quantifiable patterns of loss and residual defects similar to those found in clinical trials.
HOW THIS STUDY MIGHT AFFECT RESEARCH, PRACTICE OR POLICY
This study demonstrates how the use of AA in clinical practice can add more detail to individual VF assessment and predict the extent of recovery over time.
Introduction
Optic neuritis (ON) is an acute optic neuropathy most frequently affecting individuals 18–50 years of age. Most cases are idiopathic or related to multiple sclerosis,1 but new laboratory methods show at least two additional autoimmune aetiologies.2 Typically, vision loss is abrupt and progresses quickly. Visual field (VF) loss varies widely and is usually present at onset.3 While the degree of VF loss at presentation is often severe, the prognosis for VF recovery is good. In the Optic Neuritis Treatment Trial (ONTT), 51% of patients at 6 months and 56% of patients at 12 months had a normal VF defined by a mean deviation (MD) better than −3.00 dB.4 Neither the severity nor pattern of VF loss at presentation appeared to be a determinant of VF recovery,5 until recent work using machine learning (ML) suggested that quantifiable measures of both a normal and severe global loss pattern at presentation may be predictive. The ML investigation also reported residual deficits, most of which were mild, in 80% of VFs after the episode of ON.6
Global index values and qualitative patterns of VF loss from the ONTT7 showed that trend or event-based analyses can detect changes in VFs performed using standardised automated perimetry. However, global indices such as MD do not reflect regional VF deficits.8 9 Small deficits outside the central 10° may not affect the MD.3 10 11 Recently, we showed the utility of ML analysis of VFs from the ONTT with VFs collected at multiple sites using a standardised protocol and controlled conditions.12 ML has been used to study glaucoma in a clinical setting, but not ON, and ML could provide a quantitative determination of focal and residual VF deficits, as well as reduce the need for expert interpretations.
We applied archetypal analysis (AA) to quantify patterns of VF loss and the changes in these patterns, to VFs collected in a neuro-ophthalmology clinic from eyes with acute ON. AA can detect the common major patterns, or archetypes (ATs), from VFs in a dataset.13 14 Once a disease or dataset-specific model of ATs is derived, each VF can be decomposed into a sum of per cent weights (PWs) of component ATs (totalling 100%). AA uses standardised calculations to quantify and analyse VFs, eliminating subjective descriptive VF assessment. Longitudinal and statistical analysis of disease change and assessment of response to intervention are facilitated using the quantified AT PWs. AA has already been used in previous studies to describe patterns of glaucomatous VF loss and identify disease progression.15–19
This study included VFs from patients diagnosed with acute ON diagnosed using standard criteria.7 We explored whether AA could extract clinically meaningful data from the VFs of a less-well controlled, smaller dataset. We hypothesised that: (1) the clinic-derived ATs would closely resemble ONTT-derived AT patterns, but the relative weights (RWs; a measure of the representation of an AT in the input dataset) of those ATs would change given potential differences between the two datasets; (2) presentation AT PWs would be associated with final visit MD as previously reported for the ONTT VFs6; (3) AA would reveal residual VF deficits at final visit in eyes typically considered ‘normal’ defined by an MD of −2.00 dB or better; and (4) reconstruction analysis and VF decomposition would validate our previous ONTT-derived model.
Methods
The clinic dataset contained 486 24-2 VFs, collected between 2001 and 2021 over the course of 1 year after presentation, from 141 patients first seen within 3 weeks of a first episode of acute ON in 1 eye. All patients except for two had one affected eye. Anti-myelin oligodendrocyte glycoprotein and neuromyelitis optica tests were not available for all patients; no patient in the study appeared to have either of these disorders during the follow-up period, and we excluded all patients with positive NMO or anti-MOG blood studies. No study eye had optic atrophy confirmed by ophthalmoscopy or retinal nerve fibre layer thinning confirmed by ocular coherence tomography (OCT) at the first evaluation. More than 90% of patients were treated with 3–5 days of daily intravenous methylprednisolone at a rate of 1 g/hour.
VF testing was performed using a Humphrey Field Analyzer with 24-2 SITA standard testing (Carl Zeiss Meditec: Dublin, California, USA). Only VFs with fixation loss errors<33% and false-positive errors<15% were included. VF testing was performed once at presentation and repeated at the final visit. Most patients had VF testing at interim visits. Of the 141 patients with a presentation visit, 99 had an interim visit between 1 and 75 days, 65 patients had an interim visit between 75 and 150 days and 85 patients had a final visit between 5 and 12 months.
The mean age of clinic patients (38±10 years; range 17–76) was greater than the subjects in the ONTT (32±6.7 years; range 18–45; p<0.001) due to the ONTT age entry criteria. More than 90% of clinic patients overall and all clinic patients older than 50 years of age had ON confirmed by abnormal gadolinium-enhanced MRI of the orbit.20 The frequency of women was similar for clinic (111/141; 79%) and ONTT (352/457; 77%) subjects (p=0.62).
Archetypal analysis
We used the open-source software package ‘archetypes’ (statistical software package R V.3.6.321) to perform AA on the clinic VFs. Total deviation (TD) values extracted from these VFs were used as input data for the generation of ATs. A set of generated ATs displayed the major patterns of VF loss in the input dataset, along with the average TD and RW for each AT. We used 10-fold cross validation to select the number of ATs wherein the data were divided into 10 even subsets. We used each subset once for the test set, and the other 9 were combined and used as the training set for our model. We calculated the residual sum of squares (RSS) using 2–20 ATs and plotted RSS against the number of ATs. We used the region where the RSS curve began to flatten to determine the number of ATs used in our model (online supplemental figure 1). The three clinicians (RK, LRP and MJK) with expertise in evaluating the VFs reviewed the patterns for the models with 13–18 ATs to ensure the ATs in the model selected all were clinically recognisable. As the 16-AT model we found to be the best fit in our prior study on optic neuritis using the ONTT data,12 and the ATs were all clinically identifiable, we chose a 16-AT model.
Supplemental material
We decomposed each clinic VF into PWs of each AT. The PWs for each AT ranged from 0%–100%, but all PWs added to 100%, such that each VF was entirely described by a combination of various ATs. As in our previous study,6 we deemed an AT PW of ≥7% as clinically meaningful to avoid including low AT PWs that could occur in normal eyes.
Comparison of clinic-derived ATs with ONTT-derived ATs
We calculated the average sum of squared errors (SSE) of VF reconstructions to compare the clinic-derived and ONTT-derived AT models. We performed two separate reconstructions of VFs collected at all visits and at the final visits only. We allocated 10% of the input VFs from the clinic sample as a test set and used the remaining 90% as the training set. We repeated this process using a different non-overlapping 10% of VFs each time to create 10 different training/testing set pairs. We used the ‘predict’ function within ‘ATs’ to extract a matrix representation of TD values for all 16 ATs in each of the 10 sets of ATs. We decomposed each test set VF into PWs of ATs derived from its corresponding training set to generate a vector matrix containing all 16 AT PWs for each test set VF. We multiplied the matrix representation of a set of ATs generated from each training set by the vector matrix of each VF from its corresponding test set to reconstruct the original VF. The resulting matrix product contained reconstructed TD values of all 52 points (excluding the 2 blind spot points). We compared all 52 reconstructed TD values for each VF to the original TD values to calculate an SSE value. We averaged SSE values for each VF to obtain an average SSE value for reconstruction of clinic VFs using the clinic-derived AT set.
To reconstruct clinic VFs using ONTT-derived ATs, we first decomposed them into the ONTT-derived ATs. We used the resulting AT PWs in the same manner as above to calculate an average SSE for reconstruction of clinic VFs using the ONTT-derived AT set. We calculated the average SSE values separately for VFs of eyes with severe (MD<−15 dB), moderate (−15≤MD<−7 dB), mild (−7≤MD<−2 dB) and no (MD≥−2 dB) clinically apparent vision loss.
Determining whether AT PW at presentation is associated with MD at outcome
Using each of the 16 clinic-derived ATs, we explored if AT PW correlated with MD values at presentation and final visits. Based on our prior work showing an association of presentation AT PW and outcome MD using VFs from the ONTT,12 we evaluated whether clinic-derived AT PW at presentation was associated with extent of recovery at the final visit. For this evaluation, we calculated mean presentation AT PW for patients with final visits. Previously we used one SD above the mean to divide patients into two groups12; however, as there were fewer subjects in the clinic dataset, we used the mean as the divider to allow for a similar number of subjects in each group. We divided patients into two groups, one with presentation AT PW above and the other below the mean for each AT. We compared the final MD between the two groups.
Statistical analyses
We performed all statistical analyses using MedCalc and the Python packages NumPy, SciPy and Matplotlib. We set the significance level to α=0.05. We used non-parametric t-test to compare the mean age and mean MD of clinic and ONTT patients. We used χ2 test to compare the percentage of women and percentage of patients with different degrees of VF loss. We used t-test to compare average SSE values of reconstruction of clinic VFs using the clinic-derived and ONTT models. We used Spearman’s method to correlate AT PWs with MD. We used Mann-Whitney U test to compare the average MD at final visit between the two groups divided by the mean presentation AT PW.
Results
Distribution of VF loss clinic patients compared with ONTT subjects
According to the presentation average MD, the 141 clinic eyes had less severe VF loss than for study eyes in the ONTT (average MD= −14.1±10.0 dB vs −21.5±10.2; p<0.001). By the final visit, VFs for both groups had similar average MDs (−3.5 dB for both; p=1.0; table 1).
Comparison of clinic and Optic Neuritis Treatment Trial (ONTT) subject visual fields
16-AT clinic-derived model
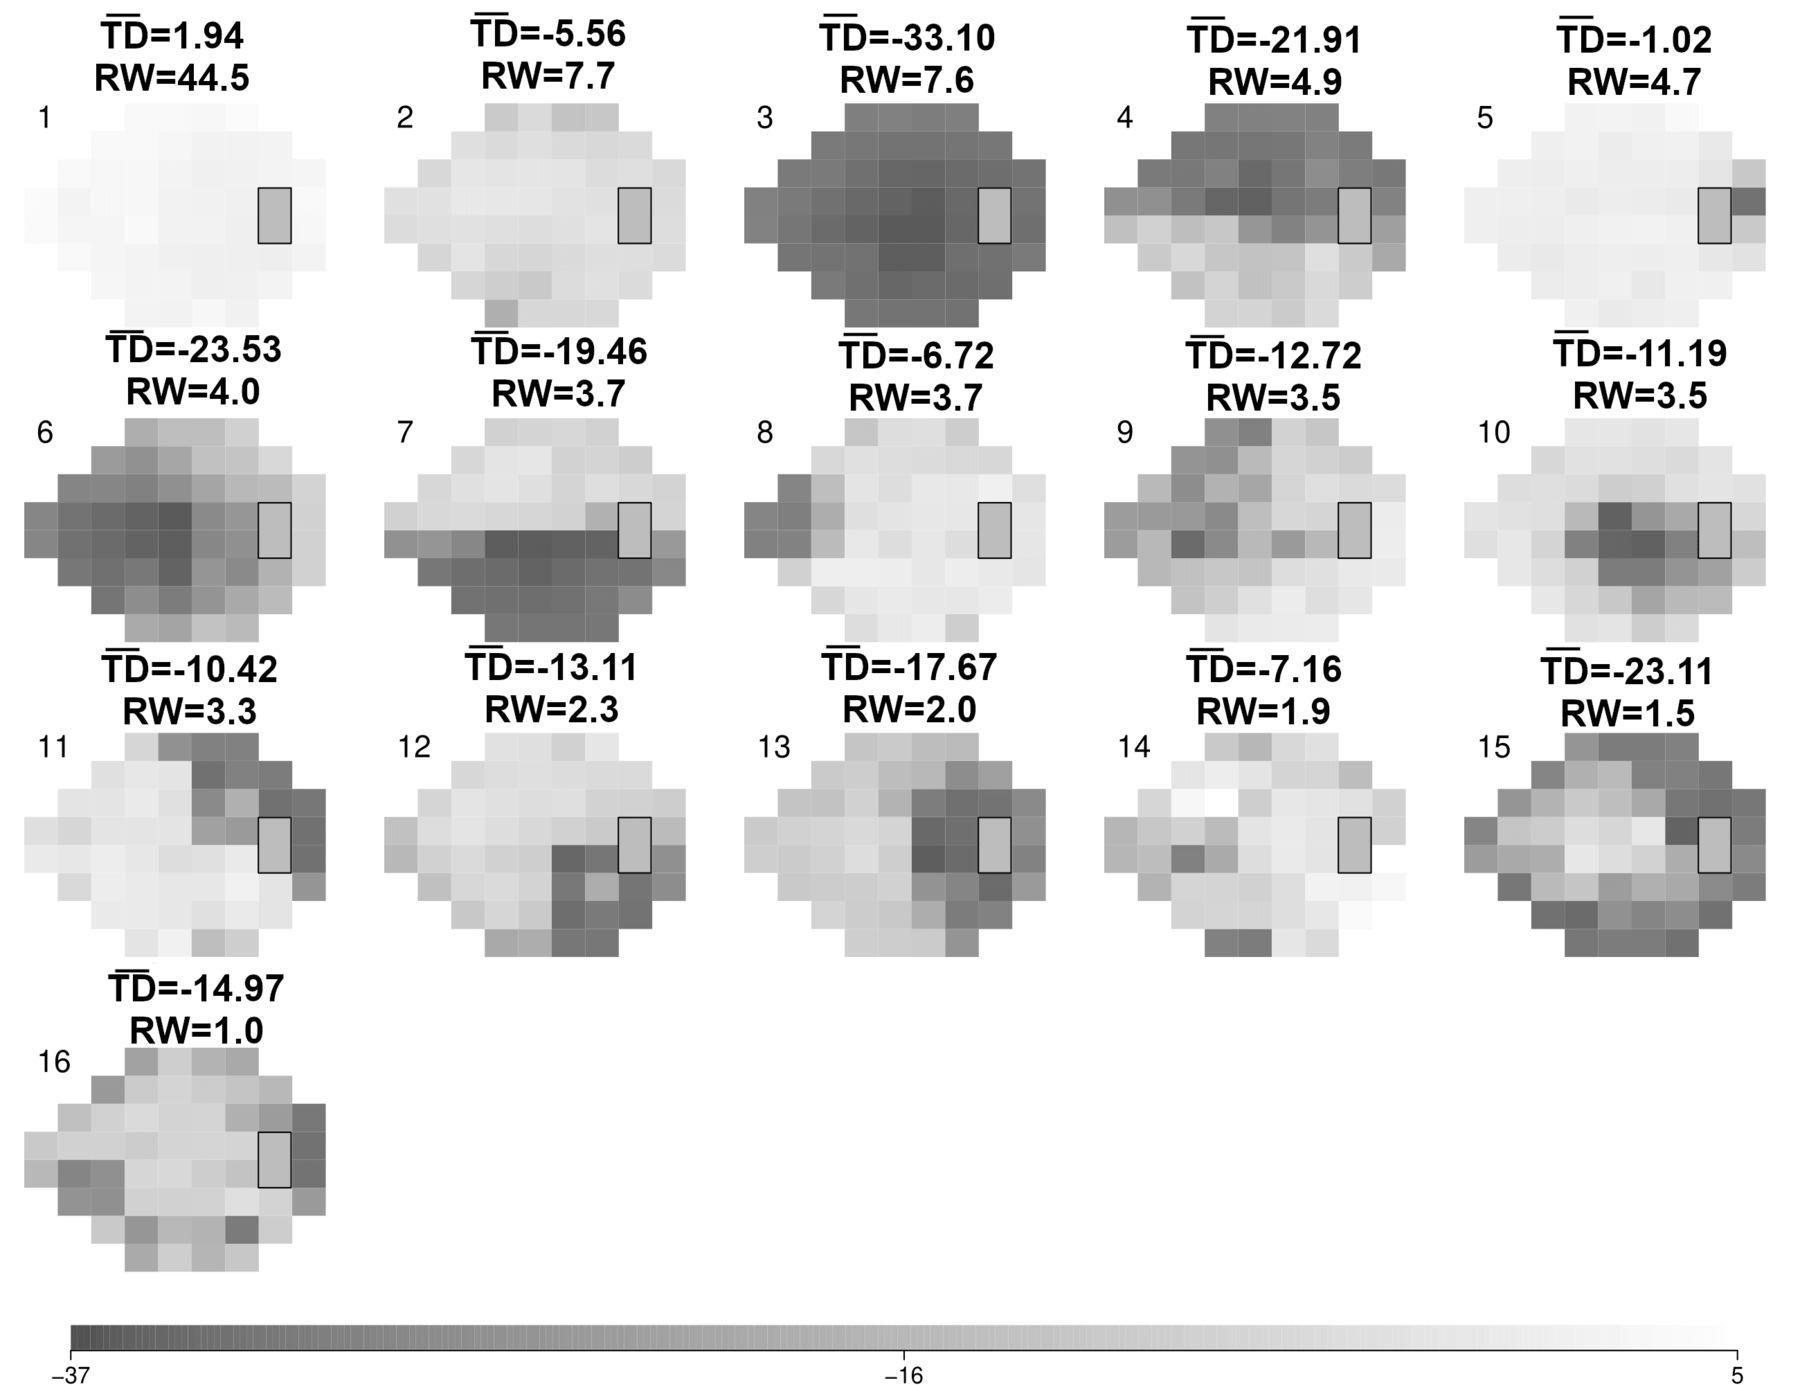
The clinic-derived AT model showed a range of AT patterns typical of ON (figure 1). The clinic-derived 15 AT and 17 AT showed similar patterns in the ATs (online supplemental figures 2–3). The three most dominant ATs were AT1 (‘normal’ vision pattern; RW=44.5; average TD=1.94 dB), clinic-derived AT2 (a pattern of moderate global loss; RW=7.7%; average TD=−5.56 dB) and AT3 (a pattern of severe global loss typically seen at presentation; RW=7.6%; average TD=−33.10 dB).

16-archetype (AT) model derived from the neuro-ophthalmology clinic visual field (VF) dataset. ATs are shown in descending order of relative weight (RW; expressed as a per cent), representing their amount of representation within the dataset. The scale (bottom) denotes total deviation ( ) values (range −37 to 5 dB). Each AT pattern is shown with its corresponding
  and RW value.
The three most dominant ONTT-derived ATs were AT1 (‘normal’ vision pattern; RW=40.2%; average TD=1.97 dB), AT2 (a pattern of severe global loss that resembled clinic-derived AT2; RW=9.4%; average TD=−31.9 dB) and AT3 (a pattern of superior arcuate depression; RW=8.2%; average TD=−6.48 dB). Overall, 11/16 clinic-derived ATs had patterns similar to those seen in the ONTT-derived ATs (online supplemental table 1).
The presentation VFs were decomposed into zero to six (mean of 3.2±1.3) abnormal clinic-derived ATs. Clinic-derived AT1 was the most common AT of meaningful PW among all VFs, occurring in 63/141 (45%) presentation VFs. Clinic-derived AT4 (a pattern of superior altitudinal loss; 45 VFs (32%)) and AT3 (41 VFs (29%)) were the next most frequent ATs of meaningful PW at presentation.
The presentation VFs were decomposed into zero to six (mean of 3.1±1.3) abnormal ONTT-derived ATs of meaningful PW. ONTT-derived AT1 was the most common AT of meaningful PW among all VFs, occurring in 61/141 (42%) presentation VFs. ONTT-derived AT5 (a pattern of superior nasal depression; (54 VFs (38%)) and AT2 (49 VFs (35%)), were the next most frequent ATs of meaningful PW at presentation.
AT PWs compared with MD
For the clinic-derived model, AT1 PW correlated strongly with MD for VFs collected at presentation (r=0.82; p<0.001) and final visits (r=0.81, p<0.001). The average MD values at presentation and final visits were significantly higher for VFs with presentation AT1 PWs above rather than below the mean (table 2, figure 2). The mean AT1 PW at final visit remained significantly higher (p<0.001) for eyes with presentation AT1 PWs above (73.0%; 95% CI: 69.8% to 76.1%) rather than below (52.7%; 95% CI: 41.4% to 63.9%) the mean.
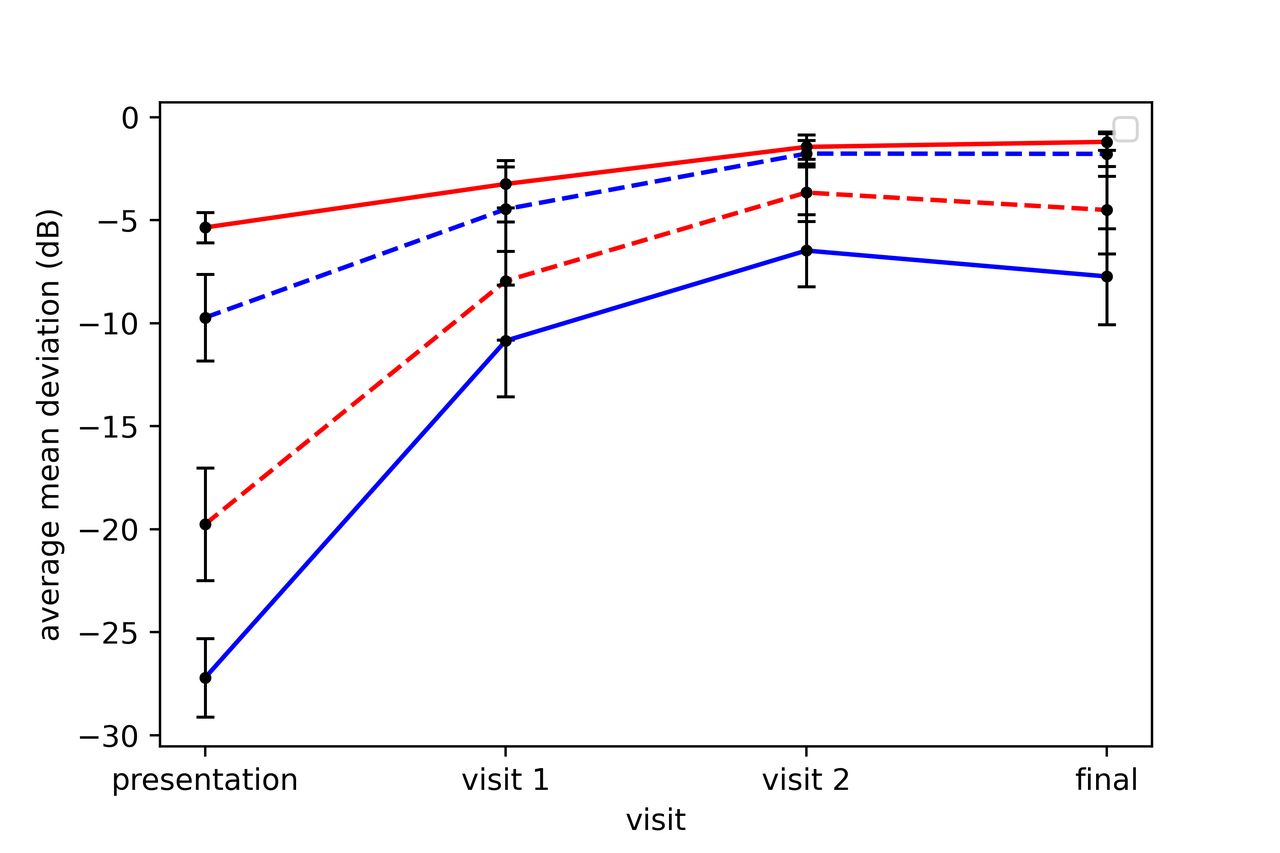
The average mean deviation (MD) (dB) over time for eyes with presentation clinic-derived archetype (AT)1 per cent weight (PW above) (solid red line) and below (dashed red line) the mean and for eyes with presentation clinic-derived AT3 PW above (solid blue line) and below (dashed blue line) the mean. Note as AT3 represents severe visual field (VF) loss, VFs with presentation AT3 PWs below the mean had a better average MD at presentation. 95% CIs are shown in brackets.
The mean presentation AT PWs and average MD values at presentation and final visits for clinic VFs with presentation AT PWs above and below the mean
For the ONTT-derived model, AT1 PW correlated strongly with MD for VFs collected at presentation (r=0.85; p<0.001) and final visits (r=0.88, p<0.001). The average MD values at presentation and final visits were significantly higher for VFs with presentation AT1 PWs above rather than below the mean (table 2, figure 2). The mean AT1 PW at final visit remained significantly higher (p<0.001) for eyes with presentation AT1 PWs above (70.0%; 95% CI: 66.4% to 73.5%; p<0.001) rather than below (54.6%; 95% CI: 44.0% to 65.4%) the mean.
For the clinic-derived model, AT3 PW correlated strongly (inversely) with MD for VFs collected at presentation (r=−0.85; p<0.001), but not at final visits (r=−0.33, p=0.25). The average MD values at presentation and final visits were significantly higher for VFs with presentation AT3 PWs below rather than above the mean (table 2, figure 2).
For the ONTT-derived model, AT2 PW correlated strongly (inversely) with MD for VFs collected at presentation (r=−0.90; p<0.001), and at final visits (r=−0.74, p≤0.001). The average MD values at presentation and final visits were significantly higher for VFs with presentation AT2 PWs below rather than above the mean (table 2, figure 2).
Residual VF deficits in ‘normal’ eyes at outcome using clinic-derived AT model
Of the 51/85 (60%) VFs considered ‘normal’ at the final visit, 34/51 (67%) were decomposed into at least one but no more than two abnormal clinic-derived ATs of meaningful PW (1.2±0.4). The most common abnormal clinic-derived ATs of meaningful PW in the ‘normal’ VFs were clinic-derived AT2 (moderate global loss; 24 VFs) and clinic-derived AT5 (enlarged blind spot; 7 VFs). The ‘normal’ VFs were also decomposed into at least one but no more than three abnormal ONTT-derived ATs of meaningful PW (1.4±0.5). The most common abnormal ONTT-derived ATs of meaningful PW were ONTT-derived AT3 (mild global loss with superior peripheral defect; 23 VFs) and clinic-derived AT4 (mild global loss with superior temporal wedge defect; 10 VFs).
Comparison of clinic-derived and ONTT-derived AT models
For reconstruction of clinic-derived VFs obtained at final visits, the average SSE values for cases of severe (p=0.62), moderate (p=0.58), mild (p=0.47), no (p=0.29) and all severities of VF loss combined (p=0.10) were similar when using the clinic-derived and ONTT models (online supplemental table 2).
Case examples comparing the AA models
Figure 3 shows the decomposition of specific VFs and the measurable change in AT PWs over time using clinic-derived and ONTT-derived AT models. For an eye with severe VF loss at presentation and marked improvement over 2 weeks, both models reveal discrete components of superior temporal and superior nasal loss at 1 week, and superior nasal and inferior temporal loss at 2 weeks (figure 3A). For an eye with moderate VF loss at presentation and improvement at 2 weeks, both models reveal components of superior temporal and central VF loss at 2 weeks (figure 3B).

Case examples of archetype (AT) decomposition of visual fields (VFs) using the clinic-derived AT model (left of each VF representation) and Optic Neuritis Treatment Trial-derived AT model (right of each VF representation). For an eye with severe loss at presentation and change over time, both models reveal superior nasal and superior temporal patterns of loss at one week and superior nasal and inferior temporal patterns of loss at 2 weeks (A). For an eye with moderate loss at presentation and improvement over time, both models reveal superior temporal and central patterns of VF loss at 2 weeks (B).
Discussion
This study demonstrates that AA of a relatively small dataset of VFs collected in an outpatient clinic reveals quantitative patterns of VF loss and changes over time characteristic of ON. Many of these patterns were similar to those reported from the larger ONTT dataset.12 Both the clinic-derived and ONTT models illustrated the same trends in predicting final visit MD in relation to the PW of the normal-pattern and global loss AT. Both models revealed residual VF deficits in 67% of final VFs considered ‘normal’. The decomposed patterns of clinic VFs using both models were similar. Reconstruction of clinic VFs at the final visit using both models yielded similar average SSE values. This suggests that the clinic VFs are a reasonable external test set to validate the ONTT model.
Two dominant AT patterns derived from both models represented a normal VF (AT1 from both sets) and severe global depression (clinic-derived AT3 and ONTT-derived AT2). The lower RW of clinic-derived AT3 compared with ONTT-derived AT2 is expected, since at presentation, the clinic patients had less severe VF loss than the ONTT subjects did. AT1 PW paralleled VF recovery and was similar for both models at the final visit. Clinic-derived AT2, a moderate global depression pattern, did not occur in the ONTT-derived ATs. This is indicative of less severe VF loss in the clinic dataset. The lesser severity of clinic VFs might be due to our 3-week inclusion period possibly missing the nadir of vision loss. Also, the increased availability of spectral domain OCT and advancements in orbital MRI developed after the ONTT now facilitate earlier diagnosis of ON prior to profound vision loss.
Several findings suggest that the clinic-derived AT model is similar to the ONTT model. Numerous patterns of VF loss, revealed in our prior study on the ONTT, re-emerged in our present study of clinic VFs. The VF decomposition of the case examples revealed similar patterns of loss when using both models. The average SSE values for reconstruction of VFs obtained for final visit VFs, using both models, suggest that overall, the models are similar. This is a reasonable assumption, as the average MD was similar for both groups at this time. However, the SSE for the entire dataset differed between the two models (online supplemental table 3), and this was most likely due to the significant difference in MD at presentation between the two datasets. Models naturally vary due to differences in the input datasets; thus, clinics that evaluate many patients with ON can use AA to develop a practice-specific model, which can be updated. It appears that the ONTT-derived model encompasses almost the full range of VF loss seen in ON. Adding the data from the clinic cases with very mild ON will expand the AT model for future analysis of ON.
Since AT1 represents a normal VF and clinic-derived AT3/ONTT-derived AT2 represents severe global loss, we anticipated that AT1 would positively and clinic-derived AT3/ONTT-derived AT2 would inversely correlate with MD over time given that patients with ON tend to have good improvement in their VF over time. Our finding that a higher presentation AT1 PW and lower clinic-derived AT3/ONTT PW correlated with a better final visit MD indicate that these two measures of a presentation VF may be useful prognosticators of eventual recovery. The potential of a presentation VF feature to predict a VF outcome confirms our prior suggestion using the ONTT data.12 The mean AT1 PW closely followed the trend in mean MD over time when using both sets of ATs, reiterating our findings with the ONTT dataset. We could not determine if other ATs might be associated with the final VF results as the RWs for many of them were too small. If AA can predict a functional outcome, it will help guide management by identifying patients who may benefit from treatment that is more intensive.
Although tracking changes in AT PWs over time in VFs as a group offers insight into the dynamics of VFs in ON as a disease, our application of AA to individual cases shows the potential to add more detail to the assessment of individual patient VFs. Our study found that over three-fifths of patients with final visit MD values of ≥−2.00 dB had residual VF deficits. We do not know whether these residual deficits correspond to structural damage to the optic nerve. A previous study reported that MD does not correlate well with the degree of retinal nerve fibre layer thinning in cases of mild VF loss.22 It is possible that AA-determined residual VF loss may be a useful method to identify regional structural damage to the optic nerve.6
The study limitations included using clinic data not collected with the same rigour of a clinical trial. Clinic patients were not matched to those in the ONTT, as we included patients older than 50 years of age. The time between onsets of initial symptoms to presentation in the clinic was extended by 1 week. The number of patients included in our study was smaller. VFs were not collected at specific time intervals. Some patients were lost to follow-up or did not have a follow-up visit until several months after the 6-month endpoint used to determine ONTT outcome.
Other methods could be used to evaluate the VF loss, change in the deficit and identification of residual defects, particularly those limited to more peripheral regions. In prior investigation of the ONTT VFs, AA proved more sensitive for revealing VF loss when the ON attack was over.12 Other algorithms may objectively identify clusters of VFs with similar global indices, but they do not decompose an individual abnormal VF into a series of weighted regional defects. The generation of the weights, as a quantitative rather than a descriptive value, is critical to detecting change over time. The algorithm can be contrasted with a machine classifier where a dichotomous outcome is achieved but it is unclear what features determine the derived outcome.23 This study supports the utility of AA of ON VFs in providing quantitative values for patterns of VF loss and should reduce the dependence on expert descriptive interpretation of these VFs. Future work should include the correlation of residual deficits detected by AA with structural attributes of the optic nerve detected by optical coherence tomography (OCT). Combining both AA and OCT, analysis might provide a better functional measure to correlate changes in VFs with structural changes following an initial attack of ON.
Data availability statement
All data relevant to the study are included in the article or uploaded as online supplemental information.
Ethics statements
Patient consent for publication
Ethics approval
This study and the Optic Neuritis Treatment Trial (ONTT) followed the tenets of the Declaration of Helsinki. The study of clinic patients previously evaluated by the Mount Sinai Neuro-Ophthalmology Service and waiver of informed consent were approved by the institutional review board (IRB) of the Icahn School of Medicine at Mount Sinai. As the ONTT was performed under multiple IRB approvals, a waiver for the study of VFs from the ONTT was approved by the IRB of the Icahn School of Medicine. Because the patients were not available, there was no patient or public involvement in this research.
References
Supplementary material
Supplementary Data
This web only file has been produced by the BMJ Publishing Group from an electronic file supplied by the author(s) and has not been edited for content.
Footnotes
Contributors Each author contributed to one or more of the following: study design, methodology, data collection, data analysis, publication creation and review. Guarantor, MJK.
Funding The New York Eye and Ear Infirmary Foundation, New York, New York; Alfiero & Lucia Palestroni Foundation, Englewood Cliffs, New Jersey; NEI EY032522; Research to Prevent Blindness, New York, New York unrestricted grant to the Department of Ophthalmology; NEI R01 EY015473.
Competing interests None declared.
Provenance and peer review Not commissioned; externally peer reviewed.
Supplemental material This content has been supplied by the author(s). It has not been vetted by BMJ Publishing Group Limited (BMJ) and may not have been peer-reviewed. Any opinions or recommendations discussed are solely those of the author(s) and are not endorsed by BMJ. BMJ disclaims all liability and responsibility arising from any reliance placed on the content. Where the content includes any translated material, BMJ does not warrant the accuracy and reliability of the translations (including but not limited to local regulations, clinical guidelines, terminology, drug names and drug dosages), and is not responsible for any error and/or omissions arising from translation and adaptation or otherwise.