Article Text

Abstract
Objective To identify age-related vascular changes in the optic discs of patients with diabetes with and without signs of glaucoma.
Methods and analysis A total of 2153 eyes of 1797 patients with diabetes without significant retinopathy were monitored with 10 Topcon-NW400 images obtained over 10.27±1.58 years. 571 non-diabetics eyes were selected as controls. Laguna ONhE uses convolutional neural networks to identify optic disc edges, vessels, cup and rim, and provides a glaucoma assessment index—Globin Distribution Function (GDF).
Results In the first image, vessel pixels accounted for 33.88% of the disc area (SD=3.72) in non-glaucoma (DN) and 31.35% (SD=4.05; p<0.0001) in glaucoma cases (DG). This number of pixels was reduced by −0.55% each year (SD=0.77) in the DN and −0.76% (SD=0.86; p=0.0014) in the DG. In the first image, 76.55% of the disc pixels (SD=11.13) belonged to the rim in the DN and 62.05% (SD=11.00; p=0.0014) in the DG, decreasing annually by −0.33% (SD=0.99) in the DN and −0.68% (SD=1.08; p<0.00001) in the DG groups. All rim sectors were reduced over time in the DG group, particularly superotemporal (41°–80°) and inferotemporal (271°–310°). The reduction was smaller in DN, presenting as progressive thickening of the temporal sector (311°–40°). No changes in age were observed in healthy controls.
Conclusion Patients with diabetes show progressive reduction of vessels and neuroretinal rim at the optic disc, which is more intense in association with glaucoma. In the absence of glaucoma, the temporal sector of the diabetic rim was not reduced but thickened, displacing the cup nasally.
- Optic Nerve
- Glaucoma
- Imaging
- Diagnostic tests/Investigation
- Public health
Data availability statement
Data are available on reasonable request.
This is an open access article distributed in accordance with the Creative Commons Attribution Non Commercial (CC BY-NC 4.0) license, which permits others to distribute, remix, adapt, build upon this work non-commercially, and license their derivative works on different terms, provided the original work is properly cited, appropriate credit is given, any changes made indicated, and the use is non-commercial. See: http://creativecommons.org/licenses/by-nc/4.0/.
Statistics from Altmetric.com
WHAT IS ALREADY KNOWN ON THIS TOPIC
There is conflicting evidence about the reduction in the number of vessels of the normal optic disc with age and the higher incidence of glaucoma in diabetics. A reduction in vascular pixels in different areas of the fundus was observed in patients with diabetes.
WHAT THIS STUDY ADDS
Vascular pixels and rim width are reduced over time at the optic disc in most patients with diabetes, except in the temporal sector. This reduction is greater and more generalised in the presence of glaucomatous signs.
HOW THIS STUDY MIGHT AFFECT RESEARCH, PRACTICE OR POLICY
This study will account for the contribution of the vascular impairment of the diabetic optic nerve to glaucomatous damage.
Introduction
Vascular and perfusion alterations have been related to the progression of glaucoma in various ways.1–7 Particularly since the introduction of angiography using optical coherence topography,8 numerous studies have observed a reduction in microvascularisation across the ocular tissue in glaucomatous disease, peripapillary vessels,9 optic disc,10 whole-image vessel density11 or in the macular region.12 13
In addition, this technique also provides information of great interest on other diseases that affect the retinal vascularisation, such as diabetes.14
The Laguna ONhE application, developed in 2013, evaluates the topographic distribution of haemoglobin in the optic disc by analysing conventional colour photographs.15 The application has demonstrated, in several publications, its ability to identify the usual features of glaucoma in fundus images and distinguish them from normal physiology, with high sensitivity and specificity.16–19 In recent years, the method has achieved absolute automation due to the application of convolutional neural networks. Its results are enhanced when associated with perimetry, especially with homogeneity or harmony of the visual field.20
The Health Services of the Canary Islands have a large database of retinographies obtained over the years with the aim of monitoring and controlling the progression of disease in the diabetic population of this region of Spain. Specifically, the Retisalud health unit has more than 60 fundus cameras located in different centres, which facilitated the inclusion of patients that were scattered over several islands, as controls in this study. Only patients without obvious retinopathy were included in the database, while patients with significant diabetic involvement were referred to hospital centres for further treatment and were excluded from the study.
We retrospectively analysed the patient images to observe and detect possible vascular changes within the optic disc. Therefore, we selected a series of patients with relatively equivalent information, to facilitate the differentiation of patients with signs of glaucoma from those without.
The intention of this study was to identify, in a longitudinal way, the existence of vascular and perfusion changes in the optic disc of patients with diabetes. We assessed the constancy and morphological modifications that could occur during the evolution of non-advanced diabetic disease in patients, with and without signs of glaucoma.
Materials and methods
In a retrospective screening for glaucoma in patients with diabetes using the Laguna ONhE application, the vast majority of the population with diabetes in the Canary Islands was evaluated. Specifically, 1 124 885 fundus images obtained from 203 115 patients between 18 May 2006 and 31 March 2021 were analysed. Among them, the cases where 10 useful images were obtained with the Topcon NW400 fundus camera (Tokyo Optical, Japan) were selected as consecutive checks. Patients with significant retinopathy were excluded from this study. Retisalud general doctors attended to the patients without any significant retinopathy recorded in their database. Those requiring strict control (moderate non-proliferative retinopathies) or specific treatment (severe non-proliferative retinopathies, proliferative retinopathies and macular oedema) were monitored by ophthalmologists in their respective areas and hospitals. A group of 571 eyes (315 healthy and 256 glaucoma eyes) from 312 non diabetic participants was used as the control.
Given the nature of this retrospective study and respect for the anonymity of the patients, no written consent was obtained from them. Given the population of the Canary Islands, it can be stated that the vast majority of the participants belonged to Caucasian ethnicities, although individual identification of this aspect was not performed.
The Laguna ONhE application was used to analyse the images using an automated process.20 The method uses several convolutional neural networks to identify the optic nerve and its boundaries, locate the inner edge of the Elschnig scleral ring, recognise the image quality, identify the laterality of the eye, segment the vessels and obtain a haemoglobin distribution map using the colour of the vessels as a pattern. The deep learning neural network that analyses the image quality is programmed to exclude the abnormal optic discs, such as myelin fibres inside the optic disc, myopic gyrate atrophies, optic disc oedema and colobomas. It also identifies the cup and rim sectors, and provides an index called the globin distribution function (GDF), in which a glaucoma discriminator based on deep learning plays an important role. This index identifies glaucoma when the value is below −15 with a specificity of 99%.
Thus, the percentage of pixels corresponding to the vessels and the percentage of pixels corresponding to the tissue can be calculated. In addition, this method estimates the shape and dimensions of the excavation (cup) and sectors of the rim. The changes observed in the morphological and vascular data over time were analysed in this study.
Statistical analyses were performed using the Microsoft Excel 2016 program (Excel. Microsoft, Redmond, Wash, USA), and MedCalc (V.18.9–64 bits; MedCalc software bvba, Mariakerke, Belgium).
Results
The study included 2153 eyes from 1797 patients with diabetes (356 bilateral and 1441 monocular, 941 men and 856 women, 1213 left eyes and 940 right eyes). The average age of the patients at the beginning of the study was 57.23±9.39 years and the duration of follow-up was 10.27±1.58 years. The non-diabetic group consisted of 571 eyes from 312 participants (315 healthy eyes and 256 eyes affected with glaucoma, 248 men and 323 women, 266 left eyes and 305 right eyes). The average age of non-diabetic participants at the time of examination was 57.21±12.99 years (p=0.486 compared with the diabetic group).
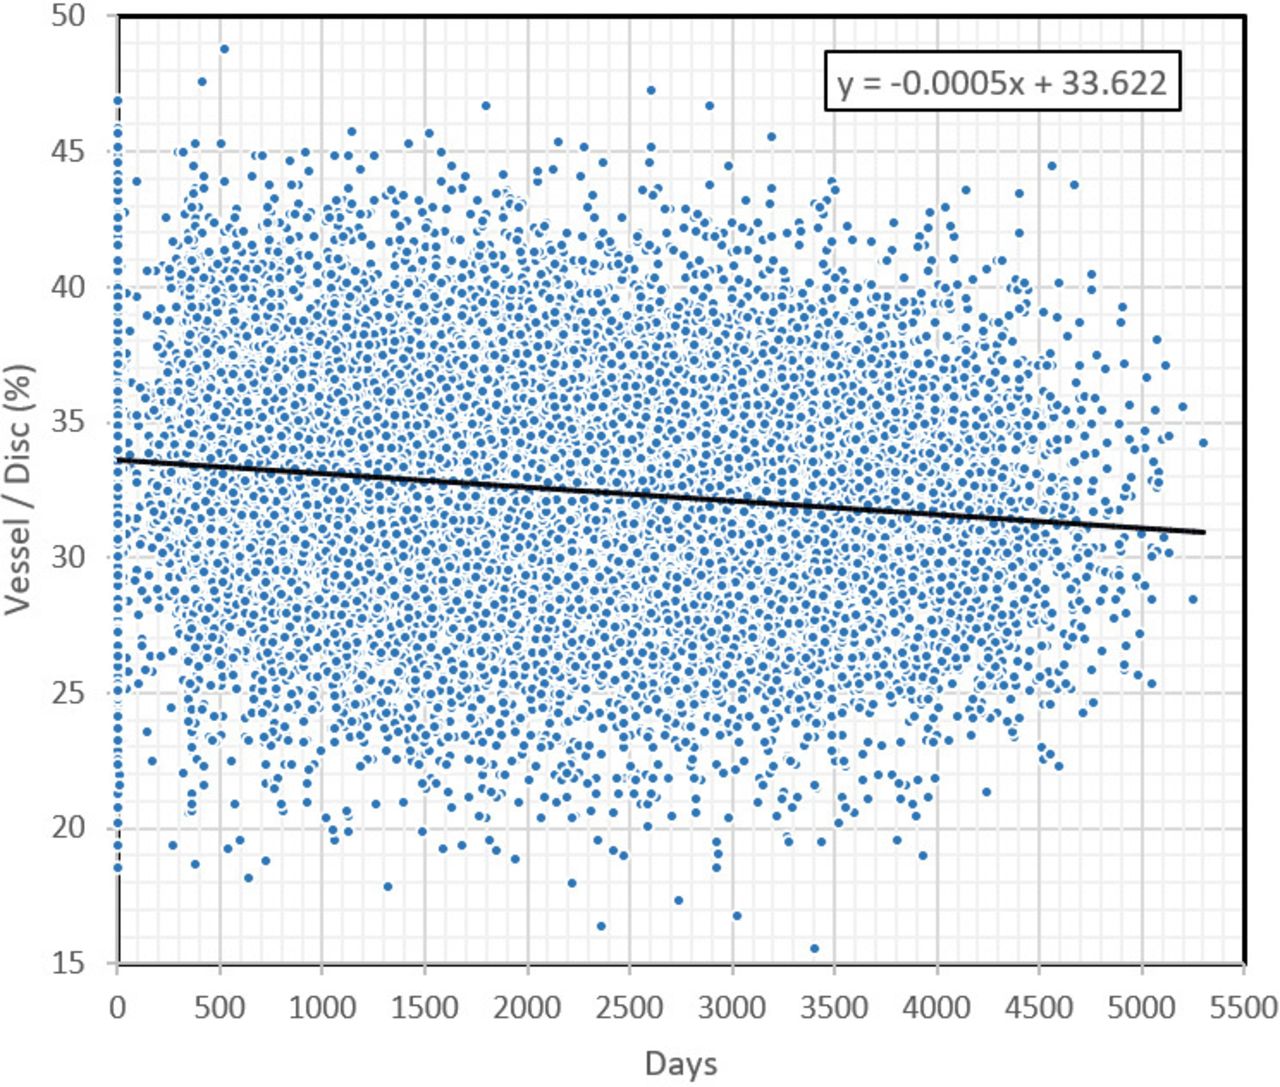
At the beginning of the follow-up, the pixels corresponding to the vessels were assessed for 33.88%±3.72% of the disc area in the 1990 diabetic non-glaucoma subjects (DN) and 31.35%±4.05% (p<0.00001) in the 163 glaucoma patients (DG). The number of pixels was reduced from the initial value by -0.55%±0.77% every year in DN and −0.76%±0.86% (p=0.0014) in DG (figure 1). In the DN group, 79.68% of the cases presented a negative slope in the number of vascular pixels, while in the DG group 82.96% of the cases presented with this slope (p=0.0015).

Percentual evolution of the disc area occupied by vessels. The scatter plot shows the regression line defined by the data for all eyes over the period studied. (r=−0.1561, p<0.0001). The high dispersion of the data is essentially due to the large interindividual variability in size and morphology of the optic disc.
Although women from the DN group were slightly older (57.43 years±9.56) than their male counterparts (56.37±9.33; p=0.0213), the percentage of vessels involved was slightly higher (34.11%±3.64% vs 33.68%±3.77%; p=0.0003) at the beginning of the follow-up. However, the slope of the annual loss was similar in both the cases.
Patients included in the DN group had an initial vertical cup-to-disc ratio of 0.4073±0.1322, while those in the DG group had a ratio of 0.5670±0.1080 (p<0.00001). The annual increments in the DN group were 0.0032±0.0078, while those in the DG group were 0.0039±0.0057 (p=0.0824).
At the beginning of the series, the rim occupied 76.55%±11.13% of the disc area in the DN group and 62.05%±11.00% (p<0.00001) of the disc area in the DG group. This figure decreased annually from the initial value by −0.33%±0.86% in the DN group and −0.68%±1.08% (p<0.0001) in the DG group.
All sectors of the rim reduced over time in the DG group, particularly in the superotemporal (41°–80°o) and inferotemporal (271°–310°) zones. In the DN group, the reduction was smaller in all sectors; however, progressive thickening of the temporal sector (311°–40°) was observed (table 1 and figures 2 and 3). The percentage area of the rim was reduced in 63.90% of the DN cases and 69.26% of the DG cases (p<0.0001).
Annual percentage reduction of rim sector areas (average and SD) in diabetic non-glaucoma subjects (DN) and glaucoma cases (DG) along with the degree of significance (p)

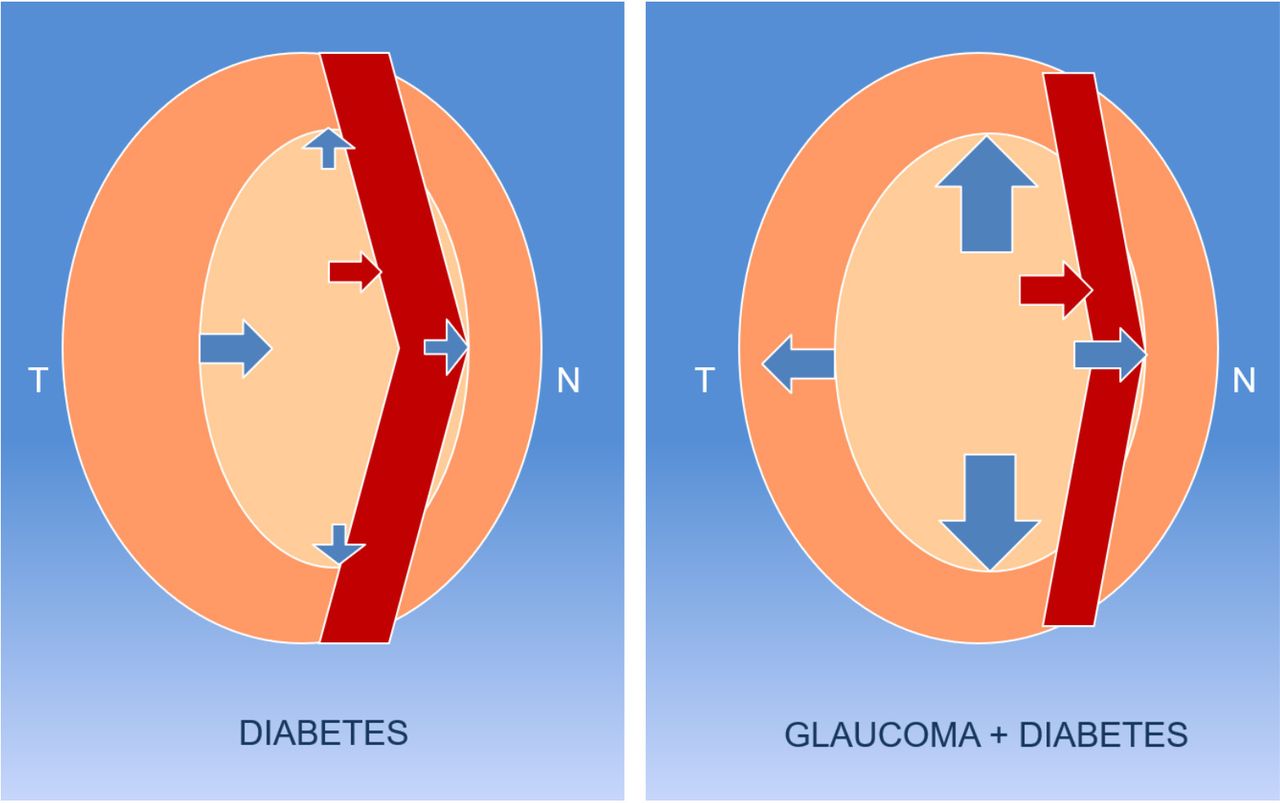
Diagram of vascular and rim changes. In the absence of glaucoma in the diabetic (left image) patients, there is vascular reduction and growth of the cup, with widening of the rim in the temporal (T) sector. On average, in diabetic glaucoma (right image), the vessels are reduced more significantly (red arrows) and the cup widens in all directions, although preferentially in the vertical direction (blue arrows).
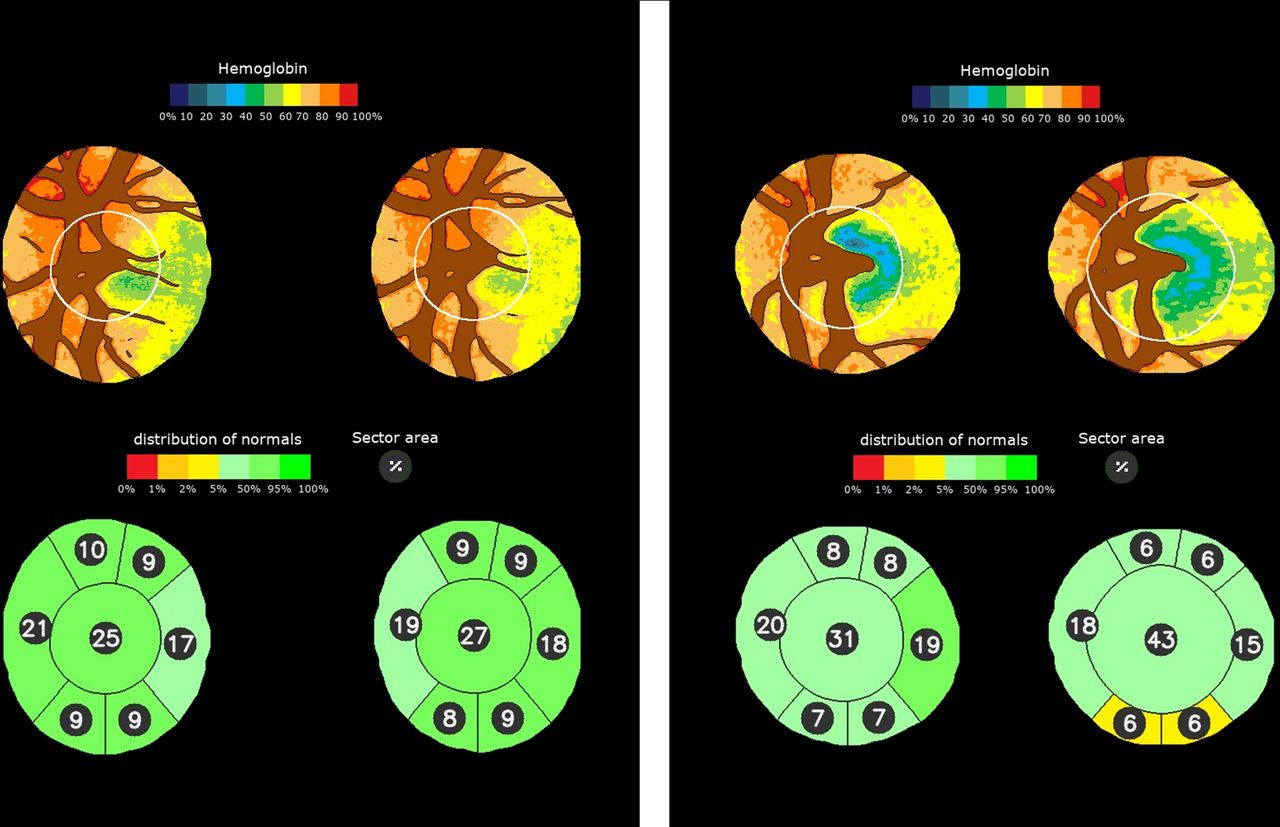
Examples of changes in haemoglobin distribution. The upper images represent the distribution of haemoglobin across the optic disc and the lower images represent the percentage area of the cup and rim sectors. Left: initial and final images of a non-glaucomatous diabetic patient controlled for 7.5 years. Vascular pixels decreased from 30.8% to 29.3%. Right: initial and final images of a glaucomatous diabetic patient controlled for 7.8 years. Vascular pixels decreased from 35.8% to 31.9%.
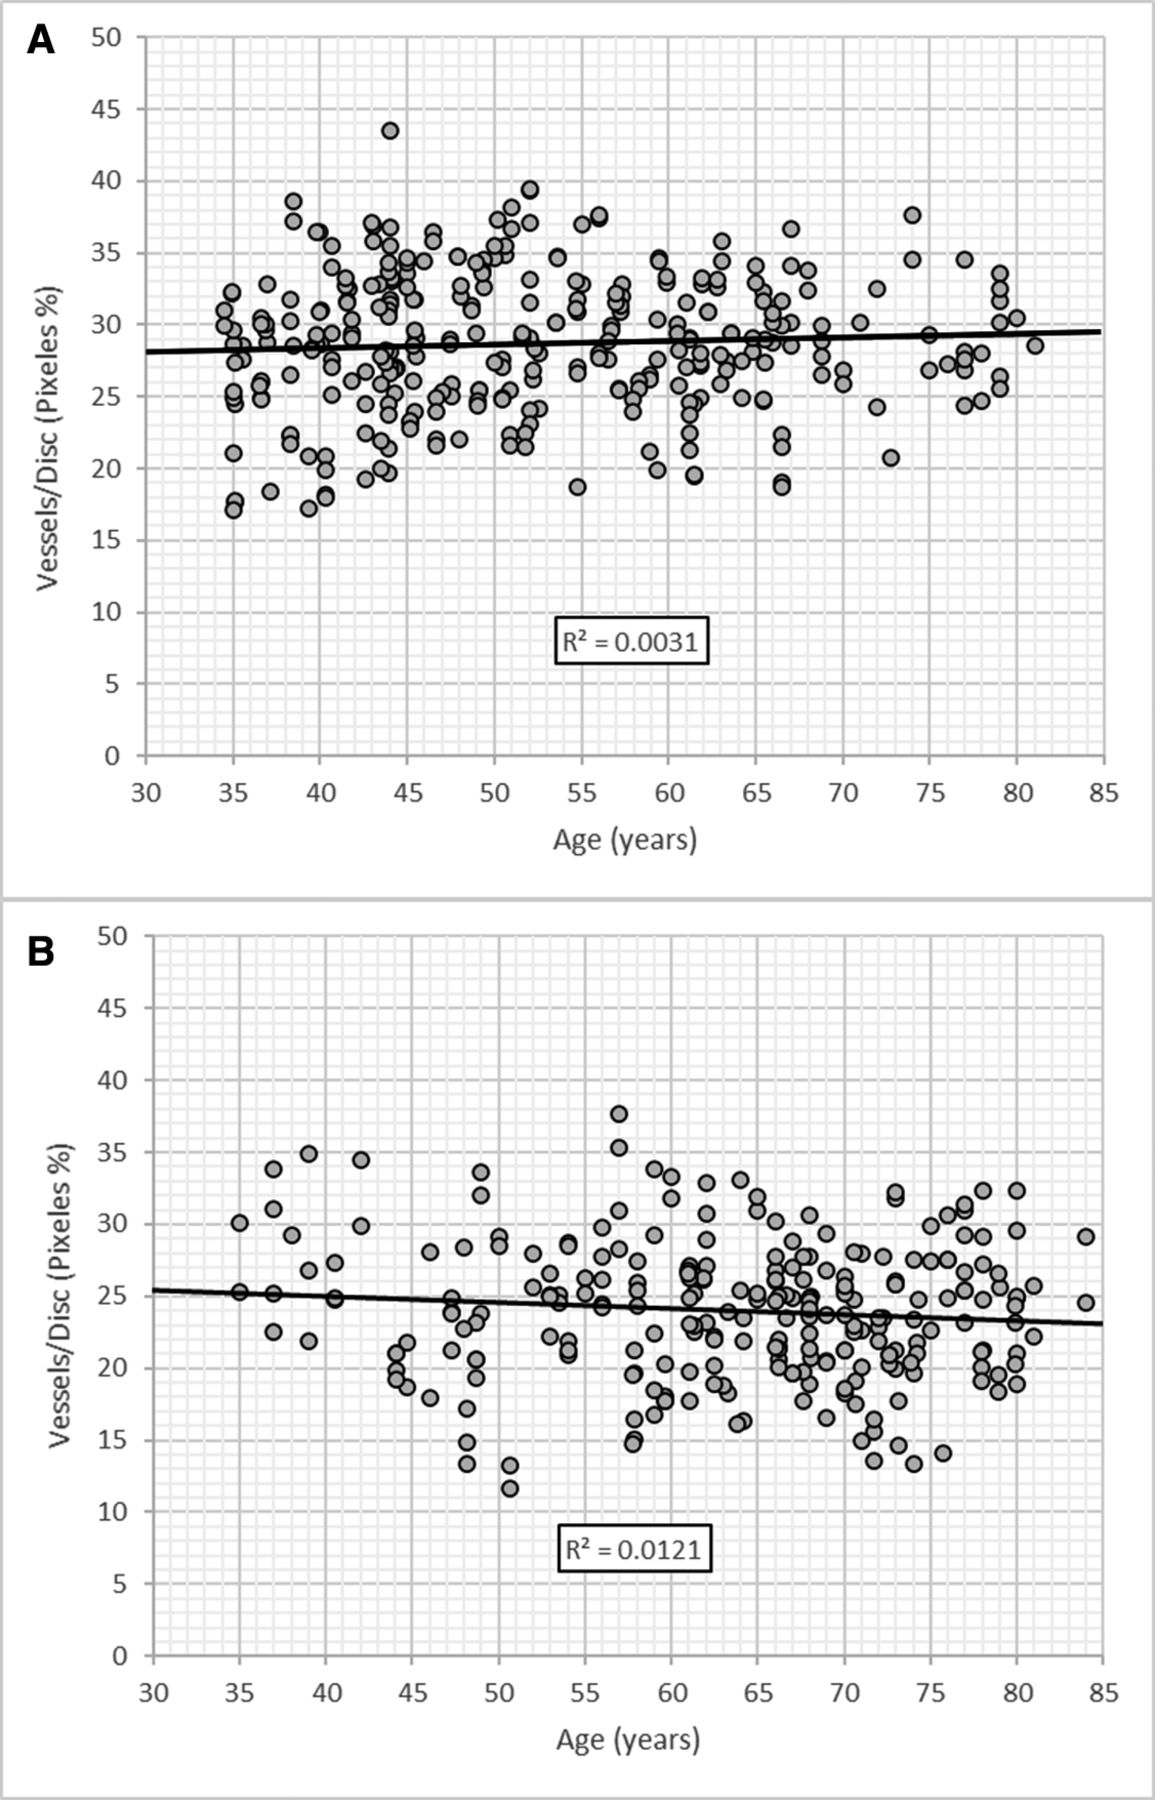
At the time of initial examination, the 1990 diabetic eyes without glaucoma had a correlation coefficient of r=−0.2815 between age and the percentage of vascular pixels (p<0.0001), with a reduction of 0.289% from the initial value per year. In the 315 healthy, non-diabetic eyes, the correlation coefficient was r=0.0557 (p<0.323), showing no vascular reduction with age. The difference in ‘r’ between the normal and diabetic groups was significant (p<0.0001) (figure 4A).

Changes in the percentage of vascular pixels at the optic disc with age. Scatter plots of the percentages of vascular pixels in 315 normal non-diabetic eyes with respect to their age (A) and in 256 glaucomatous non-diabetic eyes (B).
At the time of the initial examination, 163 diabetic eyes with signs of glaucoma had a correlation coefficient of r=−0.2157 between age and the percentage of vascular pixels (p=0.0057), with a reduction of 0.319% from the initial value per year. In 256 non-diabetic glaucoma cases, the correlation coefficient was r=−0.110 (p<0.0001), with a reduction of 0.156% per year (figure 4B).
Discussion
A reduction in optic disc vessels in the glaucomatous subjects when compared with normal subjects has been previously observed using angio-optical coherence tomography (OCT).10 21 A recent review elucidated the need for comprehensive longitudinal studies in this regard.22
The present paper is oriented towards the previous mentioned goal, focusing on longitudinal changes in optic disc vessels in patients with diabetes with and without signs of glaucoma. Vascular reduction in peripapillary vessels has been previously reported in patients with diabetes and is related to the degree of retinopathy.23
We have not been able to observe the vascular reduction with age in our control group, as has been recently described in normal subjects using angio-OCT,24 and is a controversial topic in the literature.25 Our present results seem to corroborate those we have found in a previous study in which no decrease in papillary haemoglobin with age was found in normal subjects.16
The cup of the optic nerve head is one of the most widely used parameters for assessing glaucoma. In particular, its elongation in the vertical direction, usually measured by the vertical cup/disc ratio, has been generalised because an increasing number of objective procedures have emerged, such as stereoscopic photography,26 confocal tomography27 and OCT.28
However, our results showed that this increase is not exclusive to glaucoma. Diabetes also causes a significant increase in excavation with disease progression, probably as a consequence of the vascular defects associated with it. However, this increase has specific characteristics that differentiate it from glaucomatous damage. These differences are manifested mainly by a smaller reduction in the temporal and nasal sectors of the rim, and even by an increase in the thickness of the temporal sector, with a tendency to produce a displacement of the excavation toward the nasal side.
On the other hand, it is also possible that both processes are associated with or potentiate each other. It has been speculated that the higher incidence of glaucoma in the diabetic population could be related to more frequent eye examinations in these patients, and the relationship between both diseases has been suggested in the Blue Mountains study29 and few other studies.30 31
Our results seem to point to the latter direction. Patients with diabetes show a progressive reduction of the vascular calibre at the optic disc throughout their evolution, which is more intense in the case of diabetes associated with glaucoma. Reduction of the neuroretinal rim is also greater in the presence of glaucoma. Thus, the reduction in the calibre of the vessels, which mainly occupy the nasal sector, produces a displacement of the cup towards this side, facilitating the expansion of the temporal sector if diabetes does not concur with glaucoma.
The progression of the vertical cup/disc ratio is similar in both cases; however, it must be considered that the growth possibilities are limited because the residual rim becomes increasingly smaller.
A recent study has shown that the application of Laguna ONhE provides results comparable to those of angio-OCT in relation to glaucomatous optic nerve vascularisation.32 The current study also suggests that the information provided by Laguna ONhE may be useful in the follow-up of other vascular processes such as diabetes.
The main limitation of this study is that the diagnosis of patients with diabetes with signs of glaucoma has not been confirmed in practice. Although previous experiences suggests that a large majority of patients with GDF values below −15 are glaucomatous, this finding should be confirmed in this particular series. Therefore, a prospective study should be conducted to understand the degree of sensitivity and specificity of Laguna ONhE in the near future.
Another limitation is the ethnicity of the population studied. The results of this study may not be fully comparable to other ethnic groups where optic disc morphology, among other factors, may present particularities that need to be evaluated.
Although we did not have the opportunity to make a comparison in a longitudinal series, the two series were analysed at a specific date in subjects with an equivalent age range; it was observed that diabetics showed vascular reduction with age, whereas this could not be observed in non-diabetic subjects without glaucoma. In glaucomatous subjects, this reduction would be smaller in non-diabetic subjects; this data is in line with that obtained using angio-OCT.23
In conclusion, our results suggest that, in diabetes, there is progressive deterioration of the optic disc vessels, as in other parts of the eye. The importance of the vascular component in glaucoma aetiopathogenesis is now being recognised. In the case of patients with diabetes, their own vascular defects converge with glaucomatous defects, favouring optic nerve damage.
Data availability statement
Data are available on reasonable request.
Ethics statements
Patient consent for publication
Ethics approval
The study protocol adhered to the principles of the 1975 Declaration of Helsinki revised in 2013. This study was approved by the Research Ethics Committee of Hospital Universitario de Canarias (CHUC_2018_09 (V4)).
Acknowledgments
The authors are grateful to Unidad Retisalud del Servicio Canario de Salud (Islas Canarias) who provided the infrastructure, database, and images.
References
Footnotes
Collaborators Manuel Gonzalez de la Rosa 1Daniel Gonzalez-Hernandez 1Santiago de-la-Huerga-Moreno 2Francisco Afonso 2Francisco Cabrera 3Alicia Pareja-Rios 4Marta Gonzalez-Hernandez 1-4Groups:1 INSOFT S.L., 2 Retisalud. Servicio Canario de Salud. 3 Hospital Insular de Gran Canaria. 4 Hospital Universitario de Canarias, Spain.
Contributors MGdlR, DG-H, S-d-l-H-M, FA-L, FC-L, AP-R and MG-H contributed to planning the study, analysed the data, provided critical comments and contributed to the final manuscript. In particular, S-d-l-H-M and FA-L organised and provided the images used, and MGdlR and MG-H managed the project. MGdlR is the guarantor.
Funding This study was carried out in part with INSOFT S.L.'s own funds and was partially financed with the European Union FEDER funds. 'A way of doing Europe'. Red.es Project 2020/0720/00098137.
Competing interests DG-H, MG-H and MGdlR participated in the patent rights of the Laguna ONhE method and its partners. The rest of the authors have no conflicts of interest to declare.
Patient and public involvement Patients and/or the public were not involved in the design, or conduct, or reporting, or dissemination plans of this research.
Provenance and peer review Not commissioned; externally peer reviewed.