Article Text

Abstract
Aim To determine whether macular retinal nerve fibre layer (mRNFL) and ganglion cell-inner plexiform layer (GC-IPL) thicknesses vary by ethnicity after accounting for total retinal thickness.
Methods We included healthy participants from the UK Biobank cohort who underwent macula-centred spectral domain-optical coherence tomography scans. mRNFL and GC-IPL thicknesses were determined for groups from different self-reported ethnic backgrounds. Multivariable regression models adjusting for covariables including age, gender, ethnicity and refractive error were built, with and without adjusting for total retinal thickness.
Results 20237 participants were analysed. Prior to accounting for total retinal thickness, mRNFL thickness was on average 0.9 μm (−1.2, –0.6; p<0.001) lower among Asians and 1.5 μm (−2.3, –0.6; p<0.001) lower among black participants compared with white participants. Prior to accounting for total retinal thickness, the average GC-IPL thickness was 1.9 μm (−2.5, –1.4; p<0.001) lower among Asians compared with white participants, and 2.4 μm (−3.9, –1.0; p=0.001) lower among black participants compared with white participants. After accounting for total retinal thickness, the layer thicknesses were not significantly different among ethnic groups. When considered as a proportion of total retinal thickness, mRNFL thickness was ~0.1 and GC-IPL thickness was ~0.2 across age, gender and ethnic groups.
Conclusions The previously reported ethnic differences in layer thickness among groups are likely driven by differences in total retinal thickness. Our results suggest using layer thickness ratio (retinal layer thicknesses/total retinal thickness) rather than absolute thickness values when comparing retinal layer thicknesses across groups.
- Imaging
- Macula
- Retina
Data availability statement
Data may be obtained from a third party and are not publicly available.
This is an open access article distributed in accordance with the Creative Commons Attribution Non Commercial (CC BY-NC 4.0) license, which permits others to distribute, remix, adapt, build upon this work non-commercially, and license their derivative works on different terms, provided the original work is properly cited, appropriate credit is given, any changes made indicated, and the use is non-commercial. See: http://creativecommons.org/licenses/by-nc/4.0/.
Statistics from Altmetric.com
WHAT IS ALREADY KNOWN ON THIS TOPIC
Macular retinal nerve fibre layer and ganglion cell-inner plexiform layer thicknesses are reported to vary across age, gender and racial/ethnic groups.
WHAT THIS STUDY ADDS
Total retinal thickness accounts for most of the variation in retinal layer thickness across groups among healthy individuals. Differences in retinal layer thickness and total retinal thickness are in proportion, so that the relative differences in layer thickness among groups are equal.
HOW THIS STUDY MIGHT AFFECT RESEARCH, PRACTICE OR POLICY
Accounting for total retinal thickness is important for age, sex and ancestral origin-based normative databases of inner retinal thickness and for studies using these retinal layer thicknesses as markers for neurodegeneration. Our findings suggest comparing layer thickness ratio as opposed to absolute layer thickness across groups.
Introduction
Embryologically, the retina is an extension of the central nervous system (CNS). Advances in retinal imaging offer an exciting opportunity to non-invasively visualise neurodegenerative processes and understand CNS disorders.1 2 Inner retinal layers, that is, macular retinal nerve fibre layer (mRNFL) and ganglion cell-inner plexiform layer (GC-IPL) thickness measurements, have been associated with cognitive decline3; neurodegenerative changes in diseases such as Alzheimer’s and Parkinson diseases4 5; and used as markers for early detection and follow-up of inflammation and neurodegeneration in multiple sclerosis.6 7 They are also being investigated as early markers of retinal neurodegeneration in ocular diseases such as diabetes and glaucoma.8–10 Many factors have been associated with mRNFL and GC-IPL thicknesses including age, gender, ancestral background, axial length, refractive error, use of hypertensive medications, body mass index, alcohol intake and social deprivation index.3 11–19 These many associations complicate the use of thickness measurements as biomarkers of disease as there are multiple, often correlated variables that require adjustment. However, these measurements are an important non-invasive method to quantify neurodegenerative changes. In diversity outbred mice, GC-IPL thickness correlated better with optic nerve axonal count than any other ganglion cell metric.20 To fully use mRNFL and GC-IPL as possible markers of neurodegeneration, it is important to appropriately adjust for confounders. We therefore need to know the relative contribution of factors to the variation in mRNFL and GC-IPL thicknesses.
A recent study by Khawaja et al19 evaluated factors associated with mRNFL and GC-IPL thicknesses among UK Biobank participants. They identified novel factors such as social deprivation index and alcohol intake as being independently associated with mRNFL and GC-IPL thickness measurements. When considered together, the predictor variables examined in their study explained about 6.7% of the variation in mRNFL and 11.2% of the variation in GC-IPL, suggesting that there were additional unidentified factors that may contribute to the variation in thickness measurements.
A potentially important factor related to mRNFL and GC-IPL thicknesses is total retinal thickness. Many of the same factors such as age, ancestral background, gender, axial length and refractive error affect total retinal thickness and thicknesses of mRNFL and GC-IPL.21–23 Yet, to the best of our knowledge, the influence of total retinal thickness on variation of mRNFL and GC-IPL thicknesses has not been previously evaluated. We hypothesise that total retinal thickness is a large contributor to the variation in mRNFL and GC-IPL thicknesses. If confirmed, this would imply that many factors believed to directly affect mRNFL and GC-IPL thicknesses may in fact do so indirectly through their effect on total retinal thickness. To thoroughly investigate mRNFL and GC-IPL thicknesses as potential early biomarkers of neurodegenerative diseases, it is important to (1) know the normal thickness values among healthy individuals across age, gender and ethnic groups, and (2) evaluate the main factors contributing to the variation in thickness measurements. The purpose of our study was to test our hypothesis.
Methods
Study population
The UK Biobank is a large population-based cohort of over 500 000 participants.24 Detailed study protocols are available online (http://www.ukbiobank.ac.uk/resources/ and http://biobank.ctsu.ox.ac.uk/crystal/docs.cgi). Briefly, from 2006 to 2010, all residents of the UK, between the ages of 40 and 69 years, who were registered with the National Health Service were invited to participate. Participants initially completed a baseline questionnaire related to demographics, medical history, medication use, as well as lifestyle. This was followed by a verbal interview by a nurse, physical examination, blood draw and additional measures.24 Ophthalmic assessment was added in 2009 for selected assessment centres. This included measurement of visual acuity, intraocular pressure (IOP), refractive error, fundus photos and spectral domain-optical coherence tomography (SD-OCT) scans.
Retinal imaging in the UK Biobank
Macular-centred SD-OCT volume scans were acquired using the Topcon 3D OCT-1000 Mark II (Topcon GB). The SD-OCT image acquisition protocol has been described in detail in a previous publication.25 Participants who had an eye infection or any eye surgery within the previous 4 weeks did not undergo any ocular measurements. For this study, we used the extensively validated Iowa Reference Algorithm software V.3.8 to determine: (1) total retinal thickness, (2) mRNFL thickness, and (3) GC-IPL thickness.26–28 Original image files were downloaded from the UK Biobank servers for image analysis.
Two automated measures of image quality were used: (1) undefined region and (2) surface cost. Undefined region quantified the percentage area of a scan that had missing data or insufficient signal. Images with undefined region >0% were excluded from analysis. Surface cost was calculated using edge-based costs of the dark to bright and bright to dark transitions of the retinal sublayers. This is an inverted Gaussian-smoothed gradient magnitude of the OCT voxel intensities of the retinal sublayers. A lower value corresponds to more reliable segmentation.29 We randomly evaluated 100 OCT scans with a range of surface cost values and determined that scans with surface cost values >62 000 had unreliable segmentation. Subsequently, all scans with surface cost values >62 000 were excluded. For the remaining OCT images, any scans with thickness measurements of 2 or more SDs above or below the mean were manually reviewed. Scans with incorrect segmentation, poor signal or presence of pathology such as epiretinal membrane, macular oedema, vitreomacular traction, drusen, intraretinal or subretinal fluid, pigment epithelial detachment or decentration that could impact thickness measurements were excluded.
Inclusion and exclusion criteria
All UK Biobank participants who had SD-OCT measurements of sufficient image quality as described above were considered for inclusion in the study. We excluded participants with any known ocular or systemic disease that could impact thickness measurements. We used self-reported history of disease and medications, nurse interview and diagnosis codes to exclude participants with cardiovascular disease (ie, hypertension, heart diseases including chronic ischaemic heart disease); neurological diseases; eye disease including cataract, chorioretinal disease, optic nerve disease, retinal detachments, glaucoma (or glaucoma suspect/ocular hypertension based on IOP >21 mm Hg in either eye) and blindness/low vision; and eye injury or trauma resulting in loss of vision, intraocular surgery, logarithm of the minimum angle of resolution visual acuity worse than 0.3 (Snellen 20/40 equivalent), extremes of refractive error (more than ±6 dioptres) and extremes of IOP (<5 or >21 mm Hg). We used information from cognitive testing to identify and exclude those with cognitive impairment, as has been previously described.3 We excluded participants with diabetes mellitus (DM), pre-diabetes, gestational diabetes and HbA1c >6.5%. A previously validated procedure was used to determine DM status based on self-reported DM diagnosis, use of DM medications and presence of DM complications.30 If both eyes were available for inclusion, the right eye was selected. We followed the Advised Protocol for OCT Study Terminology and Elements recommendations for reporting our findings.31
Statistical analysis
We first performed a descriptive statistical analysis regarding the normative distribution of mRNFL and GC-IPL thicknesses. Linear regression models were then used to evaluate the relationships of factors with average mRNFL and GC-IPL thicknesses. We report p values from F tests of nested models when reporting on variable-level effects (may include multiple coefficients for factor variables such as ancestral background), and t-test when reporting on coefficient effects. The reported proportion of variation accounted for was the increase in R2 reported as a percent. To determine the impact of accounting for total retinal thickness, multivariable models were built with and without total retinal thickness. A p value <0.05 was considered statistically significant. The analysis was performed using R V.4.1.1 (https://www.r-project.org/).
Results
There were a total of 84 460 participants in the UK Biobank with macula-centred SD-OCT images available for analysis. A detailed list of numbers and reasons for exclusion is summarised in online supplemental eTables 1 and 2. Subjects who were excluded were more likely to be older (58.4 years vs 54.7 years), less likely to be women (51.5% vs 60.7%) and less likely to be white (90.7% vs 93.2%). A total of 20 237 participants were included in the analysis. Average age of the included participants was 54.7 years (±8.1); over half were women (60.7%); 93.2% self-reported as white; and 2.7% as Asian and 0.5% as black. Information about these participants is summarised in table 1.
Supplemental material
Demographic and clinical features of the study population (n=20 237)
mRNFL and GC-IPL thickness measurements in healthy adults
The distribution of mRNFL and GC-IPL thicknesses is shown in the histogram in online supplemental eFigure 1. The mean (SD) thickness of the RNFL was 30.3 μm (3.4) and of GC-IPL was 71.2 μm (5.9) among all the participants in our study. Mean thickness of mRNFL and GC-IPL varied by age, gender and ancestral background and is summarised in table 2. When mRNFL and GC-IPL thickness measurements were expressed as a percentage of total retinal thickness, the value was fairly consistent across age, gender and ancestral background with RNFL thickness ~10% and GC-IPL thickness ~20% of total retinal thickness. There was a linear correlation between total retinal thickness and both mRNFL and GC-IPL thicknesses (online supplemental eFigure 2).
Supplemental material
Supplemental material
Average retinal layer thickness among age, gender and ethnic groups
Factors contributing to mRNFL and GC-IPL thickness measurements
The association between variables and mRNFL and GC-IPL thicknesses on univariable regression is shown in online supplemental eTable 3. Although a number of associations are statistically significant (p<0.05), they only explained a relatively small fraction of the variation in thickness measurements. The variables that explained more than 1% of the variation in mRNFL thickness were spherical power/spherical equivalent (3%) and total retinal thickness (16%). For GC-IPL, the variables that explained more than 1% of the variation were age (2%), spherical power/equivalent (3%) and total retinal thickness (55%).
Multivariable model outputs with and without adjusting for total retinal thickness
Multivariable models evaluating factors associated with mRNFL and GC-IPL thicknesses showed different coefficients and p values depending on whether or not total retinal thickness was accounted for in the model (table 3). Factors for which the beta coefficient changed from negative to positive (or vice versa) or statistical significance changed, for either mRNFL or GC-IPL thickness, are highlighted in bold. Association between reported ancestral background and layer thickness was no longer statistically significant once total retinal thickness was adjusted for in the model. For GC-IPL thickness, the beta coefficient for sex changed direction when total retinal thickness was added. Factors significant after total retinal thickness was added to the model were: sex, age, spherical equivalent, glycated haemoglobin, systolic blood pressure and visual acuity for mRNFL; and sex, age, alcohol intake three to four times a week compared with never, visual acuity and spherical power for GC-IPL. Table 4 shows the percent variation in mRNFL and GC-IPL thicknesses explained by each covariable in multivariable models with and without total retinal thickness. The variation in mRNFL explained by the multivariable model including total retinal thickness was 24.7%. Refractive error and total retinal thickness accounted for most of this variation: 6.9% and 20.3%, respectively. The variation explained by each of the evaluated variables, including age, sex and ancestral background, was less than or equal to 1%. The variation in GC-IPL explained by this multivariable model was 55.7%. The variation explained by total retinal thickness in this model was 47.5%. The variation explained by each of the evaluated variables, including age, sex and ancestral background, was less than 1%.
Multivariable models with and without adjusting for total retinal thickness
Contribution of each factor to variation in layer thickness
Impact of accounting for total retinal thickness on association between ancestral background and retinal layer thickness
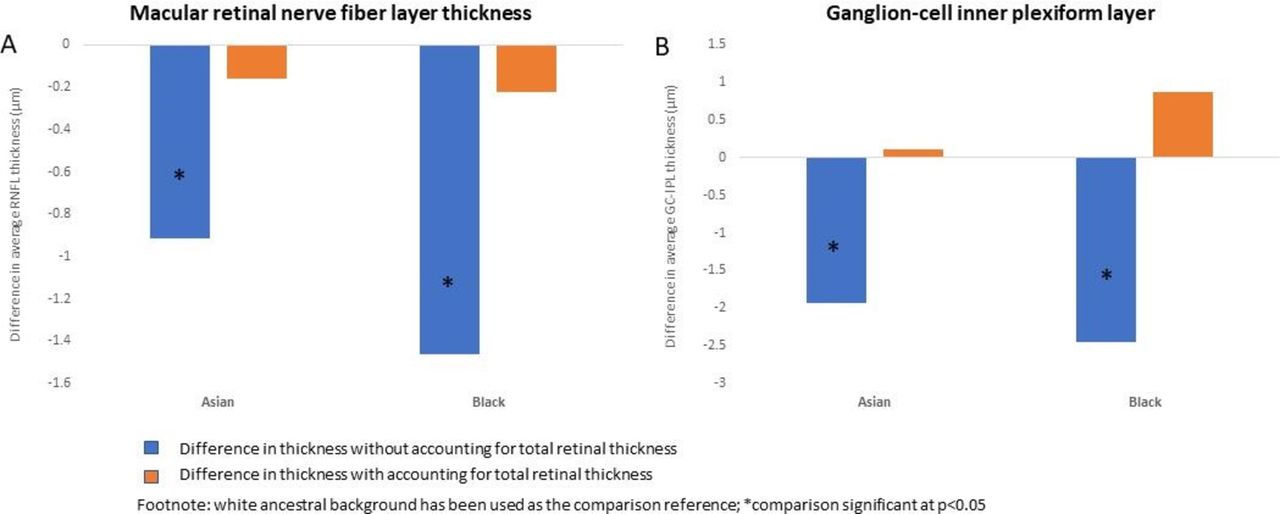
Figure 1A,B summarises the changes in coefficient and level of significance when mRNFL and GC-IPL are compared across ancestral backgrounds with and without accounting for total retinal thickness. Prior to accounting for total retinal thickness, mRNFL thickness was on average 0.9 μm (−1.2, –0.6; p<0.001) lower among Asians and 1.5 μm (−2.3, –0.6; p<0.001) lower among black participants compared with white participants. Prior to accounting for total retinal thickness, the average GC-IPL thickness was 1.9 μm (−2.5, –1.4; p<0.001) lower among Asians compared with white participants, and 2.4 μm (−3.9, –1.0; p=0.001) lower among black participants compared with white participants. After accounting for total retinal thickness, there was no longer a significant difference in mRNFL or GC-IPL thickness among groups from self-reported white, black or Asian ancestral backgrounds.

(A) Difference in average macular retinal nerve fibre layer (mRNFL) thickness (µm) among people from different ancestral backgrounds. (B) Difference in average ganglion cell-inner plexiform layer (GC-IPL) thickness (µm) among people from different ancestral backgrounds. White ancestral background has been used as the comparison reference; comparisons significant at p<0.05 are marked with an asterisk.
Discussion
In this large population-based study from the UK Biobank, we obtained normative mRNFL and GC-IPL thickness values in a cohort of over 20 000 individuals. Our findings provide an important reference for comparison as these types of inner retinal thickness measurements are being increasingly investigated as potential non-invasive biomarkers of neurodegeneration.4–7 9 10 32 Additionally, we quantified the relative contribution of various factors towards variability in thickness. Many factors have been reported as significantly associated with inner retinal thickness measurements. However, accounting for all these factors is challenging and may not be necessary as they contribute relatively little to the variation in layer thickness. Our results suggest that most of the variation in layer thickness is accounted for by relatively few factors. These include refractive error and total retinal thickness.
A recently published paper from the UK Biobank, which considered multiple factors affecting mRNFL and GC-IPL thickness measurements, but did not evaluate the contribution from total retinal thickness, reported that the predictor variables examined in their study together explained 6.7% of the variation in mRNFL thickness and 11.2% of the variation in GC-IPL thickness.19 We found that after accounting for total retinal thickness, we could explain about 25% of the variation in mRNFL thickness and about 56% of the variation in GC-IPL thickness. The majority of this variation was explained by total retinal thickness, yet this important factor has not been accounted for in prior studies evaluating factors associated with retinal layer thickness.11 17 19 33–36 Our findings strongly suggest that total retinal thickness is an important variable that should be adjusted for in studies evaluating mRNFL and GC-IPL retinal layer thickness measurements and may also be important when investigating associations with other retinal layers as well.
We also found that adjusting for total retinal thickness changed the association between ancestral background and mRNFL and GC-IPL thickness measurements. Racial/ethnic differences in total retinal thickness, peripapillary retinal nerve fibre and inner retinal thickness (including mRNFL and GC-IPL) have been previously reported.16 18 21 37–39 We found that while there is an absolute difference in mRNFL and GC-IPL thicknesses among participants from different ancestral backgrounds, just as there is a difference in total retinal thickness, these differences among healthy individuals are in proportion, so that the relative differences in layer thickness among groups are equal. Our results show that layer thickness as a proportion of total retinal thickness was fairly consistent across age, gender and different ancestral backgrounds, with mRNFL being about ~10% and GC-IPL about ~20% of total retinal thickness. When comparing retinal layer thickness across individuals, considering the measurement as a proportion of total retinal thickness may be a more stable measure than the actual layer thickness measurement alone. This suggests that these differences in layer thickness are largely driven by differences in total retinal thickness and that retinal layer thickness and total retinal thickness likely change proportionately with each other. This concept is similar to that of comparing body mass index across individuals as opposed to actual body weight or using cup to disc ratio as opposed to cup size or optic disc size alone when comparing optic nerves across individuals. Our results suggest that age, gender and race/ethnicity-specific normative data sets used as the reference by OCT devices to flag patients with abnormal thickness must account for the patient’s total retinal thickness. Furthermore, studies evaluating changes in inner retinal thickness as a potential early biomarker for retinal or systemic neurodegenerative diseases should account for total retinal thickness. It would be important to evaluate how adjusting for total retinal thickness affects the many previously reported associations with mRNFL and GC-IPL.3 5 12 19 40
In addition to the many strengths of our study, it also had some limitations. We made an extensive effort to exclude patients with any ocular or systemic disease that could impact thickness measurements to ascertain normative values among healthy adults. However, in a large cohort, it is possible that a small number of participants may have had some ocular or systemic diseases that we were not able to exclude. Our study evaluated macular-centred SD-OCT scans performed on predominantly white, non-Hispanic participants. This could introduce bias, and it would be important to verify our findings regarding the effect of adjusting for total retinal thickness in other regions of the retina, such as the peripapillary RNFL, and in a more diverse cohort.
In summary, our study provides novel and important findings regarding normative values of mRNFL and GC-IPL thickness measurements and quantifies the relative contribution of multiple factors to the variation in mRNFL and GC-IPL thicknesses. Most notably, we found that total retinal thickness accounts for the majority of the explained variation in mRNFL and GC-IPL thicknesses, which has broad implications on prior OCT-based studies and clinical and ethnicity-based normative data sets. Studies investigating mRNFL and GC-IPL should account for total retinal thickness in their analyses. Our results also suggest using layer thickness ratio (retinal layer thicknesses/total retinal thickness) rather than absolute thickness values when comparing retinal layer thicknesses across groups.
Data availability statement
Data may be obtained from a third party and are not publicly available.
Ethics statements
Patient consent for publication
Ethics approval
UK Biobank has approval from the North West Multi-centre Research Ethics Committee (MREC) as a Research Tissue Bank (RTB) approval. This approval means that researchers do not require separate ethical clearance and can operate under the RTB approval. The study was conducted under project number 41561 approved by the UK Biobank under the terms of the access MTA. The study was conducted in accordance with the principles of the Declaration of Helsinki and approved by the ethics committee and institutional regulatory boards, and all participants gave informed consent.
References
Supplementary material
Supplementary Data
This web only file has been produced by the BMJ Publishing Group from an electronic file supplied by the author(s) and has not been edited for content.
Footnotes
Twitter @RoomasaC
Contributors All authors (MBan, KL, MBah, KS, CA, YL, AD, BJF, EHS, MA, RC) contributed scientifically to this work. RC as the guarantor.
Funding This study was funded by a Career Development Award from the National Eye Institute (7K23EY030911-02 to RC) and an unrestricted grant from Research to Prevent Blindness to the Department of Ophthalmology and Visual Sciences at University of Wisconsin-Madison.
Disclaimer The funders did not take any role in the design, collection, analysis, decision to publish or preparation of the manuscript.
Competing interests MA is founder, equity owner, director and consultant for Digital Diagnostics.
Patient and public involvement Patients and/or the public were not involved in the design, or conduct, or reporting, or dissemination plans of this research.
Provenance and peer review Not commissioned; externally peer reviewed.
Supplemental material This content has been supplied by the author(s). It has not been vetted by BMJ Publishing Group Limited (BMJ) and may not have been peer-reviewed. Any opinions or recommendations discussed are solely those of the author(s) and are not endorsed by BMJ. BMJ disclaims all liability and responsibility arising from any reliance placed on the content. Where the content includes any translated material, BMJ does not warrant the accuracy and reliability of the translations (including but not limited to local regulations, clinical guidelines, terminology, drug names and drug dosages), and is not responsible for any error and/or omissions arising from translation and adaptation or otherwise.