Article Text

Abstract
Objective The aim of present study was to evaluate our clinical decision support system (CDSS) for predicting risk of diabetic retinopathy (DR). We selected randomly a real population of patients with type 2 diabetes (T2DM) who were attending our screening programme.
Methods and analysis The sample size was 602 patients with T2DM randomly selected from those who attended the DR screening programme. The algorithm developed uses nine risk factors: current age, sex, body mass index (BMI), duration and treatment of diabetes mellitus (DM), arterial hypertension, Glicated hemoglobine (HbA1c), urine–albumin ratio and glomerular filtration.
Results The mean current age of 67.03±10.91, and 272 were male (53.2%), and DM duration was 10.12±6.4 years, 222 had DR (35.8%). The CDSS was employed for 1 year. The prediction algorithm that the CDSS uses included nine risk factors: current age, sex, BMI, DM duration and treatment, arterial hypertension, HbA1c, urine–albumin ratio and glomerular filtration. The area under the curve (AUC) for predicting the presence of any DR achieved a value of 0.9884, the sensitivity of 98.21%, specificity of 99.21%, positive predictive value of 98.65%, negative predictive value of 98.95%, α error of 0.0079 and β error of 0.0179.
Conclusion Our CDSS for predicting DR was successful when applied to a real population.
- telemedicine
- epidemiology
- retina
- diagnostic tests/investigation
Data availability statement
Data are available upon reasonable request.
This is an open access article distributed in accordance with the Creative Commons Attribution Non Commercial (CC BY-NC 4.0) license, which permits others to distribute, remix, adapt, build upon this work non-commercially, and license their derivative works on different terms, provided the original work is properly cited, appropriate credit is given, any changes made indicated, and the use is non-commercial. See: http://creativecommons.org/licenses/by-nc/4.0/.
Statistics from Altmetric.com
Key messages
What is already known on this topic?
Currently, the diagnostic aid algorithms for diabetic retinopathy screening are not standardised, which makes adherence to screening techniques low.
What this study adds?
The present algorithm helps to improve the screening for diabetes retinopathy by personalising the times between retinographies.
How this study might affect research, practice or policy?
The results will allow personalising the screening time of patients with diabetes, increasing adherence to screening.
Introduction
Diabetes mellitus (DM) is a chronic disease that affects 382 million patients worldwide (2013 data) and is projected to increase to 592 million adults by 2035.1 2 It is one of the leading causes of blindness in young adults worldwide.3
The most important ocular complication of DM is diabetic retinopathy (DR), a common cause of blindness in Europe.3 DR screening for DM populations is carried out using a non-mydriatic fundus camera, which is a very cost-effective method.4 Screening had been recommended by various medical societies.5–7
Our programme was rolled out in 2007, which included general practitioners and endocrinologists.8 The screening programme has four non-mydriatic fundus camera units, which are available to screen 3109 patients with DM in our healthcare area (HCA). Despite the proximity of our units, we are still only able to evaluate each patient once every 2.5 years, on average, meaning that only 30% of patients can be fully evaluated each year.9 Similar frequencies are reported from other countries.10 11
To improve the screening service tools are being developed that allow automatic analysis of images and evaluate DR risk factors for each patient. Our research team has developed a prediction algorithm (a clinical decision support system (CDSS)) based on nine risk factors12 and has tested it for a population of patients with type 2 diabetes (T2DM).13 The tool used information contained in the patient’s electronic health record (EHR).
The aim of the present study was to evaluate our CDSS for predicting risk of DR and to compare the results with those yielded previously in the building and testing phases.
Materials and methods
Setting
The reference population in our HCA is 247 174 and 17 792 (7.1%) of those who are registered patients with DM. Our DR screening programme has been ongoing since 1 January 2007 for patients with T2DM and is described more completely elsewhere.8 9
Design
A prospective, population-based study conducted between 1 October 2020 and 30 September 2021 recruited 602 patients with T2DM randomly from around 6000 patients that we screen annually.9
Power of the study
According to our epidemiologist, we needed 325 patients with T2DM to achieve the detection of a ±3% increase in risk and 95% accuracy.
Method
Our CDSS for DR was originally built from a sample of patients with T2DM taken from an overall DM population of our HCA. Briefly, the construction of the algorithm was based on a statistical analysis system that uses decision trees, which requires two basic parameters: the number of trees in the forest and the number of attributes at each node. To determine the number of trees and the number of nodes, sensitivity (S) and specificity (SP) analyses were carried out, together with concordance with the prediction of DR.12 Following these analyses, it was determined that 200 trees were required with three attributes (or risk factors) at each node. After applying the statistical analyses through decision trees and applying fuzzy rules, the following were considered the most significant nine variables: current age, sex, body mass index (BMI), DM duration and treatment, arterial hypertension, HbA1c in per cent, microalbuminuria and glomerular filtration rate determined by the CKD-EPI formula. The testing yielded an area under the curve (AUC) of 0.826, with an S of 84%, SP of 88.5%, positive predictive value (PPV) of 63.8% and negative predictive value (NPV) of 95.8% for patients with DM.13
Screening for DR is carried out by taking one initial 45° field retinograph, centred on the fovea. If DR is suspected, three more retinographs of 45° are taken, one field centred on the macula, another on the optic disc and a third on the superior temporal to the macula. This third field corresponds with Joslin Vision Network field NM-2, providing a more peripheral image of the retina.14
In the present study, DR is classified thus as: (1) no DR; (2) very mild DR defined as microaneurysms only or level ETDRS 20; (3) moderate DR defined as more than just microaneurysms but less than severe DR or ETDRS levels 31–47 and (4) severe DR defined as any of the following: extensive intraretinal haemorrhage in each of four quadrants (>20) and/or definite venous beading in 2+ quadrants and/or prominent IRMA in 1+ quadrant or proliferative DR ETDRS levels 53–85.15
Technique
The CDSS was used by two primary care general practitioners, an ophthalmologist and an endocrinologist, none of them having had any relationship with the original construction of the model. They were limited to checking whether the application of the algorithm was consistent with the results obtained from the patients retinographs and whether the data included in the algorithm were correct and corresponded with the observed results of the risk of developing DR.
The medical and laboratory results were extracted from the EHR of each patient, always considering the last value recorded. The non-analytical data were taken from the report by the doctor who physically examined the patient.
Inclusion criteria
Patients with T2DM.
Exclusion criteria
Patients with other specific types of diabetes or with gestational DM.
Statistical methods
Data evaluation and analysis was made using SPSS V.22.0 statistical software at a significance of p<0.05. The frequencies and percentages corresponding to the qualitative variables were calculated. Quantitative variables were expressed as arithmetic mean±SD (in symmetric distributions) or as median and interquartile range (in skewed distributions). Qualitative variables were compared using the χ2 test. In normal distributions, continuous quantitative variables were compared using parametric tests, the Student’s t-test was used in the case of group-to-group variables or the ANOVA analysis if there were more than two groups. The receiver operating characteristic (ROC) analysis determined the variables that best fitted the model prediction. Finally, the analysis of the variables depending on DM duration was carried out using the Cox survival analysis.
We measured the screening performance of the study using a confusion matrix/contingency. Given a classified data set, there were four basic combinations of actual and assigned: correct positive assignments, or true positives (TP), correct negative assignments, or true negatives, incorrect positive assignments, or false positives, and incorrect negative assignments, or false negatives (FN).
The statistical evaluation of the data set included: S, SP, PPV or precision, NPV, positive false discovery rate or type 1 error (α), negative false discovery rate or type 2 error (β) and the AUC or diagnostic effectiveness expressed as a proportion of correctly classified subjects.
Results
Demographic variables of sample size
From 1 October 2020 to 31 September 2021, a total of 602 patients with T2DM were recruited randomly from 5783 screened at the non-mydriatic fundus camera units. Table 1 shows the characteristics of the patient sample. The most important values were current age (67.03±10.91 years), DM duration (10.12±6.41 years) and the HbA1c value (7.49%±2.48%).
Descriptive values of the sample
Prevalence of DR
A total of 222 patients with T2DM (36.87%) had some form of DR. Mild DR was present in 111 patients (18.43%), moderate DR in 72 patients (11.96%), severe DR in 36 patients (5.8%) and proliferative DR in 3 patients (0.5%).
Statistical study of risk variables
Table 2 gives the risk factor values in the univariable analysis. DM duration and DM treatment, presence of arterial hypertension, BMI, HbA1c and UACR values were significant factors, but not age (p=0.077), sex (p=0.396) and estimated glomerular filtration rate (eGFR) (p=0.154).
Statistical analysis of risk variables in our sample
The multivariable statistical analysis
Figure 1 shows the ROC curve analysis of variables and the positive predictive variables for DR: sex, HbA1c value, insulin DM treatment, urine–albumin ratio and arterial hypertension. eGFR is over the diagonal and current age with NPV (less age more DR risk, more age less DR risk) are under the diagonal.

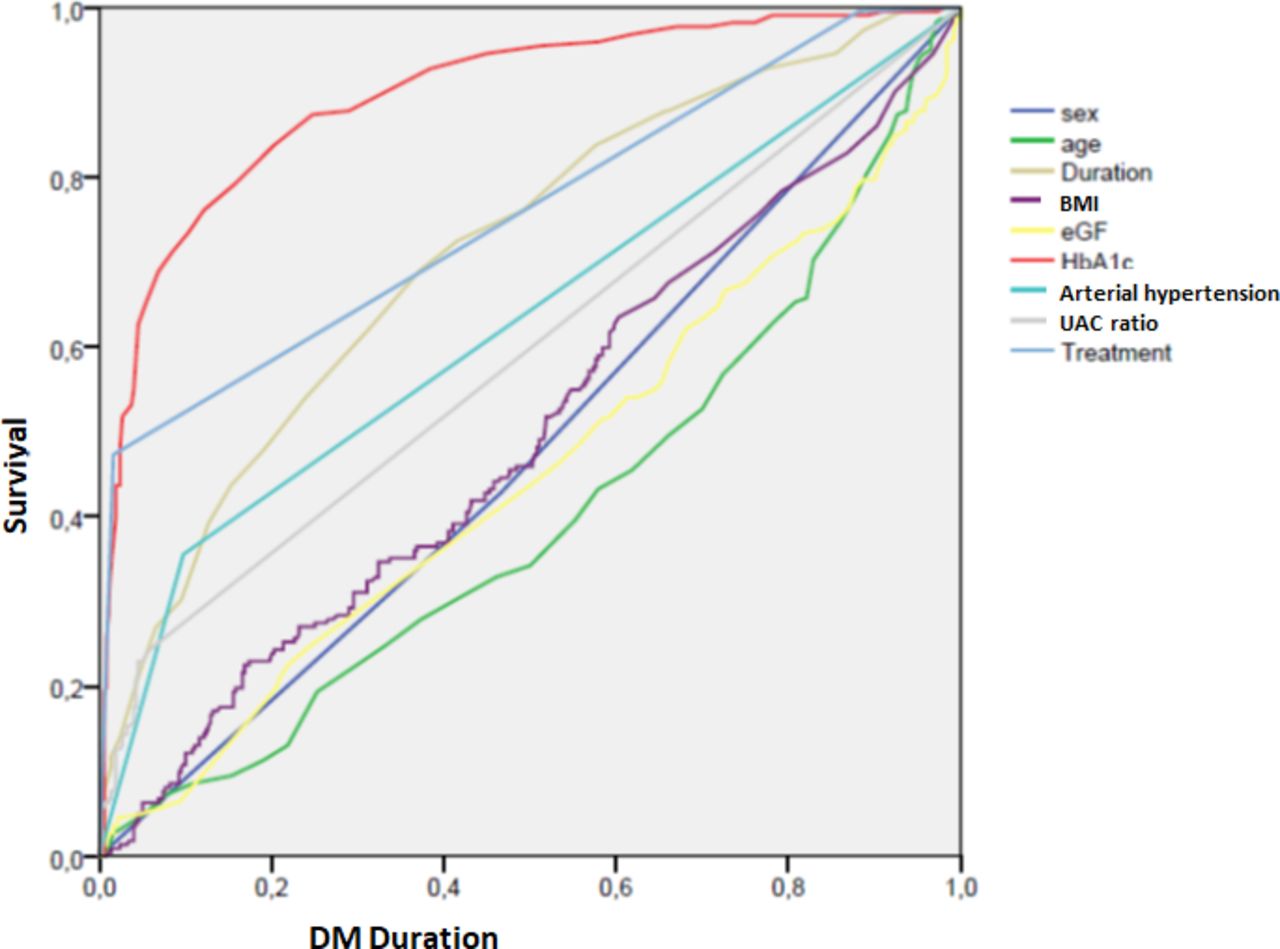
ROC curve analysis. BMI, body mass index; DM, diabetes mellitus; eGF, estimated glomerular filtration; ROC, receiver operating characteristic; UACR, urine albumine creatinine ratio.
Table 3 shows Cox’s proportional survival analysis. The introduction of different variables with DM duration as a time variable is significant in the univariate statistical study. Sex is not significant in the survival analysis.
Results of Cox’s survival analysis
Statistical analysis of confusion matrix/contingency
Table 4 gives the results of the matrix confusion analysis for predicting any form of DR. SP and S have high values, 99.21% and 98.21%, respectively, with a good AUC of 0.9884, and a minimal alpha and beta error, with values of 0.0179 and 0.0079, respectively. All FN are patients with mild DR, with less than four microaneurysms.
Statistical confusion matrix of algorithm in our sample size and differences between the current study results and the previous algorithm results
Table 4 also shows the differences between the previous testing phase results and the present study results after applying the algorithm to a real non-selected DM population. The differences show an improvement in the scores of the CDSS for the diagnosis of DR. The predictions are much more effective than in the original testing model, especially in S and the PPV, or precision, of the algorithm, which increased from 84% and 63.8% to 98.21% and 98.65%, respectively.
Also, the alpha (type 1) and beta (type 2) errors dropped from 0.115 to 0.0079 and from 0.16 to 0.0179 respectively. Likewise, the AUC of the system increased from 0.876 to 0.988, an almost perfect score.
Follow-up prediction
The CDSS that we have developed tells us that we must carry out screening as follows (the 218 cases with DR as TP by the system are excluded):
Screening at 6 months: four cases with FN detected by the algorithm.
Screening at 12 months: 211 patients (35%).
Screening at 18 months: two cases (0.3%).
Screening at 24 months: 127 patients (21.06%).
Screening at 36 months: 40 cases (6.6%).
Of the 380 who did not have DR and had to be screened, 211 patients (55.53%) were given a follow-up visit 1 year later and 169 patients (44.47%) were scheduled for more than 1 year later.
Discussion
A specific vascular complication of DM is DR, which is strongly linked to the duration of the disease and the level of glycaemic and arterial hypertension control. DR is the most common cause of new cases of blindness among adults aged 20–74 years in developed countries.
Screening with non-mydriatic cameras is effective in detecting it and many countries have developed extensive screening programmes. Various medical societies recommend an annual review of the fundus be carried out so that DR can be detected early in its evolution. Despite the involvement of general practitioners, endocrinologists and ophthalmologists, annual screening has proven to be very difficult to carry out. Currently, patients are screened on average every 2–3 years, not annually, it is important therefore to develop diagnostic systems that can support personalised screening regimes based on an individual’s various clinical risk factors. To attempt to achieve this, we have developed a prediction algorithm that allows us to grade a patient’s risk of developing DR and then recommend suitable screening intervals. Having successfully built and validated the algorithm using test populations, the objective of the present study was to carry out a pilot test on a real population of patients with T2DM.
Our results show that the CDSS for DR that we have developed12 13 is effective when applied to a real population of patients with T2DM. The statistical analyses have yielded values higher than those obtained previously in the development, validation and testing phases, with an AUC value of 0.988. Compared with the testing values, S scores in the real population increased from 88.5% to 98.21% and the PPV from 63.8% to 98.65%. The results allowed us to personalise screening. Thus, of the 380 who did not have DR and had to be screened, 211 patients (55.53%) were given a follow-up visit 1 year later and 169 patients (44.47%) were scheduled for more than 1 year later.
There are currently three other prediction CDSS being developed and pilot studies have been published. The original concept was put forward in Iceland by Aspelund et al,16 in 2011, which is the most extensive CDSS designed to determine DR risk. It recommends scheduling screening based on the type and duration of DM, HbA1c and systolic blood pressure. Another CDSS, developed by Scanlon et al in Gloucester, UK,17 use the current age of the patient, levels of HbA1c and total serum cholesterol as variables.
Aspelund et al’s model has been tested on different populations from Spain,18 the Netherlands19 and the UK,20 with AUC values varying from 0.7429 to 0.8030 for mixed populations of T1DM and T2DM and 0.8330 for T2DM only. For accuracy, all of those values are lower than our AUC of 0.9884.
The two models by Aspelund et al and Scanlon et al were further tested in Ireland in pilot study by Smith et al,21 with a sample of 2929 patients. Smith reported that both were acceptable predictors of sight-threatening DR (STDR), with an AUC of 0.74 for the Aspelund et al’s model and 0.77 for the Scanlon et al’s model, both values again being lower than the present study. It is important to note, however, that those two models only predict the risk of STDR, no other grades of DR as our model does. Prediction of risk of lower grades of DR would present an opportunity to slow down the evolution of DR and perhaps even prevent it with strict control of glycaemia and blood pressure.
Another CDSS, developed by Broadbent et al,22 23 also known as the Liverpool Risk Calculation Engine (LRCE), is based on the grade of DR, DM duration, HbA1c and cholesterol levels, the value of systolic blood pressure, sex and age at DM diagnosis. The statistical analysis reported an AUC of 0.88 at 6 months to 0.91 at 24 months. S values varied from 0.61 at 6 months to 0.82 at 24 months, and theSP varied from 0.93 at 6 months to 0.81 at 24 months. As in the two previously mentioned models, LRCE does not detect the risk of developing incipient forms of DR, only the risk of STDR. In summary, we can affirm that the results yielded from the present study allow us to personalise screening schedules ranging from 6 months, in the case of significant risk, to 36 months for those at low risk. We have adjusted our CDSS to include what we consider the most significant risk factor in the development of DR, DM duration. Thus, in the case of patients with a DM duration of up to 10 years, if the predicted risk is low, we recommend the next screening at 36 months; with a longer DM duration of 10–15 years, the recommendation is 24 months and for durations of more than 15 years, screening control must be annual. This will allow us to reduce the number of patients who attend DR screening centres and reduce waiting lists. Screening intervals in the present study have reduced by 44.47%, like other studies, such as the Smith et al’s pilot study,21 who report a 40% reduction in frequency achievable using Aspelund et al’s model.
Regarding the cost effectiveness of personalised screening, many studies have been published.24 25 As screening can be extended to two or 3 years, the cost burden would reduce accordingly. We can affirm that with the use of risk algorithms, we can modify the screening programmes in such a way that they include their use and in this way the screening interval can be safely extended; without having to use the subjective method of stating that if patients have good control, screening can be extended to two or 3 years, as stated in some previous publications.26–28
A limitation of the present study is that it has been carried out on a sample of only 602 patients, therefore, although being representative of our population, errors might occur as the system is applied to a greater number of patients. Another limitation is that the system has been developed with patients of exclusively Caucasian origin, so results should not necessarily be extrapolated to other populations.
In conclusion, the clinical diagnosis support system for DR that our team has developed has proven to be efficient for a random sample of patients with DM; however, it needs to be tested for other populations.
Patient and public involvement
No patients were involved in the design of our study.
Data availability statement
Data are available upon reasonable request.
Ethics statements
Patient consent for publication
Ethics approval
The study was conducted according to the guidelines of the Declaration of Helsinki and was approved by an ethics committee (Comite Etico de Investigaciones con medicamentos del Insttut d’Investigacions Sanitaries Pere Virgili (CEIM/IISPV) (approval no. CEIM 028/2018)).
Acknowledgments
The authors thank all general practitioners and endocrinologists in their area who have helped them to implement the new screening system using the non-mydriatic fundus cameras and their camera technicians for their diligent work and interest in the diabetes screening. The authors thank Up2smart for its image analysis support. The authors thank all the patients as participants in the present study. The authors also thank Mr Phil Hoddy for his language assistance and for editing and correcting the English text.
References
Footnotes
Contributors PR-A, RV, AV-M and MB-B conceived the project. PR-A, RV, NM, AV-M, AL, AM-R and JC contributed to study design and methodological aspects of the study, including statistical analysis plan. NM, AV-M, AL and AM-R conceived the software. PR-A, RV, RS-A, JB-G and MB-B provided data for the study. PR-A, RV, NM, AV-M and AM-R undertook the statistical analysis. PR-A, RV, AV-M, RS-A, JB-G and MB-B drafted the manuscript, with input from AL and NM. PR-A is the responsible for the overall content as the guarantor.
Funding This research was funded by Instituto de Salud Carlos III SPAIN, grant number: FIS project PI18/00169, and the European Regional Development fund (FEDER), European Union.
Competing interests None declared.
Provenance and peer review Not commissioned; externally peer reviewed.