Article Text

Abstract
Objective To describe a new method to estimate the frequency distribution of optic nerve disc area, using digital retinographic images.
Methods and analysis We analysed 492 023 fundus images obtained with seven fundus cameras, mainly in Caucasian subjects. They were grouped by resolution and zoom. They were automatically segmented by identifying the inner edge of the Elschnig scleral ring. For this purpose, a neural network trained by deep learning previously described was used. The number of pixels contained within the segmentation and their frequency distribution were calculated. The results of each camera, using different number of images, were compared with the global results using the Kolmogorov-Smirnov test to confront frequency distributions.
Results The frequency distribution was non-Gaussian, more limited in small sizes than in large ones. If the median is assigned a theoretical value of 1.95 mm2, the 1th, 5th, 25th, 50th, 75th, 95th and 99th percentiles would correspond to 1.29, 1.46, 1.73, 1.95, 2.20, 2.64 and 3.03 mm2 in all the dataset. The overall differences were significant for the smaller series, but for each percentile their mean value was only 0.01 mm2 and the maximum 0.10 mm2, so they can be considered similar for practical purposes in all cameras.
Conclusion By automatically segmenting the edges of the optic nerve and observing the frequency distribution of the number of pixels it delimits, it is possible to estimate the frequency distribution of the disc area in the population as a whole and that of each individual case.
- optic nerve
- glaucoma
- anatomy
- imaging
Data availability statement
All data relevant to the study are included in the article or uploaded as supplementary information. https://cloud.insoft.es/s/5w6kdqK9xbEYADZ.
This is an open access article distributed in accordance with the Creative Commons Attribution Non Commercial (CC BY-NC 4.0) license, which permits others to distribute, remix, adapt, build upon this work non-commercially, and license their derivative works on different terms, provided the original work is properly cited, appropriate credit is given, any changes made indicated, and the use is non-commercial. See: http://creativecommons.org/licenses/by-nc/4.0/.
Statistics from Altmetric.com
What is already known on this topic?
Until now, there was no method to automatically estimate the size of the optic disc in photographic images.
What this study adds?
The study describes a new procedure applicable to different fundus cameras, its practical results in a large population sample and its reproducibility.
How this study might affect research, practice or policy?
The described method will allow the development of automatic procedures that compensate for size-dependent morphological indices of the optic disc, to facilitate the evaluation of their relationship with glaucoma.
Introduction
There is no evidence that larger optic discs are more easily affected by primary open-angle glaucoma or pigmentary glaucoma, except in some special forms of the disease, such as macropapillae secondary to high myopia.1
It is presumed that the shape and especially the depth of the lamina cribrosa may facilitate the occurrence of mechanical damage to the ganglion cell axons, being under the influence of intraocular and cerebrospinal fluid pressures. But although it has been thought that the width of the scleral canal might have some relationship with the disease,2 there is no substantial evidence for a significant dependence between these forms of glaucoma and optic disc size.3
However, it is well recognised that the size of the optic disc is of undoubted interest for the interpretation of its normality or pathology, especially in the case of glaucoma. Small optic discs are more difficult to excavate in the disease process, while very large discs occasionally present physiological central excavations that are difficult to differentiate from glaucomatous ones.4 5 Therefore, knowing the size of the optic disc in each particular case allows for a relativistic interpretation of some commonly used indices in diagnosis. Especially the cup-to-disc ratios, both vertical diameters and areas, are higher in larger discs. Therefore, these indices may be overestimated when used as diagnostic criteria in these cases.
Indeed, it is widely accepted that larger discs may alter the specificity of morphological diagnostic methods by increasing false positives.6 But to a lesser extent, other indices such as rim area or minimum rim width (MRW) are higher in larger discs, so that their defects may be underestimated in case of glaucoma.7
According to Jonas,8 estimates of the mean optic disc area in the non-myopic Caucasian population, examined in several studies, give mean values between 2.1 mm² and 2.8 mm², but these absolute measurements vary according to the method used.9 This size appears to be larger in pigmented than in non-pigmented ethnicities and, although some studies suggest that it is larger in men than in women,10 the data they provide are inconclusive and it is accepted that in any case the difference would be small.11
Rough estimates of the size of the optic nerve head can be obtained using slit-lamp retinoscopy, Goldmann three-mirror lens and also by measuring the diameter of the disc in relation to the distance from its centre to the fovea12 13 or in relation to the diameter of the central retinal vein.14 Estimating the size of the optic disc in photographs15 or by instruments such as Heidelber retinal tomography (HRT) or optical coherence tomography (OCT) requires prior calibration based on a knowledge of the morphology of the human eye, its axial length, and so on, as well as a segmentation method that defines the limits of the nerve.
In our opinion, to assess the influence of disc size on clinical data, it is more practical to know its frequency distribution than its absolute magnitude. Although the size of the optic disc does not influence the frequency of glaucoma,1 from a clinical point of view, it is important not to confuse signs such as the vertical cup-to-disc ratio in macropapillae with glaucomatous defects. It is equally important to avoid interpreting these ratios as normal when they are low in the case of micropapillae. The concept of macropapillae and micropapillae is obviously comparative with respect to their more usual size. Therefore, what is clinically important is not to know the size of the optic disc in absolute terms, but to differentiate the usual and more easily interpretable from the unusual which, because of this, can be confusing. Our group has developed a procedure to topographically estimate relative haemoglobin levels in the optic nerve, called Laguna ONhE,16–21 which in its most recent versions uses several convolutional neural networks.22 One of them performs an automatic segmentation of the optic disc trying to detect the inner edge of the Elschnig scleral ring. The procedure has been applied to multiple fundus cameras and a large number of subjects. Its results have been used in this paper to obtain a frequency distribution of the different optic disc sizes observed.
Materials and methods
The study protocol adhered to the principles of the 1975 Declaration of Helsinki revised in 2013. A total of 492 023 optic nerve images obtained with seven fundus cameras, using various resolutions and zoom were included in this study. They came from glaucoma screening performed in several centres, mainly in Central Europe and Scandinavia, through the company RetinaLyze System A/S (Hellerup, Denmark). All subjects agreed to the use of the images for medical research, and the system analyses the images completely anonymously. Given the characteristics of the retrospective study and respect for the anonymity of the cases, no written consent was required from the patients. Given that the majority of the patients were from Central European and Scandinavian countries, it can be stated that the vast majority of the subjects belonged to Caucasian ethnicities, although individual identification of this aspect was not carried out. The sex and age of the subjects was also not known and therefore not assessed.
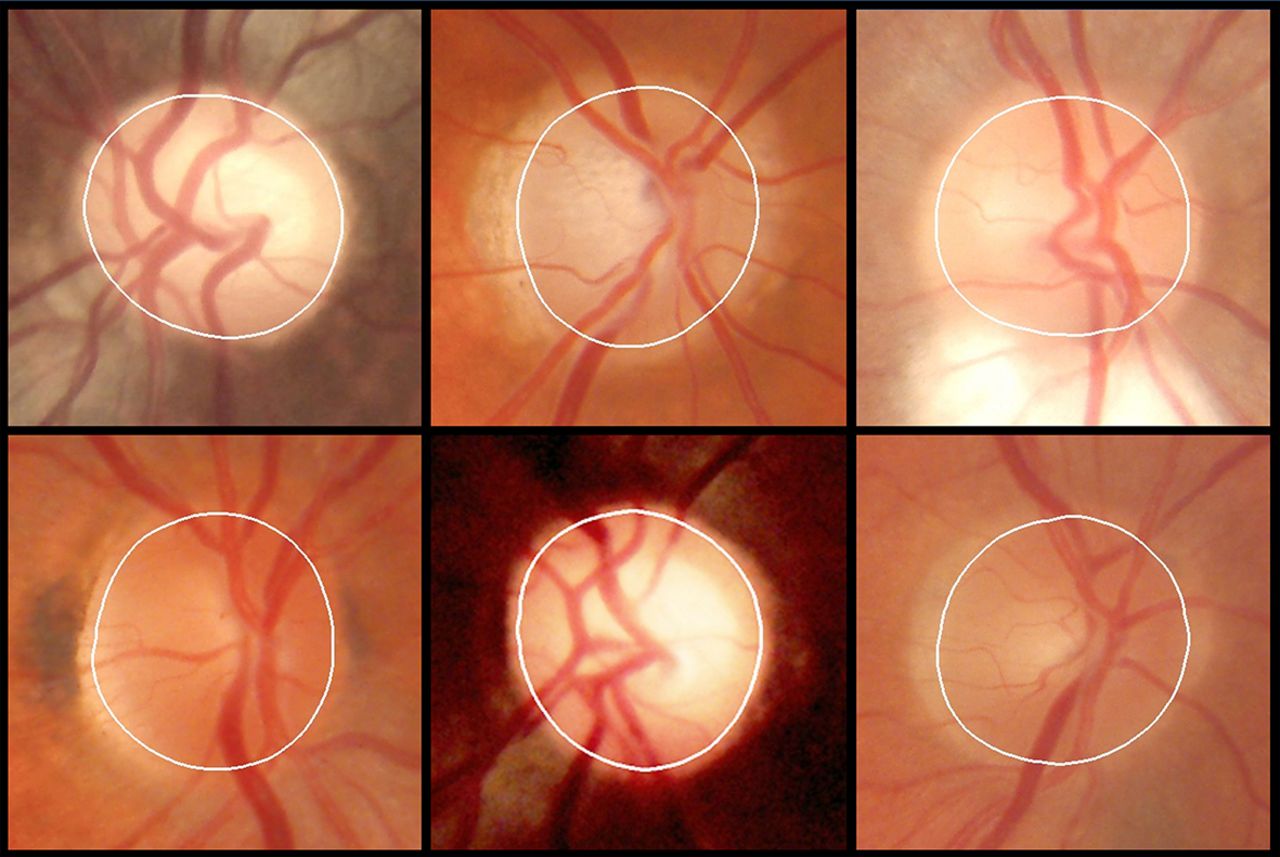
The optic disc segmentation was performed using a previously described neural network, trained using deep learning U-Net architecture, identifying the inner edge of Elschnig’s scleral ring (figure 1).22 23 These previous papers explain how the data were prepared, how the network was trained and detail the results of the evaluation of the optical disc segmentation in comparison with those described in the literature up to that time. For example, it is described that ‘The Sorensen-Dice similarity index between manual and automatic segmentations was 0.993". All images had passed a quality level assessed by a second neural network, described in the same paper. The zoom level of each fundus camera was estimated by the distribution of black pixels on the edge of the image.

Examples of automatic optical disc boundary segmentation. The inner edge of Elschnig’s scleral ring is generally more internal than the apparent edge.
Images were grouped by fundus camera, resolution and zoom level. When more than 5000 images were reached in each group, the frequency distribution of the number of pixels contained within the nerve segmentation in the digital image was calculated. The frequency distribution was expressed in percentiles. Tentatively, the size in square millimetres was calculated by arbitrarily assigning a value of 1.95 mm2 to the median of the frequency distribution of the set of images. The choice of this theoretical value took into account the average disc area data obtained in previous work (PhD thesis) with the Cirrus spectral-domain OCT (Carl Zeiss Meditec), which were 2.01±0.40 mm2 in 96 controls and 1.97±0.41 mm2 in 82 glaucomas (p=0.375),24 as well as the fact that the median value was slightly lower than the average.
2153cases were examined on two occasions with the Topcon NW400 fundus camera to evaluate the reproducibility of the procedure using the intraclass correlation coefficient (ICC). Statistical analyses were performed using the Excel 2016 program (Excel; Microsoft, Redmond, Washington, USA) and MedCalc (V.18.9-64 bits; MedCalc software bvba, Mariakerke, Belgium).
Results
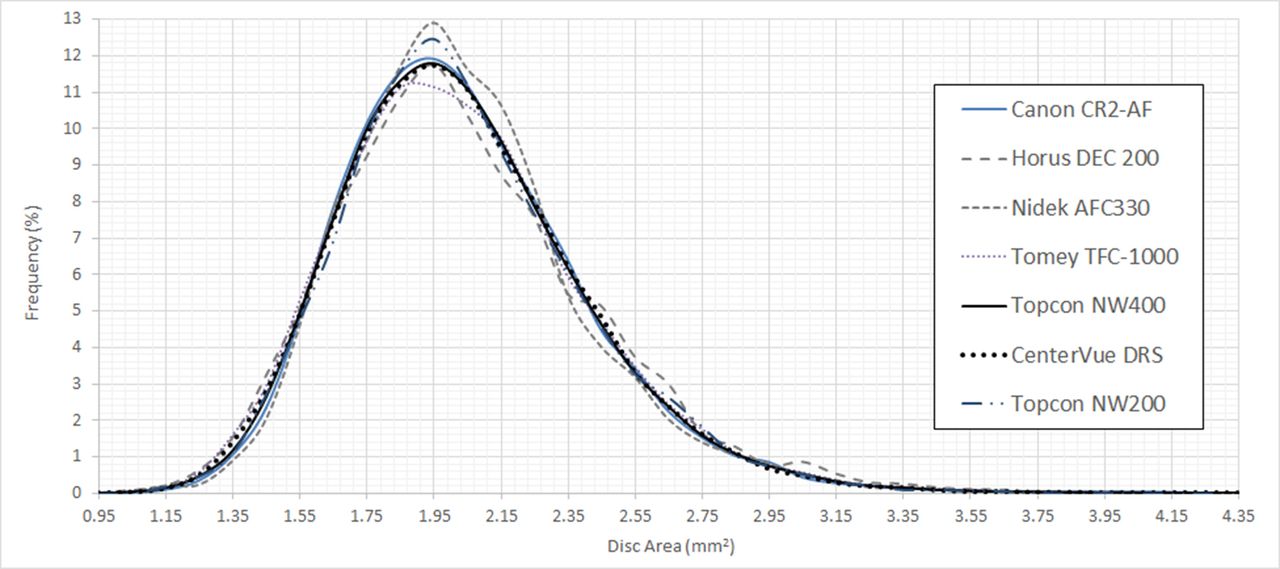
Figure 2 shows the frequency distribution of the optic disc area obtained in the set of fundus cameras, and figure 3 shows the frequency distribution for each of the seven fundus cameras analysed.

Frequency distribution of disc area in the population studied.
Frequency distribution of the disc area in the cases examined with each of the seven fundus cameras.
The frequency distribution was non-Gaussian, more limited in the small sizes than in the large ones. If the median is assigned a theoretical value of 1.95 mm2, the 1th, 5th, 25th, 50th, 75th, 95th and 99th percentiles would correspond to 1.29, 1.46, 1.73, 1.95, 2.20, 2.64 and 3.03 mm2 in the complete dataset. Table 1 specifies in detail the percentiles obtained and the respective disc area value assuming a median value (50th percentile) of 1.95 mm2.
Percentiles (P) and disc areas (DA) in the whole population studied
Table 2 shows that the overall differences were significant for the smaller series, but for each percentile their mean value was only 0.01 mm2 and the maximum 0.10 mm2, so they can be considered similar for practical purposes in all fundus cameras. In the reproducibility study, the ICC was found to be 0.9842 (Cls 5% to 95%: 0.9828 to 0.9855).
Number of images examined with each fundus camera, percentiles, p value with respect to the average distribution (Kolmogorov-Smirnov test) and absolute area differences with respect to the average for each percentile
Discussion
The size of the optic disc is essential in interpreting many cases of suspected glaucoma, but its value is not easy to recognise visually when looking at a fundus image. If the disease is advanced, an excavation (cup) that is predominantly vertical, deformed or approaching the edges may provide diagnostic guidance,25 but in many other cases it is essential to assess these signs in relation to the size of the disc.
If in any normal subject the number of axons was the same, their diameter identical and the amount of interstitial nerve tissue similar, the cup/disc ratios should grow proportionally to disc area. Rim area should also be constant and its width, measured in the plane of the retina or perpendicular to the surface (RMW), should be reduced proportionally in large discs, as it is distributed along a larger circumferential radius. However, we know that this is not the case. Neuroretinal tissue penetrating the optic nerve is greater in patients with large discs. The cup-to-disc ratios grow less than expected and rim area also grows in large optic discs, although moderately, so that RMW is somewhat less reduced than might be expected. Nevertheless, for diagnostic purposes, the dependence of all these indices on nerve size is not negligible and is therefore an essential factor to take into account.
Absolute measurement of the disc area is not easy. Refraction, the axial length of the eye, the criteria used (apparent diameter, width of the anterior optic canal, opening of Bruch’s membrane, etc.) are all involved.15 26 But we believe that, for clinical purposes, the knowledge of the frequency distribution offered by our method is as useful as it would be to know its unequivocal absolute values, if it were possible to obtain them. The immediate goal is to use this method in the Laguna ONhE application that allows estimation of haemoglobin distribution in the normal and glaucomatous optic nerve.16 22
Estimation of the optic disc diameter by comparing it with its distance to the fovea may have the advantage that it could provide results relatively independent of the axial length of the eye and refraction.27 However, it is a method that can only be applied to images that include both the optic disc and the fovea, and not to images centred on the optic disc. Moreover, its automation would require the development of additional neural networks to identify both structures. It would therefore also be necessary to carry out work such as that described in the current paper.
On the other hand, optic disc measurement methods often do not produce equivalent results. The results of some automatic procedures such as the HRT differ more with photographic or clinical (slit-lamp) estimates than with each other. ICCs between their results can be between 0.64 and 0.92.28
Similarly, measurements obtained with OCT are usually lower than those obtained by stereophotography or confocal laser scanning ophthalmoscopy, with correlation coefficients between them ranging from 0.83 and 0.93.29
This is not contradictory to obtaining good reproducibility values with a particular method, as has been pointed out in our case. Therefore, as mentioned in a previous paragraph, absolute values are of little clinical and comparative value and it has even been suggested to dispense of them and to use standardised values.30
The results we have observed are consistent, especially if one looks at their similarity in the various fundus cameras used, but they should be considered as characteristic of the Caucasian population. Similar studies should be carried out in other races to identify their specific peculiarities.31
An important part of the limitations of the method are related to the photographic technique used, and another part to the existence of anomalous optical discs. In the first case, very dark, saturated, out-of-focus images or images affected by dense cataracts should be highlighted. In the second case, anomalies such as papillary oedema, colobomas, myelin fibres and other dysmorphia. The neural network that has been trained and used to detect these types of situations is described in the paper referenced in Ref.23 . In the first group of limiting motifs, the user has the option to retake the image to obtain a new, higher quality image. Obviously, in the case of anomalies of the optic nerve itself, this is not possible. These are cases where the influence of glaucoma on the nerve is often difficult to interpret.
Another current limitation of the method is its inability to detect whether or not the image has been zoomed in or out. With the same fundus camera and resolution, images of different magnification can in some cases be obtained. This is not a problem that affects the series presented in the current paper, but it may be a problem if an attempt is made to apply the method without taking it into account, because the solution adopted in this paper may not be useful for other models of fundus cameras. We are currently working on a more universal method to perform this identification automatically, so that separate calculations are performed for images obtained at different zoom.
Finally, an additional limitation is that the current method does not take into account changes in relative nerve size caused by high refractive errors. This is an issue that we will have to improve in the future. It could be addressed by optico-mathematical estimations32 or by empirical correction of the frequency distribution with respect to refraction or axial eye length.
Data availability statement
All data relevant to the study are included in the article or uploaded as supplementary information. https://cloud.insoft.es/s/5w6kdqK9xbEYADZ.
Ethics statements
Patient consent for publication
Ethics approval
This study was approved by the Research Ethics Committee of the Hospital Universitario de Canarias (CHUC_2018_09 (V4)).
Acknowledgments
The authors thank RetinaLyze for their support.
References
Footnotes
Contributors All authors planned the study, analysed the data, provided critical comments and contributed to the final manuscript. Guarantor: MGR.
Funding The paper has been carried out partly with INSOFT S.L.'s own funds and partially financed with European Union FEDER funds. 'A way of doing Europe'. Red.es Project 2020/0720/00098137.
Competing interests DG-H, MG-H, and MGdlR participate in the patent rights of the Laguna ONhE method, marketed by RetinaLyze, and partners of INSOFT S.L. Company. DP-B is employed by INSOFT S.L.
Patient and public involvement Patients and/or the public were not involved in the design, conduct, reporting or dissemination plans of this research.
Provenance and peer review Not commissioned; externally peer reviewed.