Article Text

Abstract
Aim It’s been reported that pro-inflammatory cytokines are elevated in patients with diabetic retinopathy (DR); this may contribute to the pathophysiology of the disease. The aim of this study is to measure the concentration of various inflammatory cytokines from the main CD4+ T helper inflammatory responses in blood serum from Mexican patients with DR in different stages using cytometric bead array (CBA) technology and correlate them with the presence and severity of DR in order to find possible DR biomarkers that serve as diagnostic or therapeutic predictors.
Methods 64 subjects were included in the study, 16 in the control group, 16 in the type 2 diabetes mellitus no DR (NDR) group, 16 in the non-proliferative DR (NPDR) group and 16 in the proliferative DR (PDR) group. Cytokine concentrations of interleukin (IL) 1ß, IL‐2, IL‐4, IL‐6, IL‐8, IL‐10, IL‐12, IL‐17A, tumour necrosis factor alpha (TNFα) and interferon-gamma in serum samples were measured using Human Inflammatory and TH1/TH2/TH17 CBA Kit.
Results IL-6, IL-12, IL-17a and TNFα were significantly higher in the patients with DR compared with the control group. The PDR group showed a slightly lower concentration of serum cytokines IL-6, IL-12 and IL-17a. TNFα showed a higher concentration compared with healthy controls, NDR and NPDR subjects. We also found a positive statistical correlation between the presence and severity of DR with the clinical parameters haemoglobin A1c, body mass index and serum creatinine and the concentration of serum cytokines IL-6 and TNFα.
Conclusion Our findings suggest that patients with diabetes and DR have a stronger chronic inflammatory profile compared with non-diabetic subjects.
- inflammation
- retina
- immunology
- diagnostic tests/investigation
Data availability statement
There are no data in this work.
This is an open access article distributed in accordance with the Creative Commons Attribution Non Commercial (CC BY-NC 4.0) license, which permits others to distribute, remix, adapt, build upon this work non-commercially, and license their derivative works on different terms, provided the original work is properly cited, appropriate credit is given, any changes made indicated, and the use is non-commercial. See: http://creativecommons.org/licenses/by-nc/4.0/.
Statistics from Altmetric.com
Significance of this study
What is already known about this subject?
It has been reported that pro-inflammatory cytokines are elevated in the serum, vitreous humour, aqueous humour and tear samples of patients with diabetic retinopathy (DR).
DR behaves as a low-grade subclinical inflammatory disease.
Haemoglobin A1c (HbA1c) is the only clinical biomarker that has been validated for incidence and progression of type 2 diabetes mellitus and DR.
What are the new findings?
In this study, we found that interleukin (IL) 6, IL-12, IL-17a and tumour necrosis factor alpha (TNFα) showed significant differences between the control group and the diabetic subjects.
The proliferative DR exhibits significant differences with no DR and non-proliferative DR when we compared IL-6, IL-17a and TNFα concentrations.
A positive statistical correlation between the presence and severity of DR with HbA1c, body mass index, serum creatinine and the concentration of serum cytokines IL-6 and TNFα.
How might these results change the focus of research or clinical practice?
Through a better understanding of the inflammatory process and the role of inflammatory cytokines in the pathophysiology, development and progression of the DR, further investigation may discover new candidates for clinical biomarkers and select proper therapeutic targets for the treatment of DR.
Introduction
Type 2 diabetes mellitus (DM2) affects 3% worldwide, and in Mexico, the prevalence is 13.1% according to the Organisation for Economic Co-operation and Development (OECD) in its 2019 report.1 The physical and psychological damage caused by this disease has important repercussions on life quality and the local and global economy.2 DM2 consists in a systemic dysfunction characterised by hyperglycaemia, which results from an imbalance between an excessive secretion of glucagon, inadequate secretion of insulin from pancreatic beta cells and tissue resistance to insulin effects. The insulin resistance has been attributed to a high concentration of fatty acids and pro-inflammatory cytokines in plasma. As a consequence, a set of neuropathic, macrovascular and microvascular complications are observed.3 Patients with DM2 often develop ophthalmological complications such as epithelial corneal abnormalities, neovascular glaucoma, rubeosis iridis, cataracts and neuropathies. The diabetic retinopathy (DR) is the most common and the leading cause of blindness worldwide according to the WHO.4 Almost one-third of patients with diabetes develop DR.5 This public health problem highlights the need for early diagnostic, therapeutic and prognostic biomarkers, helping ophthalmologists decide the most adequate therapy in patients with DR and attenuate the impact of this complication.
The pathophysiology of DR comprises retinal microvascular damage leading to vascular leakage and ischaemia, which induces retinal neovascularisation, following the classic way of increased advanced glycation end products, activation of protein kinase C and contribution of the superoxide pathway activity.6 These abnormal metabolic pathways lead to the release of proangiogenic, immunological and inflammatory factors such as vascular endothelial growth factor (VEGF), tumour necrosis factor alpha (TNFα), interleukin (IL) 1β, IL-6, IL-8, cyclooxygenase-2, interferon (IFN)-inducible protein-10 (IP-10), monocyte chemoattractant protein (MCP)-1 and pigment epithelium-derived factor.7 8
The most studied biomarker in blood serum is the glycated haemoglobin A1c (HbA1c). This is the only clinical biomarker that has been validated for incidence and progression of DM2 and DR.8 Many studies have been conducted on VEGF regarding its role in the pathogenesis of DR. Although anti-VEGF therapy has been used as treatment in the clinical setting for many years,9 the pathophysiology of DR is more complex, and certainly, other potential inflammatory components play important roles as well.
It has been reported that pro-inflammatory cytokines and other markers such as C reactive protein are elevated in the serum, vitreous humour, aqueous humour and tear samples of patients with DR.9–13 Other reports have shown that the suppression of some cytokines can protect the pathological changes of retinal capillaries in animal models.14 All those studies support the hypothesis that DR behaves as a low-grade subclinical inflammatory disease. Therefore, measuring various cytokines in patients with different stages of DR may facilitate the proposal of new biomarkers for further validation in larger studies. Earlier inflammation biomarker studies have not been consistent in its conclusions, and few of them have studied the inflammatory profile in the different stages of the disease.
Many cytokines play roles in DR and have multiple interactions that impact the pathogenesis of this complication of the DM2. Therefore, it is important to study the cytokine profile of each phase of DR, so we can understand the influence of inflammation in the pathophysiology of each stage. The cytometric bead array (CBA) system has provided the possibility of analysing several proteins in a small volume of fluid such as tears samples or aqueous humour.15–18 CBA uses uniform-size microparticle-based flow cytometry to measure a panel of six human cytokines per test simultaneously in small volume such as 25–50 µL, and it is possible to quantify a variety of soluble and intracellular proteins, such as cytokines, chemokines, growth factors and phosphorylated proteins.18–20 Moreover, CBA assays are validated for measurement of cytokines from serum and tissue culture; however, this method is also useful for measurement of cytokines in supernatants from organ homogenates.21
The aim of this study is to measure the concentration of various inflammatory cytokines from the main CD4+ T helper (Th) inflammatory responses in blood serum from Mexican patients with DR in different stages using CBA technology and correlate them with the presence and severity of DR in order to find possible DR biomarkers that serve as diagnostic or therapeutic predictors.
Methods
This prospective study was adhered to the Association for Research in Vision and Ophthalmology statement on human subjects studies, performed in compliance with the World Medical Association’s Declaration of Helsinki and approved by the Institutional Review Board prior to the study. Written informed consent was obtained from all of the subjects involved in this study.
Patient involvement
The concept of patient involvement was taken in consideration in the design and execution of this study. We provided basic educational information, visual aids and an individualised tutorial using layperson’s language to help in better understanding of research concepts and terminology, research question, choice of outcome measures and methods of recruitment. As results were obtained, we reviewed the results with each patient in a personal consultation to obtain their perspectives and feedback and to ensure that we presented the findings in the most effective and respectful way to the research community.
Study group
In the present study, we included subjects with DM2 recruited from the Institute of Ophthalmology ‘Conde de Valenciana’ in Mexico City. All patients were diagnosed according to the WHO diagnostic criteria for type 2 diabetes and were treated with oral hypoglycaemic agents and/or insulin.
We excluded patients with acute and chronic ophthalmological or general inflammatory disorders, glaucoma, age-related macular degeneration, high myopia, occlusion of a retinal artery or vein, ocular ischaemic syndrome, eye surgical interventions in the last 3 months, panretinal photocoagulation or antiangiogenic application for DR, tumours, severe atherosclerosis with clinically proven myocardial infarction, strokes or other vascular incidents and hepatic or renal insufficiency.
Sixteen healthy, age-matched subjects were included for the control group. None of the control subjects were taking any medication.
Patients with incomplete clinical data or those that withdraw their informed consent were eliminated from the study.
Clinical examination
Dilated ophthalmological slit lamp biomicroscopy and indirect ophthalmoscopy were performed. Also, fundus fluorescein angiography and fundus colour non-mydriatic photography (VISUCAM 224/524, Carl Zeiss, Germany) were taken. The staging of patients and grouping into normal (no DR (NDR)), non-proliferative (mild, moderate and severe) and proliferative was achieved based on clinical examination by three different experts using the Early Treatment Diabetic Retinopathy Study classification.22
Detailed demographical information was collected from every subject, such as age, gender, family history, time of diagnosis, current medication and body mass index (BMI=weight/height2). Fasting serum glucose, HbA1c and serum creatinine levels were recorded from routine clinical blood chemical assays.
Serum collection
Blood samples (6 mL) were obtained from each patient by cubital puncture after 8 hours of fasting. The collected samples were centrifuged for 10 min at 4°C at 3500 rpm for serum collection. Serum samples were frozen and stored at −80°C until further analysis.
Cytokine analysis in serum by flow cytometry
To determine cytokine concentration of IL‐1ß, IL‐2, IL‐4, IL‐6, IL‐8, IL‐10, IL‐12, IL‐17A, TNF‐α and IFN‐γ in serum samples, we used Human Inflammatory and TH1/TH2/TH17 CBA Kit (BD Biosciences Pharmingen, San Diego, California, USA), following the manufacturer’s instructions. Briefly, cytokine standards were prepared using a vial of lyophilised Human Th1/Th2/Th17 and assay diluent by the method of serial dilutions. Capture bead was added into each tube, that is, samples, standards and negative control, and was incubated for 30 min at room temperature in the absence of light. The flow cytometer was calibrated using cytometer setup beads, and the assay was performed.
Statistical analyses
The patient’s demographical characteristics were described using means and SD. To assess the distribution of the studied variables, we used the Shapiro-Wilk test. Given the distribution of the data, comparative analysis between the different groups was performed using non-parametric tests: to analyse values with abnormal distribution, we used the Mann-Whitney U test (for comparison of two groups) and the Kruskal-Wallis test (for comparison of more than two groups); to analyse values with normal distribution, we used the independent samples t-test and analysis of variance (ANOVA). For the correlation analysis of values with normal distribution, we used Pearson’s correlation test and of values with abnormal distribution—Spearman’s correlation test. The accepted level of significance was set at p<0.005 after Bonferroni correction. Logarithmical transformation was used to improve normality of cytokines and inflammatory factor concentrations. All assumptions for multivariate analysis of covariance (MANCOVA) were assessed prior to compare cytokine measures between the four groups; BMI was controlled for as covariate because of documented impact on plasma cytokine levels (Fong, 2019).23 For investigation of main effects, a post hoc analysis of covariance (ANCOVA) with BMI as covariable and Bonferroni correction for multiple comparisons was applied. We constructed a linear regression model as reference and an ordered logistic model. To avoid over-representation, we calculated the variance inflation factors (VIF) for each variable. Both models included the DR severity as the responding variable. All statistical analyses were performed using Stata statistical software (Stata/IC), V.16.
Results
Subjects’ clinical data
A total of 64 subjects were included in the study, 16 patients in the control group (no diabetes mellitus (DM) and NDR), 16 patients in the DM2 NDR group, 16 in the non-proliferative DR (NPDR) group and 16 in the proliferative DR (PDR) group. The clinical characteristics are listed in table 1. There were no statistical differences in gender, age or time of diagnosis. HbA1c and BMI were substantially higher among DR groups (NPDR and PDR) compared with the NDR. Serum creatinine was considerably elevated in the PDR group compared with the other three groups.
Clinical and demographical characteristics
Serum cytokines
Comparison with post hoc ANOVA results between groups and significance after Bonferroni correction for multiple comparisons are reported in table 2.
Serum cytokine levels per group
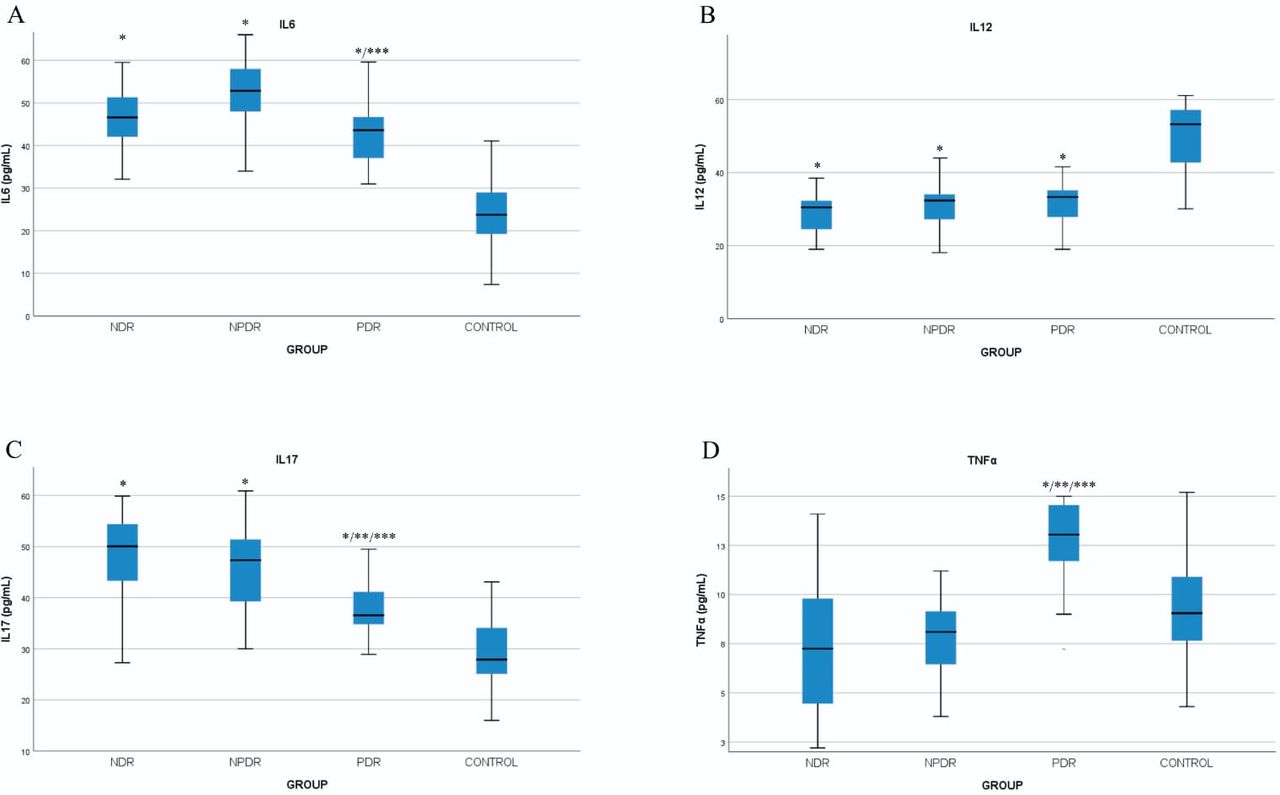
Patients among the DR spectrum showed significantly elevated concentration of cytokine IL-6, IL-8, IL-12, IL-17a and TNFα levels compared with the control group.
Among the diabetic groups, subjects with PDR showed a slightly lower concentration of cytokines IL-6, IL-12 and IL-17a than the NDR and the NPDR groups. Only TNFα was significantly higher in this group compared with the others (figure 1).

Seric concentration of (A) interleukin (IL) 6, (B) IL-12, (C) IL-17a and (D) tumour necrosis factor alpha (TNFα). NDR, no diabetic retinopathy; NPDR, non-proliferative diabetic retinopathy; PDR, proliferative diabetic retinopathy; *p<0.05 versus control group; **p<0.05 versus NDR group; ***p<0.05 versus NPDR.
IL-8 was founded elevated only in the NPDR group; for all our results and later discussion, we only accounted for significant difference after Bonferroni correction.
MANCOVA and post-hoc analysis
Comparing serum cytokine levels between control, NDR, NPDR and PDR groups controlled by BMI, the overall MANCOVA identified a difference between the groups (Λ=0.0244; F (40 210)=8.75; p<0.0001) and cytokine levels; we did not find a statistical group*BMI interaction (Λ=0.06; F (30 153)=0.97; p=0.52). Post hoc ANCOVAs with BMI as covariate do not evidence difference between groups and cytokine levels depending on covariate (table 3).
Serum cytokine levels compared between groups with BMI as covariate
Correlation analysis
In the correlation between clinical characteristics and the cytokine concentration with presence and severity of DR, we observed a positive statistical correlation with HbA1c (rho=0.687 with a p=0.01), BMI (rho=0.815 with a p=0.001) and serum creatinine (rho=0.801 with a p=0.001). The serum cytokines that had a positive correlation with severity of DR were IL-6 (rho=0.304 with a p=0.006) and TNFα (rho=408 with a p=0.001). The rest of the variables showed no statistical correlation. The correlation analysis is reported on table 4.
Correlation of clinical characteristics and cytokine concentration with diabetic retinopathy severity
Multiple linear regression analysis
All variables presented an acceptable independence (VIF <5.0) with a mean of 2.44. Thus, all of them were included in both regression models.
Multiple linear regression presented an acceptable goodness of fit (adjusted R2=0.857). Variables TNF, HbA1c and BMI showed a significant relationship to DR severity (p<0.01), as well as IL-6, IL-17 and creatinine (p<0.05). However, given that DR severity is an ordinal variable, we then constructed an ordered logistic regression, which also presents an adequate goodness of fit (adjusted R2=0.637).
This model showed that IL-1B, TNF and BMI are significantly and positively related to DR severity (p<0.01), so does creatinine (p<0.05) (table 5).
Multiple linear regression and ordered logistic analysis for diabetic retinopathy severity
Discussion
DR is a vision-threatening complication in patients with diabetes. The microvascular and ischaemic damage caused by hyperglycaemia and the abnormal metabolic pathways lead to the release of proangiogenic, inflammatory and immunological factors. Elevated concentrations of various inflammatory cytokines and angiogenic mediators have been detected in vitreous and aqueous humour and retinal tissue. There are reports that serum chemokines are significantly elevated in patients with at least severe NPDR.24 25
In this study, we found that IL-6, IL-12, IL-17a and TNFα showed significant differences between the control group and the diabetic subjects. The PDR exhibits slightly lower concentrations of IL-6, IL-12 and IL-17a and higher concentrations of TNFα when compared with NDR and NPDR. We also found a positive statistical correlation between the presence and severity of DR with the clinical parameters HbA1c, BMI and serum creatinine and the concentration of serum cytokines IL-6 and TNFα. These findings suggest that patients with diabetes and DR have a stronger chronic inflammatory profile compared with non-diabetic subjects.
Cytokines are synthetised by the lymphocytes, macrophages, monocytes, fibroblasts and endothelial cells, among many other cells. They mediate intercellular interactions in the immune reactions and the acute-phase inflammatory processes and are involved in haematopoiesis pathways.
There are three types of CD4+ Th response that promotes cellular as well as humoral immune responses that are highly associated with inflammation in ocular fluids and tissues.26 IL-1β, IL-2, IFN-γ and TNFα are produced by Th1 response; IL-4, IL-5, IL-6 and IL-10 are produced by Th2 cells and IL-17a by Th17 response.27 The CBA is able to analyse the aforementioned cytokines simultaneously in a volume as low as 200 µL in each sample. This technique allows us to analyse the cytokine profile at each stage of DR and may contribute to a better understanding of the inflammatory process and its correlation with the development and progression of the disease.
The importance of circulating cytokines for the development of DR is not clear or whether they can be used as diagnostic and prognostic biomarkers. The studies available in this matter have been contradictory in its conclusions.
Hang et al measured cytokines in the plasma of patients with DM2 and DR; they found that MCP-1, IL-6, IL-7, IL-9, IL-13, IL-15, IL-17, soluble CD40 ligand (sCD40L), soluble IL-2R alpha (sIL-2Rα) and TNF-β were increased significantly in the diabetic group compared with the controls, whereas Fms-related tyrosine kinase 3 ligand (Flt-3L), IL-1Ra, IL-3, IL-5 and IL-12 were lower in the diabetic group than in the control. When the diabetic group was subdivided by DR stage groups, Hang et al, reported that TNFα plasma level was significantly elevated in patients with PDR compared with the levels in patients with NPDR and patients with NDR.25 Also Koleva-Georgieva et al, measured the levels of IL-1β, IL-6, TNFα and VEGF reporting that patients with DR showed higher levels of this cytokines compared with the non-diabetic group; in their conclusions, these cytokines showed a positive correlation with the severity of DR.28
Mirza et al measured cytokines IL-6, TNFα, IL-1β, IL-8, adiponectin, resistin and leptin in a cohort of Mexican–American patients with type 2 diabetes. Their data indicated that diabetes as a whole was strongly associated with elevated levels of IL-6, leptin and TNFα, whereas worsening of glucose control was positively and linearly associated with high levels of IL-6.29
Cheung et al measured IL-2, IL-10, IL-12, IFN-α and TNF from aqueous humour samples of patients with diabetes. They concluded that only IL-6 and VEGF levels were significantly higher in patients with diabetes and retinopathy.30 All these studies aforementioned report similar results to those of our study; however, there has been controversy regarding cytokine profiles from patients with DR. Chen et al quantified IFN-γ, IL-1β, IL-2, IL-4, IL-5, IL-6, IL-9, IL-10, IL-12 p70, IL-13, IL-17A, IL-22 and TNFα in serum of patients with diabetes compared with control subjects. They concluded that only IL-22 showed significantly lower levels in patients with diabetes; the rest of the cytokines showed no significant change in patients with diabetes compared with controls.31 Lange et al measured vitreous and plasma concentrations of 42 cytokines. They concluded that eotaxin, Flt-3L, growth-related oncogene, IL-6, IL-8, IL-9, IFN-IP-10, macrophage-derived cytokine and VEGF showed significant changes in vitreous of subjects with PDR.32
Marwaha et al reported multiple T cell subsets are biased towards IL-17 secretion in patients with type 1 diabetes,33 Wang et al reported in an animal model that IL-17a exacerbates DR-like pathology by the promotion of Müller cell functional impairment via Act1 signalling.34 These studies support our findings regarding the higher levels of IL-17a in the DR group suggesting its participation in the physiopathology of the PDR, but in a contradictory way, Nadeem et al, in a cross-sectional case–control study, reported that serum level of IL-17 was inversely associated with type 2 DM and DR.35
Morohoshi et al,36 showed in vitro that the secretion of IL-6 and TNFα by peripheral blood monocytes can be stimulated by a hyperglycaemic environment.35 This could be the reason that explains why patients with hyperglycaemia showed increased blood concentrations of these two cytokines. In addition to this, TNFα is an adipocytokine, defined as molecules that are primarily secreted from the cells that formed the white adipose tissue. These adipocytokines have paracrine and endocrine activity, especially when plasma glucose level is elevated.
Finally, Ali et al reported in an animal model that IL-12 disruption promoted angiogenesis, arteriogenesis and increases blood flow recovery in type 2 diabetic mice.37 Decrease in IL-12 might be explained as a response to the ischaemic environment generated by the DR pathophysiology.
Diabetic conditions lead to an elevation of pro-inflammatory cytokine expression within the retina, which activates microglial cells. In response to an activating stimulus, quiescent microglia undergo a series of stereotyped morphological, phenotypical and functional changes. Activated microglia thereby stimulate a cycle of inflammation that recruits leukocytes, causes vascular breakdown and directly induces glial dysfunction and neuronal cell death through the release of cytotoxic substances. Boss et al reported various inflammatory cytokines—IL-1β, IL-6, IL-8, TNFα and MCP-1—elevated in ocular tissues in even higher concentrations in diabetic eyes with NPDR than with active PDR.38 The increase in these cytokines produced by activated microglia, endothelial cells, macroglia and later even neurons highlights the increased activity of these inflammatory cytokines in the early stages of DR and the progression of the inflammatory response throughout all cell types of the retina.39 One of the early signs of retinal metabolic stress is the upregulation of glial fibrillar acidic protein by Müller glial cells, an observation classically reported in animal models as well as in tissues from patients with diabetes with NDR to mild NPDR. This increase constitutes a known negative regulatory mechanism of cytokine signalling, suggesting that counter-regulatory mechanisms of angiogenesis and inflammation exist within the eye.40
This upregulation had also been reported in other DR biomarkers studies including serum microRNA (miR). Qin et al examined the expression level of miR-126 in 42 patients with DM and NPDR, 39 patients with DM and PDR and 44 patients with DM and NDR. The relative expression of miR-126 in the PDR group was significantly lower than that in the combined NDR and NPDR groups. The downregulation of miR-126 in PDR may be related to endothelial damage as it has been reported that miR-126 provides protection for vascular endothelial cells.41 42
Hyperglycaemia and the abnormal metabolic pathways are a common factor for the whole body and cause pathological changes not only in the eye, but that is also the reason why clinical systemic biomarkers should be taken into consideration.
Andreasson et al reported a retrospective study that followed patients from 1993 to 2001; they concluded that higher HbA1c levels shortened the time of development of DR in patients with type 1 DM.43 Hermann et al reported a multicentre research made in Germany and Austria with over 35 000 patients; this study concluded that the variability of HbA1c is relevant for development of DR.44 Kaštelan et al in a cross-sectional study including 545 patients observed that BMI in correlation with HbA1c, cholesterol and hypertension appears to be associated with the progression of DR in type 2 diabetes.45 Diabetic microangiopathy is a complication that not only affects the retina but also the kidneys and the nervous system. It may be possible that the pathophysiology of this complication is mediated by the same cytokines produced by various tissues and circulating in the blood. Zhang et al in a nested case–control study that included 177 patients with DR in different stages concluded that serum creatinine and estimated glomerular filtration rate variability are significantly associated with the presence and severity of DR.46 Li et al published an observational retrospective study of 104 patients with diabetic nephropathy (DN); they concluded that patients with DN and without DR may have less serious renal damage and less diabetic complication than those with DR.47 The results of these studies support the positive correlation that was found in our study between the presence and severity of DR and HbA1c, BMI and serum creatinine.
One limitation of this study is the relative small sample size; extensive studies with larger samples are needed to validate new candidates for clinical biomarkers in order to select proper diagnostic, prognostic and therapeutic targets for the treatment of DR.
Conclusion
In summary, the present study demonstrated a significantly higher concentration of systemic inflammatory cytokines that is consistent with a pro-inflammatory profile in patients with DR in all stages. PDR showed concentrations of cytokines slightly lower than NDR and NPDR, except for the TNFα, which had the highest concentration compared with the patients without diabetes, patients with diabetes and without DR and patients with NPDR. These findings support the hypothesis that DR behaves as a low-grade subclinical inflammatory disease. In addition, the present study observed a positive and strong correlation between DR stage and clinical parameters reflecting metabolic-state HbA1c, BMI and serum creatinine and also with inflammatory cytokines including TNF, IL-1B and IL-6. These data strengthen the evidence that an altered glucose metabolism may lead to an inflammatory environment contributing to the development and progression of DR.
Data availability statement
There are no data in this work.
Ethics statements
Ethics approval
Accepted by the ethics and investigation committee of the Institute of Ophthalmology 'Conde de Valenciana'. In Mexico City. ID: CEI-2016/08/01.
Acknowledgments
This study was developed as part of the master’s and doctoral programme in medical sciences of the 'Universidad Nacional Autónoma de México' (UNAM).
References
Footnotes
Contributors JUQ-M and YG-B conceived the presented idea. JUQ-M developed the theory and performed the computations. DV helped with the sample processing. JJ and OG verified the statistical methods and OG the findings of this work. All authors discussed the results and contributed to the final manuscript.
Funding This research was supported by CONACYT-FOSISS-273146, CONACYT-PROBLEMAS NACIONALES-2015-0311, PAPIIT-DGAPA-UNAM-IN23821.
Competing interests None declared.
Patient and public involvement Patients and/or the public were involved in the design, conduct, reporting or dissemination plans of this research. Refer to the Methods section for further details.
Provenance and peer review Not commissioned; externally peer reviewed.