Article Text

Abstract
Objective Several studies report evidence for training-related neuroplasticity in the visual cortex, while other studies suggest that improvements simply reflect inadequate eye fixation control during perimetric prediagnostics and postdiagnostics.
Methods and analysis To improve diagnostics, a new eye-tracking-based methodology for visual field analysis (eye-tracking-based visual field analysis (EFA)) was developed. The EFA is based on static automated perimetry and additionally takes individual eye movements in real time into account and compensates for them. In the present study, an evaluation of the EFA with the help of blind spots of 58 healthy participants and the individual visual field defects of 23 clinical patients is provided. With the help of the EFA, optical coherence tomography, Goldmann perimetry and a Humphrey field analyser, these natural and acquired scotomas were diagnosed and the results were compared accordingly.
Results The EFA provides a SE of measurement of 0.38° for the right eye (OD) and 0.50° for the left eye (OS), leading to 0.44° of visual angle for both eyes (OU). Based on participants’ individual results, the EFA provides disattenuated correlation (validity) of 1.00 for both OD and OS. Results from patients suffering from cortical lesions and glaucoma further indicate that the EFA is capable of diagnosing acquired scotoma validly and is applicable for clinical use.
Conclusion Outcomes indicate that the EFA is highly reliable and precise in diagnosing individual shape and location of scotoma and capable of recording changes of visual field defects (after intervention) with unprecedented precision. Test duration is comparable to established instruments and due to the high customisability of the EFA, assessment duration can be shortened by adapting the diagnostic procedure to the patients’ individual visual field characteristics. Therefore, the saccade-compensating methodology enables researchers and healthcare professionals to rule out eye movements as a source of inaccuracies in pre-, post-, and follow-up assessments.
- diagnostic tests/investigation
- field of vision
- rehabilitation
- vision
- visual (cerebral) cortex
- visual perception
- glaucoma
This is an open access article distributed in accordance with the Creative Commons Attribution Non Commercial (CC BY-NC 4.0) license, which permits others to distribute, remix, adapt, build upon this work non-commercially, and license their derivative works on different terms, provided the original work is properly cited, appropriate credit is given, any changes made indicated, and the use is non-commercial. See: http://creativecommons.org/licenses/by-nc/4.0/.
Statistics from Altmetric.com
- diagnostic tests/investigation
- field of vision
- rehabilitation
- vision
- visual (cerebral) cortex
- visual perception
- glaucoma
Key messages
What is already known about this subject?
Precise and reliable visual field diagnostics is of crucial importance when diagnosing progression in eye diseases or evaluating rehabilitation after brain lesions. Several therapeutical approaches, targeting visual field loss after stroke, are based on the principle of ‘visual restitution’. This controversial concept supports the idea to reactivate lesioned areas in the visual cortex by repeated stimulation with bright light impulses. The essence of this controversy is largely due to inaccuracies in pre-, post-, and follow-up assessments.
What are the new findings?
An eye tracking-based methodology was developed that allows highly customisable automated perimetry with saccade compensation in real time. Thus, patients are unable to compensate voluntarily or involuntarily for their individual blind areas.
How might these results change the focus of research or clinical practice?
Our eye tracking-based methodology can be used for various scientific and clinical domains where precise and reliable visual field diagnostics are indispensable. Further, our concept can be implemented in established or future perimetric assessment routines and instruments.
Introduction
Approximately, 12% of patients suffering from traumatic brain injury1 and 35% of patients suffering from consequences of a stroke are afflicted by homonymous haemianopia,2 that is, blindness in half of the visual field. Because animal studies indicate that damaged neurons in the visual cortex recover after neuropsychological intervention,3 4 cortical blindness is of interest to the research field of neuroplasticity. A widely used technique in trying to improve the visual field in patients suffering from visual field defects is ‘visual restitution training’ (VRT). The hypothesis is that—by stimulating the border area between the intact and the damaged visual area with bright light impulses—neurons in the corresponding area of the visual cortex can be reactivated.5 It is suggested that 15% of remaining, functionally intact neurons are sufficient to stimulate activity in lesioned areas.6 This could, in turn, lead to plastic cerebral changes and result in a partial restitution of the visual field.7
Some studies report considerable training effects with neuropsychological trainings such as VRT, for example, reactivating up to 17.2% of the formerly blind visual field, indicating training-related neuroplasticity in the visual cortex.8–14 Other studies, in contrast, did not find (significant) effects and hypothesise about the potential influence of eye movements on the validity of visual field diagnosis15–18—hence the effect of neuropsychological trainings is still controversially discussed.19–23 Thus, a reliable tool for visual field diagnostics is required to achieve robust and credible evidence for the effects of restitution trainings, in particular, and for the issue of neuroplasticity within the visual cortex, in general. Ideally, such a perimetric tool would be objective, highly reliable and it should preclude compensation strategies.
Methods
The newly developed diagnostic methodology is based on the principles of traditional static automated perimetry and called ‘eye tracking-based visual field analysis’ (EFA). The innovative aspect of the EFA is that it makes use of an eye tracker for various control and adaptive functions during the process of visual field diagnosis (see figure 1).

Functionality of the newly developed methodology for visual field diagnosis, the eye tracking-based visual field analysis. The left panel (Gaze Control) illustrates the fixation control mechanism, which prompts the patient to correct his/her gaze in case of a too large deviation (e.g. >3°) from the fixation cross (schematically illustrated by the red cross at the bottom). Prompting the patient to correct his/her gaze occurs by animating the central fixation cross (ie, it becomes transiently enlarged). The right panel (Gaze Adaptation) illustrates the gaze-contingent adaptation of the location of the to-be-detected stimulus. The black dot at the bottom indicates the pupil and the to-be-fixated location; the grey dot indicates the actual fixation location—the presentation of the stimulus (at the top) is adapted accordingly in real time.
The principles are twofold: first, if the patient’s gaze deviates to a predefined value of visual degree (eg, more than 3° from the fixation cross), then the stimulus is not presented, and the patient is prompted to redirect his/her gaze to the fixation cross (see left panel of figure 1). The presentation of such a ‘failed’ stimulus resumes after the fixation location of the patient is again registered as appropriate. Second, if the patient fixates within a predefined area around the fixation cross, the software performs an adaptation process (see right panel of figure 1), which calculates the distance between the actual fixation of the patient and the fixation cross. This distance is used to automatically adapt the location of the presented stimulus in real time and is based on the pioneering work of Fendrich et al.24 This feature precludes that the diagnosis is unduly influenced by (involuntary) compensation strategies such as (micro) saccades during the diagnosis.
The EFA was coded in SR Research Experiment Builder (V.2.2.1) and is based in its current version on a Desktop Mounted EyeLink 1000 Plus Eye Tracking System (SR Research, Ottawa, Canada). Stimuli were presented on a 24-inch liquid crystal display (LCD) monitor (BenQ XL2411) (Taipeh, Taiwan), which was operated with a resolution of 1920×1080 px and 120 Hz refresh rate. Eye tracker sampling rate was set to 1000 Hz and maximal calibration deviation was limited to <0.5°. Stimuli were presented for 250 ms and had a luminance of 10 cd/m², which represents the standard value established by Goldmann.25 The stimuli had a dimension of 22.18 mm2, which corresponds to 17 px2 on screen  , which is close to the Goldman marker size of IV (16 mm2). Stimuli were presented at a random rate every 200–1500 ms. Participants were diagnosed monocularly sitting in a distance of 400 mm to the screen stabilised by a chin and forehead rest. This arrangement led to a retinal stimulus size of 12.145 µm2
  . The room was evenly and constantly illuminated (approximately 30 lux), quiet and conveniently ventilated.
Participants
There were three samples of participants. In the first (healthy) sample, the retest reliability of the EFA was assessed with the help of the participants’ blind spots. In the second (healthy) sample, the validity of the EFA was estimated by comparing its results with the results of optical coherence tomography (OCT) from Heidelberg Engineering (Spectralis 2014; Heidelberg, DE). The third (clinical) sample consisted of two groups: (1) patients suffering from visual field defects stemming from cortical lesions and (2) patients suffering from visual field defects stemming from glaucoma.
In the cortical lesions group, the individual visual field defects were assessed with the EFA and the results were compared with results (Goldmann III/3e) from Goldmann perimetry (GP) from HAAG-STREIT (Model 940; Köniz, CH) and with results (30–2 SITA Fast) from a humphrey field analyser (HFA) from ZEISS (Model 745i; Oberkochen, DE). Patients were excluded if dioptre was greater than +3 dpt or if other conditions (eg, glaucoma) were reported. Additionally, clinical patients’ anamnestic history was collected and—if necessary—further examined ophthalmologically (acuity, intraocular pressure, ocular fundus) and neuropsychologically (memory, attention, executive functions). Patients were excluded from the study if clinically significant comorbidities were found—besides visual field loss resulting from cerebral lesions.
In the glaucoma group, the individual visual field defects were assessed with the EFA and the results were compared with the same HFA as in the cortical lesions group. Glaucoma patients’ acuity was corrected during both diagnoses (see below for details).
Sample 1 consisted of 30 healthy participants (22 women) with a mean age of 22.1 years (SD=2.5). Participants were tested two times with the EFA with a mean time delay of 36 hours between the two test appointments. The rationale is that individual characteristics of the participants’ blind spots served as an objective criterion for the reliability of the EFA.
Sample 2 consisted of 28 healthy participants (20 women) with a mean age of 24.8 years (SD=3.1). Participants’ blind spots were first located in our lab with the EFA and—on a second appointment—with an OCT at the University Hospital Salzburg for Ophthalmology and Optometry. Mean time delay between the appointments was 63 days. Again, the blind spots served as an objective criterion for the validity of the EFA.
Sample 3 consisted of 23 clinical participants (10 women) with a mean age of 64.3 years (SD=18.8). Depending on subgroup (see above for details), patients were diagnosed with the EFA, GP and/or HFA. Similar to the logic of validity evaluation, results from individual characteristics of the patients’ blind areas served as an objective criterion for clinical applicableness of the EFA.
Patient involvement
Patients were not directly involved in the design of this study. Written informed consent was obtained from all patients (and participants). The study design was approved by the ethics committee of the University of Salzburg.
Reliability of the EFA
The area around the expected location (from 9° to 25°) of the participants’ blind spots of sample 1 was analysed with the EFA. The results from the two data sets (test and retest appointment) were then compared regarding the individual extent and location of the respective participants’ blind spots. Classical test theory postulates that the reliability of a test instrument is calculated by assuming that there is a ‘true value’ that can be approximated by the instrument’s results, which are biased by normally distributed error. By calculating the difference between the results of two (or more) test appointments and combining these values with the results from correlation, the SE of measurement (SEM) can be calculated:
Validity of the EFA
The area around the expected location (from 9° to 25°) of the participants’ blind spots of sample 2 was analysed with the EFA. OCT was used to analyse the respective participants’ individual blind spots location and extent. To provide comparability between the two diagnostic tools (EFA and OCT), the individual OCT fundus pictures were analysed and quantified to match the data structure of the EFA. First, by using analysis tools provided by Heidelberg Engineering OCT software (Heidelberg Eye Explorer V.1.10.2.0), the distance between the participants’ fovea centralis and the blind spot were charted in μm. By combining information from fundus photography and b-scan, the exact structure of retinal characteristics was assessed. Bruch’s membrane was used to individually quantify the border areas of the blind spot. The gained and quantified information about every participant’s individual retinal anatomy was used as a criterion of validity for the EFA.
Second, to make the quantified data from OCT and the EFA comparable, data from OCT were converted from a metric dimension (μm) into two-dimensional coordinates (px), based on the properties of the monitor used for the EFA.
Clinical applicableness of the EFA
For patients suffering from cortical lesions, the inner 10° to 15° of participants’ visual fields were analysed and compared results of the EFA, HFA and GP. To shorten the EFA diagnosis procedure, no stimuli were presented in those areas, which were uninformative for the diagnosis, that is, areas which were certainly intact and certainly blind, according to previous diagnostics conducted with the HFA and GP. In this way, it was achieved that the diagnostics for 5° of visual angle lasted around 9–13 min (per eye)—depending on the number of stimuli presented. For the visual field assessment of patients suffering from glaucoma, the EFA was configured to match the HFA 30–2 (SITA Fast) diagnostics procedure (see below for details) and compared results from both methodologies.
Results
Reliability results from sample 1 show that the median deviation between the two EFA test appointments is 1.08° (SD=0.662°) for the right eye (OD) and 1.06° (SD=0.797°) for the left eye (OS). The respective correlation (retest reliability) is r=0.667 (p≤0.001) (OD) and .607 (p≤0.001) (OS), resulting in a SEM of 0.38° (OD) and 0.50° (OS). Validity results from sample 2 show that the median deviation between the EFA test appointment and OCT test appointment is 1.09° (SD=0.508°) for the right eye and 0.95° (SD=0.536°) for the left eye. The respective correlation (validity) is r=0.813 (p≤0.001) (OD) and .786 (p≤0.001) (OS). The disattenuated correlation (validity)26 27 of the EFA is 1.00 for both eyes. Mean reaction time to displayed stimuli during the EFA was 356 ms (SD=69), indicating that all healthy participants’ behaviour and coordination was—with a mean age of 23.5 years (SD=2.8)—within age norm.28
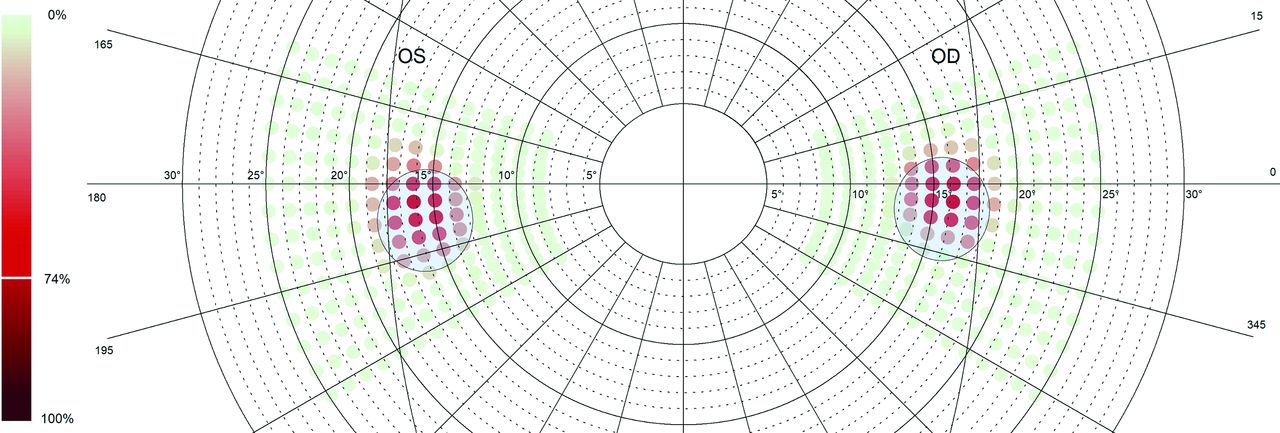
Figure 2 shows the blind spot locations for both eyes of all participants from samples 1 and 2 (n=58). Colour range denotes quantity of stimuli not seen by the participants. This means the darker the colour, the more often the respective stimulus was not detected by the participants. Dots in the centre of the cluster were the ‘most undetected’ stimuli accumulating to not seen by 74% of the participants. Blue ellipses represent the blind spots’ median location of all participants of sample 2 as diagnosed by OCT.

Illustration of combined results from retest data of sample 1 (green to red dots) based on results from eye tracking-based visual field analysis (EFA) and validity data of sample 2 (blue ellipses) based on results from optical coherence tomography (OCT). Figure shows data from right eye (OD) and left eye (OS) from both the retest reliability sample and the validity sample. Green to red colour gradient reflects the amount of stimuli seen (green) and not seen (red) by the participants (ie, the darker the red, the more often the respective stimulus was not detected). Dots in the clusters’ centre—representing the participants’ blind spots—were the most undetected stimuli accumulating to not being seen by 74% of the participants. Median location of OD cluster centre lies 15.60° (SD=1.02°) temporal, 95% CI (15.23° to 15.98°) and 0.83° (SD=1.03°) ventral, 95% CI (0.45° to 1.21°) and median location of OS cluster centre lies at 15.68° (SD=1.03°) temporal, 95% CI (15.30° to 16.05°) and 1.43° (SD=1.18°) ventral, 95% CI (0.99° to 1.86°). Blue ellipses represent the median location of all participants of sample 2 as diagnosed by OCT. Median location of OD blind spot lies 15.38° (SD=0.98) temporal, 95% CI (15.02° to 15.74°) and 1.55° (SD=0.68) ventral, 95% CI (1.29° to 1.80°). Median location of OS blind spot lies 15.40° (SD=0.93) temporal, 95% CI (15.06° to 15.74°) and 2.26° (SD=0.81) ventral, 95% CI (1.96° to 2.56°). Median extent of blind spots (OD) are (a: minor axis, b: major axis): a=2.86° (SD=0.27), 95% CI (2.75° to 2.96°) b=3.21° (SD=0.26), 95% CI (3.12° to 3.31°) and median extent of blind spots (OS) are: a=2.84° (SD=0.21), 95% CI (2.76° to 2.91°) b=3.15° (SD=0.19), 95% CI (3.08° to 3.22°). Therefore, median diagnostics differences between the EFA data of sample one and OCT of sample 2 are 0.50° for the right blind spot (OD) and 0.55° for the left blind spot (OS).
Subsequently, visual field results from one incidental clinical finding from a participant, originally from sample 2, who suffered from toxoplasmosis resulting in retinal lesions are presented. Furthermore, the visual field data from 11 patients suffering from the consequences of lesions in visual cortical areas and 11 patients suffering from glaucoma, resulting in visual field defects are presented.
Incidental finding
The EFA results of participant 12 (p12) (50–55 years old/woman) indicated a scotoma in the left eye beginning approximately 16° temporally and 1° dorsally to the horizontal line. Informed about this incidental finding p12 reported a chronic visual field defect in her left eye originating from a ‘retinal inflammatory disease’ she suffered in 1989. The EFA was reconfigured to capture a wider area of the upper visual field and p12 was invited to undergo the analysis once more and additionally conduct a visual field test with an HFA in the University Hospital Salzburg for Ophthalmology and Optometry. Patient’s mean reaction time to displayed stimuli during the EFA was 433 ms (SD=76), indicating that patient’s behaviour and coordination were age-appropriate.28 Figure 3 shows results from both diagnostic methods, indicating a concordant picture regarding the location and extent of the located scotoma.

Visual field test result of the left eye of participant 12—showing diagnostics sheets from a Humphrey field analyser (left panel) and eye tracking-based visual field analysis (right panel)—mapping an arching scotoma in the upper visual field. The high similarity in extent and location of the scotoma between the two diagnostics methods is apparent.
Cortical lesions
The visual fields of 11 patients (four women) with a mean age of 55.2 years (SD=22.6) were examined. Nine patients (two women) suffered from stroke (left (four patients) and right (five patients) arteria cerebri posterior)—resulting in visual field defects (seven quadrantanopia and two hemianopia). One female patient suffered from traumatic brain injury and one female patient suffered from brain lesions after surgery, resulting both in quadrantanopia inferior left. All patients’ visual fields were diagnosed with the help of an HFA, GP and the EFA over a period of around 4 weeks. Mean time duration from stroke or other clinical incident was 37.2 months (SD=63.8). Patients were excluded if stroke or other clinical incident was less than 3 months in the past, ensuring that no spontaneous remission biased diagnosis. The complete inner 30° of the patients’ visual fields were diagnosed with the help of an HFA and GP in the University Hospital Salzburg for Ophthalmology and Optometry. Based on these results, the EFA was configured individually to specifically diagnose the border area between intact and defect visual field in high resolution. Patients’ mean reaction time to displayed stimuli during the EFA was 386 ms (SD=88), indicating that all patients’ behaviour and coordination were within age norm.28 Figure 4 shows visual field test results from two exemplary patients (see online supplemental figures 1 to 5—for all patients). Results from the EFA match largely with data from the HFA and GP and show evidently reliable and precise—due to the eye tracking-based diagnostics process—a significant finer resolution in border areas between defect and intact areas.
Supplemental material
Supplemental material
Supplemental material
Supplemental material
Supplemental material
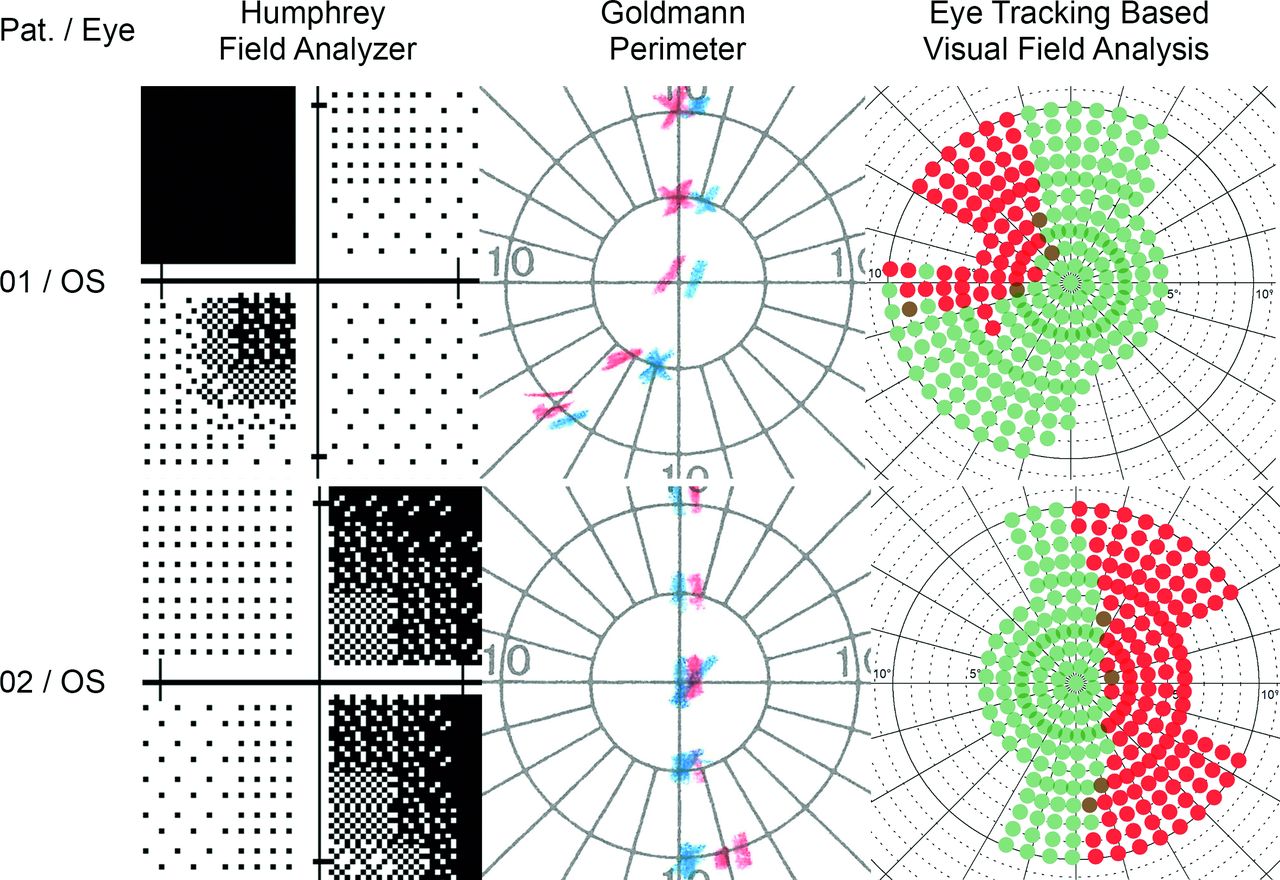
Illustration of visual field test results from the left eye of two exemplary patients suffering from cortical lesions. Note the increase in resolution and detail regarding the border area between intact and defect visual field from left (Humphrey field analyser), to middle (Goldmann perimetry) and to right panel (eye tracking-based visual field analysis). Due to the near future application for EFA, that is, the evaluation of the effects of visual restitution therapy (VRT)—we focused on diagnosing the inner 10° of visual angle. Our clinical experience shows that patients especially suffer the most from defects near their macula. This is because defects in these areas handicap patients in their daily routines (eg, navigation, reading or interpersonal contact). Therefore, potential rehabilitating effects of VRT in these areas of the visual field would especially be clinically relevant and beneficial for patients. (Note: the blue and the red markers in the Goldmann charts represent marker sizes I and III, respectively).
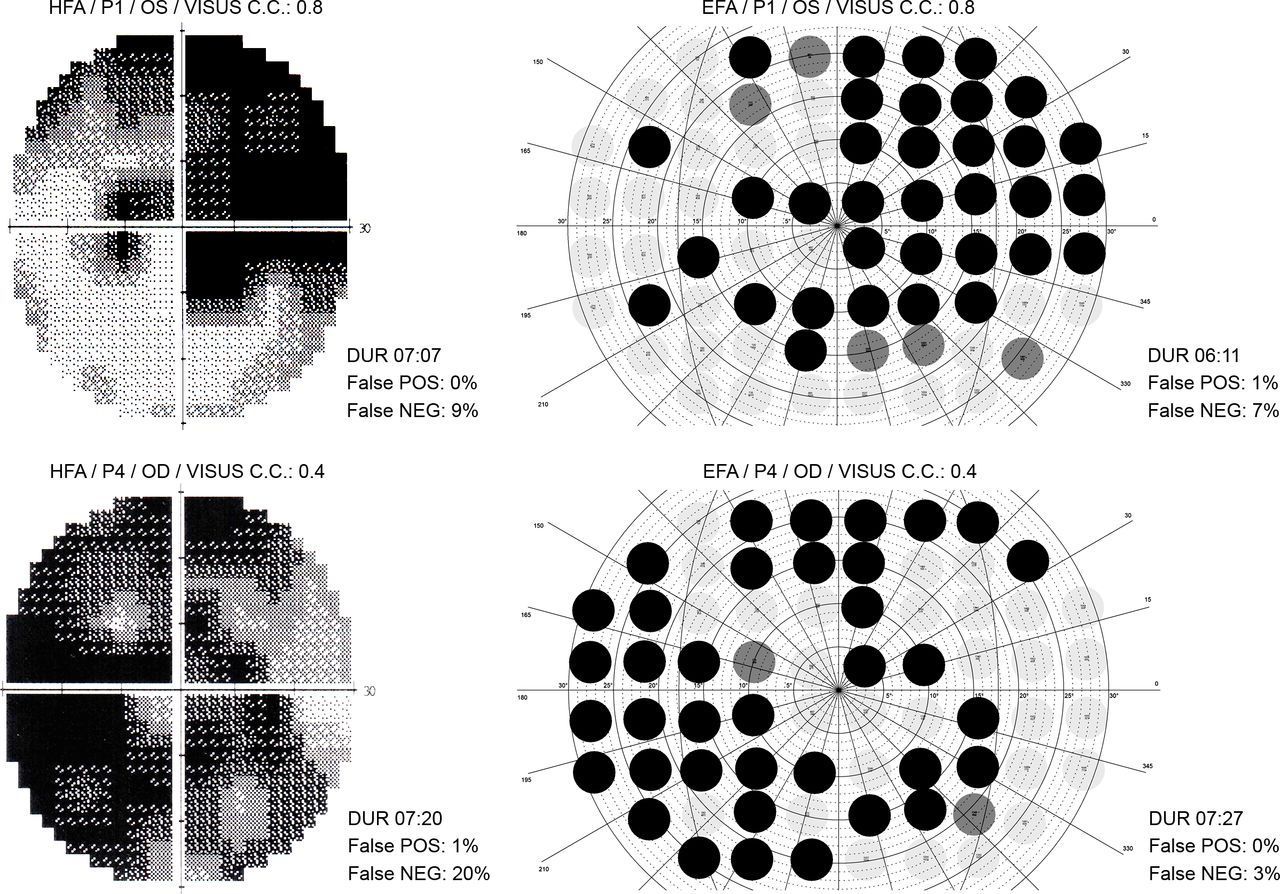
Glaucoma
The visual fields of 11 patients (5 women) with a mean age of 74.2 years (SD=7.6) suffering from glaucoma were examined. Patients’ visual fields were diagnosed in the glaucoma centre of the University Hospital Salzburg for Ophthalmology and Optometry by means of an HFA and the EFA. Patients’ acuity was corrected during both diagnosis and patients’ mean Visus cum correctione was 0.79 (SD=0.28) (OD) and 0.74 (SD=0.32) (OS). Figure 5 shows visual field test results from two exemplary patients (see supplementary material—online supplemental figures 6 to 8—for all patients). Results indicate that findings are largely comparable between the two methodologies. Furthermore, mean diagnostic duration (minutes:seconds) was similar between the HFA (06:37 (SD=01:19)) and the EFA (06:14 (SD=01:36)). Patients’ mean reaction time to displayed stimuli during the EFA was 479 ms (SD=120), indicating that all patients’ behaviour and coordination were age appropriate.28
Supplemental material
Supplemental material
Supplemental material

Illustration of visual field test results from a Humphrey field analyser (HFA) and the eye tracking-based visual field analysis (EFA) of two exemplary patients (patient 1 and patient 4) suffering from glaucoma. The visual field plots indicate that the two methodologies produce comparable diagnostics results. However, the advantage of our eye tracking based methodology EFA is that no eye fixation loss of the patient can occur during assessment. In addition, even small eye movements are adapted in real time by adjusting the presented light stimuli, increasing the reliability and accuracy of the procedure substantially. During our visual field examinations with the EFA, we could observe on the eye tracking computer how patients—although frequently asked to keep their gaze on the central cross—repeatedly made short eye search movements into their blind visual areas. The EFA adapted unnoticeably this compensation strategies and therefore eliminates the need for constant monitoring and admonition by healthcare specialists during the diagnosis procedure.
Discussion
The present study introduced a novel eye-tracking aided perimetric methodology. Traditional automated perimetric methods - such as the HFA from ZEISS—have one major limitation: they lack a stringent eye fixation control, which allows the patient to (unconsciously) resort to compensation strategies. Although there are approaches to control for compensatory eye movements—like presentation of test stimuli in the respective patient’s blind spots or inspection of eye position with the help of a camera to enable the examiner to admonish the patient when central fixation is not adhered—the task keeps challenging for both patients and examiners. Examiners must look continuously at the camera image and observe the patient while they could, for example, take care of other patients, prepare further tests, or study the patient’s medical history. The assessment is also challenging for patients who learnt in clinical rehabilitation to compensate for blind areas in their visual field with frequent saccades toward their scotomas. These patients must suppress their trained behaviour to scan their environment continuously.16 The desire to do ‘well’ in a visual field test can also be observed repeatedly in clinical practice, even in patients with no experience in compensatory eye movement training. There is also evidence that reduced attention during visual field tests promotes patients’ eye movements, potentially leading to inaccuracies in the assessment.29 Indeed, our clinical experience shows that many patients find it difficult to maintain strict fixation on a central point. It is understandable that perimetry can be particularly tense for patients, when their permission to continue to drive a vehicle or to practice their profession depends on the results of a visual field examination. In a similar vein, stringent eye fixation control is of utmost importance in a scientific context. Studies regarding the assessment of progression in eye diseases or amelioration of visual functions after neuropsychological interventions depend on reliable and accurate visual field tests.19
Therefore, we developed a perimetric method that would simultaneously facilitate automated visual field diagnosis for both patients and examiners, as well as to further improve the reliability and accuracy of visual field testing with the help of a strict eye fixation methodology. The EFA offers—depending on the size and dimension of the test screen—flexibility by providing patients an area of tolerance (in this proof-of-concept study:~3°) in which he/she is free to look around without affecting accuracy of the diagnosis and getting warned by the system. Our experiences with stroke and glaucoma patients show that this was indeed a significant facilitation for the patients during visual field assessment. After the examination with the EFA, patients regularly reported back to us that they were able to concentrate more on the procedure itself, because they did not have to concentrate too hard on keeping a steady, central fixation. This means that the EFA also facilitates the diagnostics procedure for examiners, as they do not need to caution patients continuously and, by that, inadvertently distract the patient again from the current behavioural task at hand. This realisation is especially important, because the quality of a visual field test depends significantly on the respective patient’s cognitive resources and motivation.29–31
By demonstrating the high customisability of the EFA in this study, depending on the diagnostics task, we argue that the methodology of eye tracking supported visual field diagnostics is feasible to extend any existing automated perimetric methodology. Besides automated static perimetry (eg, HFA), our methodology is also practicable for devices offering automated kinetic perimetry (eg, Octopus 900 from Haag-Streit), as the logic of the adaptation algorithm of the EFA is applicable for both moving and static test stimuli. Thus, the use of eye tracking does not increase any automated test duration or test complexity. Rather, eye tracking reliably eliminates the source of error that results from uncontrolled patients’ eye movements that occur consistently during assessment. Our methodology of the real-time gaze contingent adaptation algorithm of the EFA compensates discreetly for confounding eye movements without increasing test duration. In contrast, devices, such as the Octopus 900, stop diagnostics when the patient’s gaze changes and continue when eye fixation is regained.
Limitations and future directions
During our clinical studies, we experienced some patients having issues with the eye-tracking calibration procedure before the actual visual field assessment. This was due to problems with remaining a steady fixation on the portrayed calibration points or because these points were accidentally displayed in blind areas and therefore had to be searched for by the patient first. In any case, using a pencil to assist patients to fixate or find the calibration points helped considerably. However, to enable a largely independent visual field measurement (especially in the light of the potential implementation of e-health procedures), further development regarding the calibration process of the eye tracker should be considered. One conceivable possibility would be, for example, displaying stimuli moving from the patients’ visual centre to the periphery, which then remain stationary for a moment to trigger the calibration procedure by eye fixation and thus enabling a gaze-guided routine that can be easily and independently performed by patients.
The present proof-of-concept study investigated the reliability and validity of the eye-tracking aided perimetry with healthy participants and in comparatively small samples of patients with rather homogenous visual deficits (ie, scotomas due to cortical lesions, in the first sample, and due to glaucoma in the second). For assessing the applicability of the new methodology for a wider range of visual deficits (eg, age-related macular degeneration (AMD), diabetic retinopathy, acute central retinal artery occlusion) a larger and a clinically more diverse sample should be investigated in the future.
With regard to portability and use in everyday clinical practice, the development of a more portable version of the EFA would be desirable. In this way the EFA’s integrated eye tracking methodology conceivably enables other fields of application in the diagnosis of eye diseases and in this way makes assessment even more accessible. For example, stringent eye fixation control potentially allows for increased reliability of diagnosis in patients suffering from AMD by ensuring high accuracy through eye tracking when decentralised fixation is necessary. This concept requires appropriate adaptation of the EFA methodology and renewed (clinical) validation. Likewise, recent developments in portable VR goggles with integrated eye trackers, in combination with wireless transmission protocols, could enable completely new and significantly improved diagnosis, rehabilitation and telemedical procedures. This approach of developing a highly portable perimetric device will additionally help to achieve a large and clinically diverse sample for the assessment of the applicability of the method for routine clinical usage and for a broader spectrum of visual deficits. Because eye trackers can both monitor and automatically correct the behaviour of patients during diagnosis and rehabilitation - even when no healthcare professional is directly on site - eye trackers could play a crucial role in ensuring reliability and validity of future e-health procedures.
Conclusion
Our results show that with modern eye-tracking technology both researchers and healthcare professionals can control effortlessly for confounding eye movements in patients suffering from cerebral visual field loss and eye diseases like glaucoma. Our study on the reliability and validity of this methodology indicates that eye-tracking is a valuable addition to standard procedures in scientific and clinical visual field diagnostics. Furthermore, our concept provides a scientifically sound basis for future developments in diagnosis and rehabilitation procedures of specific eye diseases and cerebral disorders.
Acknowledgments
The authors would like to thank Constanze Haslacher for her contributions on the implementation of the EFA, Maike Engel and Leoni Bernstorf for data acquisition and EFA configuration, Paul Lengenfelder for his support in test-theoretical questions, Lydia Hell, Lina Ertl, Clemens Strohmaier, Markus Lenzhofer and Anja-Maria Ladek from the University Hospital Salzburg for Ophthalmology and Optometry for their medical and orthoptic support and Jörg Bembennek from TOPCON for technical assistance.
References
Supplementary material
Supplementary Data
This web only file has been produced by the BMJ Publishing Group from an electronic file supplied by the author(s) and has not been edited for content.
Footnotes
Contributors Conception and design: MCL, FH, SH. Data acquisition: MCL, PM, HAR. Analysis and interpretation of data: MCL, SS, LV, HAR, SH. Writing publication: MCL, FH. Critical revision of publication: MCL, SS, LV, FH, PM, HAR, SH. Supervision: MCL, SH. Resources: FH, PM, HAR. Technical administrative and support: SS, LV.
Funding The following study is based on the funded project “Advanced Perimetry for the Evaluation of Neuroplasticity in the Visual Cortex” by the Austrian Science Fund (FWF) (Reference No. P31299).
Competing interests None declared.
Patient consent for publication Not required.
Ethics approval The following study was reviewed and approved by the Ethics Commission of the University of Salzburg (Reference number 39/2018).
Provenance and peer review Not commissioned; externally peer reviewed.
Data availability statement Data are available upon request.
Supplemental material This content has been supplied by the author(s). It has not been vetted by BMJ Publishing Group Limited (BMJ) and may not have been peer-reviewed. Any opinions or recommendations discussed are solely those of the author(s) and are not endorsed by BMJ. BMJ disclaims all liability and responsibility arising from any reliance placed on the content. Where the content includes any translated material, BMJ does not warrant the accuracy and reliability of the translations (including but not limited to local regulations, clinical guidelines, terminology, drug names and drug dosages), and is not responsible for any error and/or omissions arising from translation and adaptation or otherwise.