Article Text

Abstract
Objective To develop a prognostic tool to predict the progression of age-related eye disease progression using longitudinal colour fundus imaging.
Methods and analysis Previous prognostic models using deep learning with imaging data require annotation during training or only use a single time point. We propose a novel deep learning method to predict the progression of diseases using longitudinal imaging data with uneven time intervals, which requires no prior feature extraction. Given previous images from a patient, our method aims to predict whether the patient will progress onto the next stage of the disease. The proposed method uses InceptionV3 to produce feature vectors for each image. In order to account for uneven intervals, a novel interval scaling is proposed. Finally, a recurrent neural network is used to prognosticate the disease. We demonstrate our method on a longitudinal dataset of colour fundus images from 4903 eyes with age-related macular degeneration (AMD), taken from the Age-Related Eye Disease Study, to predict progression to late AMD.
Results Our method attains a testing sensitivity of 0.878, a specificity of 0.887 and an area under the receiver operating characteristic of 0.950. We compare our method to previous methods, displaying superior performance in our model. Class activation maps display how the network reaches the final decision.
Conclusion The proposed method can be used to predict progression to advanced AMD at some future visit. Using multiple images at different time points improves predictive performance.
- retina
- imaging
This is an open access article distributed in accordance with the Creative Commons Attribution 4.0 Unported (CC BY 4.0) license, which permits others to copy, redistribute, remix, transform and build upon this work for any purpose, provided the original work is properly cited, a link to the licence is given, and indication of whether changes were made. See: https://creativecommons.org/licenses/by/4.0/.
Statistics from Altmetric.com
Key messages
What is already known about this subject?
Previous studies showed that deep learning has great predictive capability for AMD progression when using a single colour fundus image.
What are the new findings?
Using multiple time points allows us to model the temporal aspect of the disease and improves predictive performance.
How might these results change the focus of research or clinical practice?
Future studies should greater consider the rate of disease progression in different patients.
Introduction
Prognostic models are an essential component of personalised medicine, allowing health experts to predict the future course of disease in individual patients.1 Advances in computing power and an abundance of data have allowed for increasingly sophisticated models to be developed. Most developed prognostic models use statistical methods such as logistic regression; these models require prior feature extraction, either manual or automatic,2 and are limited in the number of included variables. Feature extraction can be costly and time consuming, especially in imaging data. Deep learning offers the ability to avoid explicit feature extraction, allowing us to develop models without the need for handcrafted features. For this reason, deep learning is especially useful in imaging data. Prognostic deep learning models have been developed in several fields, primarily ophthalmology,3 cardiology4 and neurology,5 and several modalities, including MRI, optical coherence tomography (OCT), colour fundus photography and X-ray.
Current prognostic models that use deep learning to analyse imaging data, either use automatic feature extraction algorithms to extract known features or only consider a single time point. Models developed using feature extraction, train algorithms on annotated images to extract relevant features such as volumes in OCT data; those features are then fed into a traditional statistical model, see Refs. 3 6 7 for examples. Manual feature extraction is time consuming and requires expert readers. Yim et al8 proposed a method which automatically segments OCT layers before classification. This method outperformed human experts; however, automatic feature extraction requires annotations during training, which is not always available in situations when the features are unknown or difficult to quantify, such as is the case when using colour fundus imaging.
An alternative to explicit feature extraction is to use deep learning to extract features implicitly, such as used by Arcadu et al9 and Babenko et al.10 Many models take the previous available image and fit a pretrained convolutional neural network (CNN), with Inception V311 being a popular choice due to its generalisability and high performance in a variety of tasks. This method, unlike the feature extraction method, may be applied to any image even when features are not explicitly known; however, this creates a separate issue, by using only one image, these models may fail to capture the temporal pattern across time points. Most recently, Yan et al12 used Inception V3 to classify single images combined with genetic factors to predict progression to AMD. They found that images alone provided reasonable performance, and the inclusion of multiple genetic factors increased predictive performance; however, this work still only considered a single time point.
Here, we develop a prognostic model to predict the progression of disease, from longitudinal images. The proposed method is demonstrated on a dataset consisting of 4903 eyes with age-related macular degeneration (AMD), taken from the Age-Related Eye Disease Study (AREDS) dataset.13 The method is generalisable to any longitudinal imaging data. We show that by considering the time interval between images and adopting a method from time series analysis, we can provide significantly improved prediction performance.
Our contributions are as follows:
Propose a novel method to predict the future prognosis of a patient from longitudinal images.
Introduce interval scaling which allows for uneven time intervals between visits.
Demonstrate on the largest longitudinal dataset and attain state-of-the-art performance outperforming other state-of-the-art methods.
Materials and methods
Given images {X0…, Xi…, XN} at times {t0…, t1… tN} we wish to predict the diagnosis  at time
  , where
  does not necessarily hold, which is common in a clinical setting.
The proposed method consists of three stages, first, we use a pretrained CNN, namely Inception V3, with shared weights, to reduce each image to a single feature vector. Then, the feature vectors are combined, and an interval scaling is applied to account for the uneven time intervals, this weights the most recent time points as being more important in making the final prediction. Finally, a recurrent neural network classifies the images as progressing or non-progressing. An overview of the proposed framework is shown in figure 1.
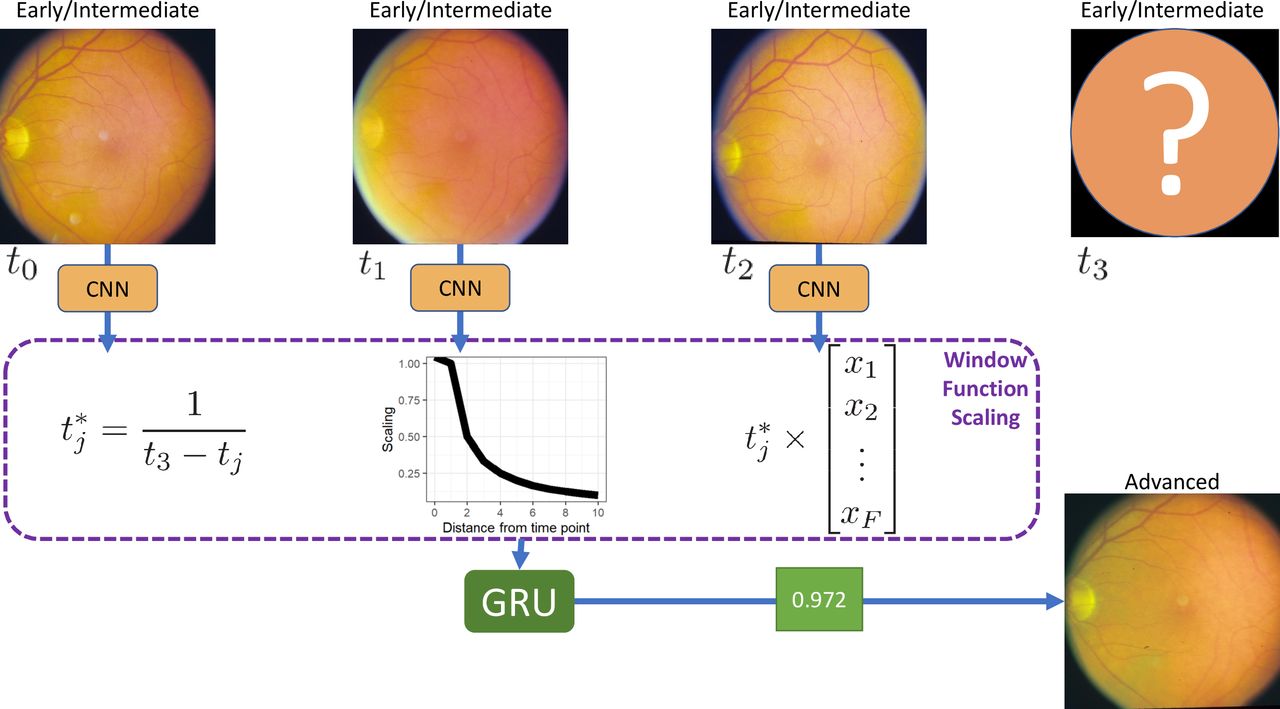
Overview of the proposed method. For each of the T time points, we fit a convolutional neural network (CNN) with shared weights, resulting in a vector of length F, per image. Each vector is multiplied by a corresponding interval scaling. The scaled vectors are combined into a single T×F matrix, and a gated recurrent unit (GRU) with sigmoid activation gives a probability of progression. For simplicity, three time points are shown; this method is extendable to any number of time points.
Inception V3
We begin by fine-tuning a pretrained CNN on each image, with shared weights, to extract feature vectors. CNNs are commonly used on imaging data and use multiple convolutional layers to produce feature maps which represent the original image. These feature maps are smaller than the original image which allows a fully connected layer to classify the features, with reasonable computational requirements. In our work, we chose Incpetion V311 pretrained on ImageNet.14 InceptionV3 increases accuracy over previous networks while remaining computationally efficient, through the use of factorised kernels, batch normalisation and regularisation. InceptionV3 is considered highly generalisable with a greater than 78.1% accuracy on the ImageNet dataset. The Inception V3 network results in a feature vector of length F=2048 for each image at each time point. This network has previously been used to provide state of the art results in single time point methods,9 10 12 and is used here as a feature extractor.
Interval scaling
To account for uneven time intervals, we implement a triangular window function to create a smoothing model. Whereas in a simple moving average model, the time points are weighted equally, smoothing models weight values closer to  as being more useful in the prediction. For each sequence of images at times,
  where
where  is the time point that we want to predict at, we rescale each time such that
  . The feature vectors for each image are then multiplied by their corresponding time interval scale. This scaling weights the images such that images closer to the time point of interest are considered more important than those observed at further time points, thus allowing the network to account for uneven time intervals.
GRU prediction
To predict whether the patient will progress to advanced AMD or not, we combine the interval corrected vectors into a  matrix, where T corresponds to the number of time points and F is the number of features. We apply a gated recurrent unit (GRU)15 with a filter size of 1, resulting in a single value. GRU was chosen as opposed to long short-term memory (LSTM)16 units, as GRU is more computationally efficient. LSTM units perform better on longer sequences; however, in this case, we only have three time points.17 The sigmoid activation function then scales the value between 0 and 1.
Data
Data consist of colour fundus images taken from the AREDS,13 the most extensive clinical study into AMD. All data used are available from dbGap (accession: phs000001.v3.p1). This was a retrospective study. Patients or the public were not involved in the design, or conduct, or reporting, or dissemination plans of our research. Patient consent is detailed in AREDS report no. 1.13
AMD is a leading cause of vision loss worldwide.18 There are two main stages of AMD, early/intermediate, defined by small-sized to medium-sized drusen, and advanced, defined by geographic atrophy (GA) or neovascularisation (nAMD).13 Drusen can be observed as yellow-white lipid deposits under the retina, varying greatly in size and morphology.19 The exact causes of AMD are unknown; however, studies have shown that smoking and genetics are significant risk factors.20 Risk factors for progression from early/intermediate to advanced AMD are also unknown; however, there is evidence that drusen and optic disk characteristics are important.21 22 Vision loss can be avoided with interventions such as anti–vascular endothelial growth factor (anti-VEGF) treatment; however, disease progression and the need for treatment are often hard to predict.23 This highlights the need for accurate prognostic models.
We extracted 4903 eyes, from 2702 patients, which had a minimum of four visits, complete with images and diagnoses at each visit, with no diagnosis of advanced AMD during the first three visits. The most recent visits meeting these criteria were always used. Advanced AMD was defined as either Central GA, nAMD, or both GA and nAMD. We used the last visit as ground truth to make our prediction based on the first three visits. Of the 4903 included eyes, 453 (9.2%) progressed to advanced AMD.
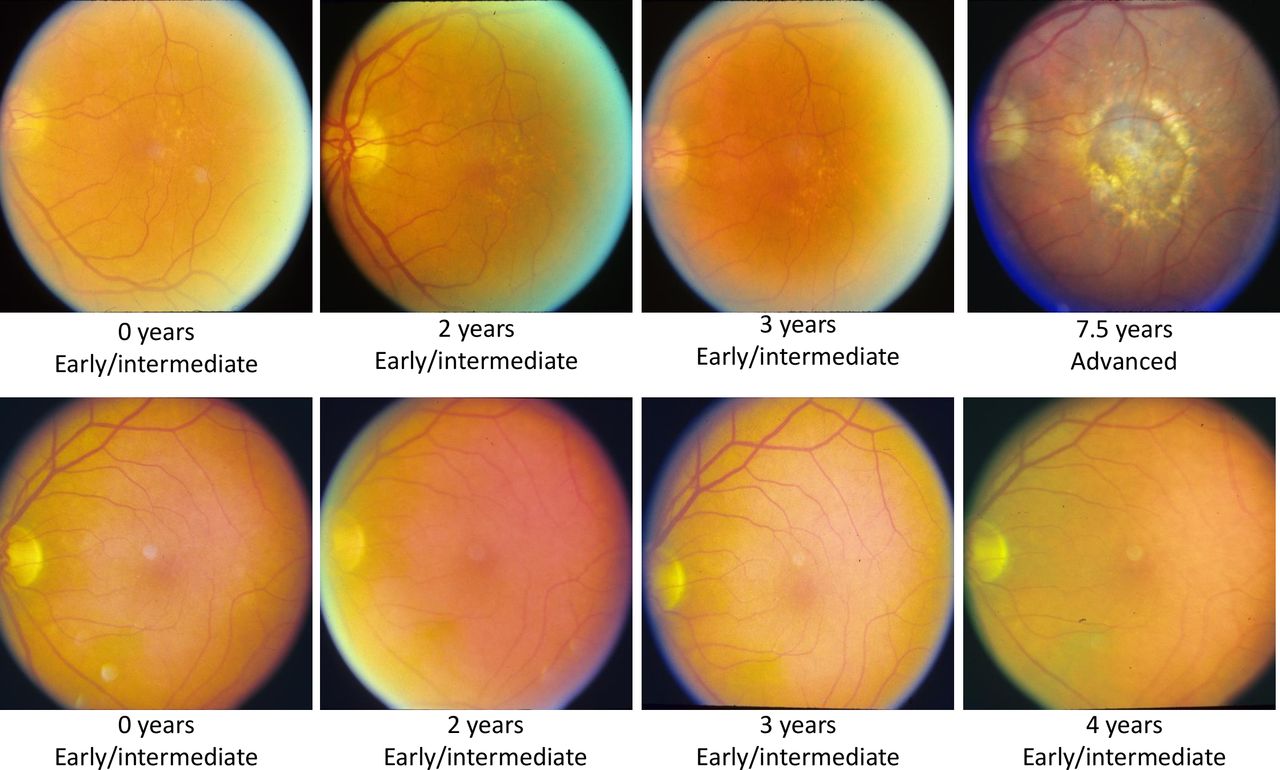
We randomly split the data into 60% training (2942 eyes, 272 progressing), 20% validation (981 eyes, 91 progressing), and 20% testing (980 eyes, 90 progressing) datasets. To reduce the possibility of data leakage, patients with both eyes included were kept within the same data split. Example images are given in figure 2.

Sample images from a progressing patient (top) and non-progressing patient (bottom). The first three images show early/intermediate age-related macular degeneration (AMD), while the fourth image shows whether they progressed to advanced AMD or not.
Preprocessing
Any images in the dataset where the patient had already progressed to advanced AMD, or without the required three previous images plus a fourth prediction image for prediction, were excluded. The images were automatically cropped by first calculating the difference between the original image and the background colour, an offset was added to the difference, and the bounding box was calculated from this. Image values were rescaled from between 0 and 255 to between 0 and 1. All images were resized to 256×256 pixels to reduce computational requirements. Right eye images were flipped, such that the optic disc on all images was located on the left. No prior feature extraction or segmentation/registration is required, such that our method is as generalisable to other diseases and modalities as possible. All preprocessing was automated, with no subjective human input required.
Computing
All analyses were carried out on a Linux machine with a Titan X 12 GB GPU and 32 GB of memory. Deep learning was conducted in Python V.3.7 using the Keras V.2.2.4 library24 with TensorFlow25 as the base library. Code is available on request. CIs were calculated using R V.3.4.4,26 with the pROC package.27
Optimisation was carried out with the Adam optimizer28 with an initial learning rate of 0.0001. We used binary cross-entropy as the loss function. If the loss did not improve after 10 epochs, then the learning rate was reduced to two-thirds. Model checkpoints and early stopping prevented overfitting, with the best model being picked according to the validation loss.
Metrics
We evaluate model performance using the commonly used area under the receiver operating characteristic curve (AUC),29 optimal sensitivity and optimal specificity, determined by Youden’s index. To assess whether the difference in these measures between models is significant, we construct CIs. De Long’s method30 is used to construct CIs for AUC, and bootstrapping with 2000 samples is used for sensitivity and specificity to calculate 95% CIs. Results from De Long’s test30 are also reported.
Results
In order to evaluate the performance, the proposed method is demonstrated on a dataset of AMD images with two and three time points and compared with a single time point method. For comparisons, the most recent visits were used.
Results are reported using two and three time points with our method, to assess the benefit of adding additional time points. We compare our results with the image only method used by Yan et al12 using a single time point. Taking the last available image, we fine-tune InceptionV311 pretrained on ImageNet14 to classify as progression or no progression.
The proposed method using three time points achieves an AUC, optimal sensitivity and optimal specificity of 0.950 (0.923 to 0.977), 0.878 (0.810 to 0.945), and 0.887 (0.866 to 0.907), respectively; this is a significant improvement over the single time point method which had AUC, sensitivity and specificity of 0.857 (0.823 to 0.890), 0.867 (0.796 to 0.937) and 0.760 (0.731 to 0.788). These results show a statistically significant increase in AUC and specificity and a non-significant increase in sensitivity when using the proposed three time point method over the previous single time point methods. De Long’s test gave a p value<0.0001, indicating a significant difference in AUCs. This significant increase in specificity without a loss in sensitivity shows our model can reduce false positives without increasing false negatives, over the previous model.
The method using two time points gave an AUC, sensitivity and specificity of 0.932 (0.905 to 0.958), 0.811 (0.730 to 0.892) and 0.892 (0.872 to 0.913). The three time point method had a non-significant increase over two time points. This may indicate that in this example, using more than two time points does not add any significant predictive value. Results are presented in table 1, and the receiver operating characteristic is shown in figure 3. Experiments without interval scaling were also conducted and showed a significant decrease in performance.
Area under the receiver operating characteristic (AUC) with 95% CIs constructed by De Long’s method

Receiver operating characteristic curve for the single time point InceptionV3 method, the proposed method with two time points and the proposed time point with three time points. Increasing the number of time points appears to increase the area under the curve. Faded bands show 95% CIs.
Class activation maps
To determine if our network is identifying the correct features and to reduce the blackbox nature of deep learning, we create class activation maps31 for each time point. We altered the top of the network slightly to achieve this, adding a dense layer after the GRU layer. While this altered network showed no significant change in predictive performance, it increased the network size by around a factor of 2. The class activation maps are shown in figure 4, alongside original images for comparison.

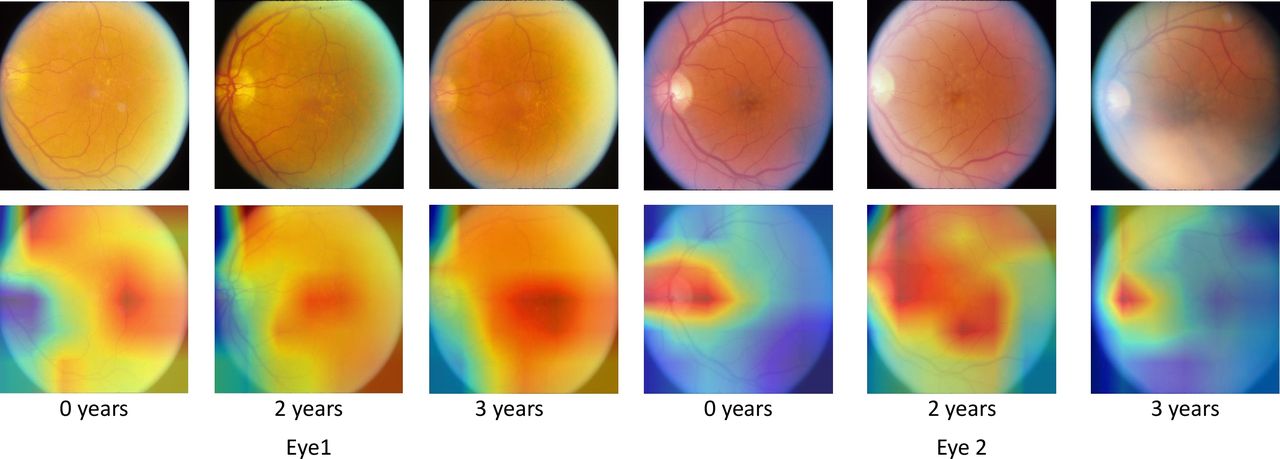
Class activation maps show the areas that the network finds useful in making the prediction. Original images are also shown for reference. The network correctly identifies areas of interest in age-related macular degeneration progression. In blurred images, drusen are difficult to see; the class activations show that the network uses the optic disk in to reach decisions in this case. All example images are taken from the testing dataset.
The class activation maps show that areas with high concentrations of drusen are considered relevant by the network; this is expected and shows that our network is identifying the correct features. In some images, the optic disk is also highlighted, confirming that optic disk characteristics are indeed important factors in AMD progression, as observed previously.21 22 In images where drusen are challenging to see, the network appears to use the optic disk solely in making a prediction. It is also interesting to note that the network seems to be surer of the area of interest in images that are closer to the prediction time point. In a clinical setting, these maps may are useful when justifying the prediction.
Discussion
In this work, we proposed a novel deep learning prognostic model to predict the future onset of disease. The proposed method addresses the challenge of analysing multiple longitudinal images with uneven time points, without the need for prior image annotation. Introducing an interval scaling was shown to improve performance over a single time point method significantly. We show that by taking into account the varying times between observed images, we can significantly improve the performance of a longitudinal prognostic model. Our method provides a statistically significant increase in specificity, which is critical in contexts such as screening. Our method uses time intervals meaning we can extend the interval to the observed outcome to predict further into the future; this is useful in a screening context. Future work is required to assess the generalisability of the proposed method to other diseases and to extend its use to a screening context. The disciform changes highlighted by the class activations maps may be similar to glaucoma; patients with glaucoma could potentially be wrongly classified. Glaucoma diagnosis was not available in this study, but could be used as a covariate in future work to prevent a wrong prognosis and to improve model performance. The proposed method is applicable to many other retinal diseases such as glaucoma and diabetic retinopathy, and could even be used outside of ophthalmology. Our work aims to predict progression at a future visit, whenever that is; future work is needed to assess the models use for dynamic prediction.
Acknowledgments
The authors would like to acknowledge the US Eye Institute for the use of the AREDS dataset.
References
Footnotes
Contributors YZ suggested the idea for the manuscript and contributed to the deep learning aspect. JB conducted experiments and wrote the first draft of the manuscript. SH contributed to the clinical knowledge in the manuscript. All authors contributed to the writing of the final manuscript.
Funding This work was partially supported by EPSRC DTP Studentship (#2110275, EP/R513271/1) and the Institute of Life Course and Medical Sciences, University of Liverpool, UK.
Competing interests None declared.
Patient and public involvement Patients and/or the public were not involved in the design, or conduct, or reporting, or dissemination plans of this research.
Patient consent for publication Not required.
Provenance and peer review Not commissioned; externally peer reviewed.
Data availability statement Data may be obtained from a third party and are not publicly available.