Article Text

Abstract
Objective To validate the extrapolated norms or e-norms methodology in establishing a reference range for the biometric data used for intraocular lens power calculation.
.
Methods and Analysis All measurements were performed with an optical low-coherence reflectometer. A novel technique, the e-norms methodology, was used to determine the normative values of measurements.
Results Eyes (n=500) were measured to evaluate the axial length (AL), K readings (Ks), anterior chamber depth (ACD) and lens thickness (LT). Using the e-norms methodology, the normal AL ranged from 22.50 to 24.50 mm (mean=23.50 mm), with medium-long eyes between 24.51 and 24.99 mm and the long eyes measuring 25.00 mm and longer; the medium-short eyes ranged from 22.01 and 22.49 mm, with the short eyes measuring 22.00 mm and shorter. Normal values ranged from 2.50 to 3.50 mm for ACD (mean=3.00 mm), from 4.40 to 5.44 mm for LT (mean=4.92 mm), and from 42.50 to 44.82 dioptres for Ks (mean=43.66 dioptres).
Conclusion Measurements of the biometric mean values compared favourably with published data. The e-norms methodology assisted in establishing a biometric reference range. Furthermore, it allowed us to cluster patients into groups based on AL differences.
- imaging
- anterior chamber
- aqueous humour
- eye (globe)
- lens and zonules
This is an open access article distributed in accordance with the Creative Commons Attribution Non Commercial (CC BY-NC 4.0) license, which permits others to distribute, remix, adapt, build upon this work non-commercially, and license their derivative works on different terms, provided the original work is properly cited, appropriate credit is given, any changes made indicated, and the use is non-commercial. See: http://creativecommons.org/licenses/by-nc/4.0/.
Statistics from Altmetric.com
Key messages
What is already known about this subject?
Normal values for biometric data used for intraocular power calculation vary according to different studies.
What are the new findings?
A novel technique, the extrapolated norms or e-norms method, is used to establish reference axial length, keratometry, anterior chamber depth and lens thickness values.
The e-norms methodology is validated as a trusted method to calculate the mean values of ophthalmic measurements.
How might these results change the focus of research or clinical practice?
The e-norms methodology also allows the extraction of reference biometric values and cluster patients into groups based on axial length differences.
Introduction
The extrapolated norms or e-norms methodology makes it possible to derive a cohort’s ‘normal’ values from a laboratory population using a behaviour displayed by variables derived from normal individuals, one that distinguishes them from variables that are derived from individuals with pathology.1 This behaviour is referred to as ‘e-norms clustering’, whereby the range of a laboratory variable obtained in normal individuals is smaller than the range of the laboratory variable obtained in abnormal individuals. Using this methodology, one can then identify and extract ‘normal’ values from patients’ data sets by using this property of small versus large differences between successive values.
The e-norms method has been validated to date in a wide variety of neurophysiological applications.2 3 Our study represents the first attempt to use it in evaluating biometric ocular data. In this retrospective study, we evaluated the biometric data used for intraocular lens (IOL) power calculation, namely the axial length (AL), keratometric readings (Ks), anterior chamber depth (ACD) and lens thickness (LT) values, in a series of 500 consecutive cataractous eyes of 500 patients scheduled for cataract surgery, and we applied the e-norms methodology to extrapolate the likely normative values. To validate the new methodology in ophthalmic biometry, the results were compared with the results of four other studies from the same practice.4–7
Materials and methods
Study population and data collection
This was a non-interventional study comprising a retrospective chart review of patients with a history of biometry examination prior to cataract surgery at one centre. A waiver of informed consent was granted to allow the use of de-identified patient data.
We analysed the measurements taken from 500 eyes of 500 patients scheduled to have cataract surgery between January 2017 and December 2017. All measurements were taken by the Lenstar LS 900 software (V.2.1.1; Haag-Streit). If both eyes of the patient were operated on, only the first eye to be operated was included in the study.
Measurement technique
The device measures AL, ACD and LT using optical low-coherence reflectometry5 and calculates the K values using an integrated automated keratometer. In this paper, all K values refer to the average K ((K flat+K steep)/2) given by the device using a 1.3375 keratometric index of refraction. The Lenstar LS 900 is calibrated daily before obtaining the measurements. At each session, the patient is asked to fixate on a flashing red light, and as soon as the image of the eye on the computer monitor is in focus a measurement is obtained. All measurements are repeated five consecutive times. The unit eliminates non-usable measurements. The average value is then recorded.
The e-norms methodology
We used the e-norms method8–10 to determine the normative values of the AL in this cohort study. In our study, ‘normal’ values refer to standard AL values that represent the common and usual type.
A Microsoft Excel spreadsheet containing the data to be analysed was uploaded anonymously and securely to an SSL (secure sockets layer) encrypted web application developed by one of the authors (JFJ). The e-norms application10 is first performed on the AL measurements:
All measurements are sorted by ascending values: AL1, AL2, AL3, ……
The first-order differences are calculated: AL2–AL1, AL3–AL2, ….
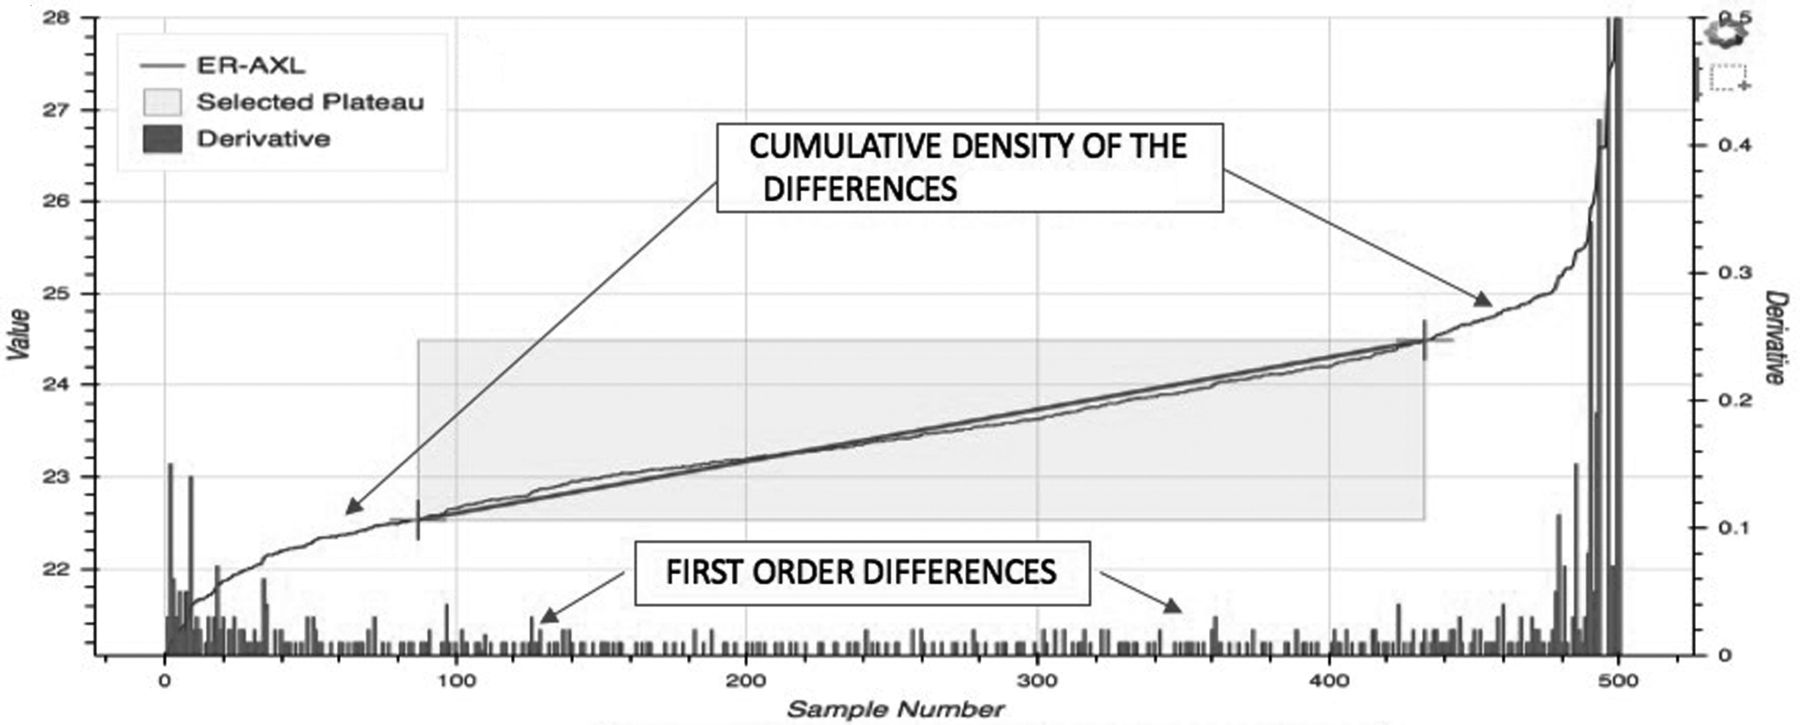
The software creates a display (figure 1) showing the first-order differences on the bottom of the display. The data points at the left and right extremes show higher first-order differences between them, whereas those at the centre display smaller first-order differences, with steady increments.
The software also displays a graph (figure 1) that represents the cumulative distribution of the variable by rank. The inverted S curve has a steep lower left, a middle ‘plateau’ and a steeper upper right.
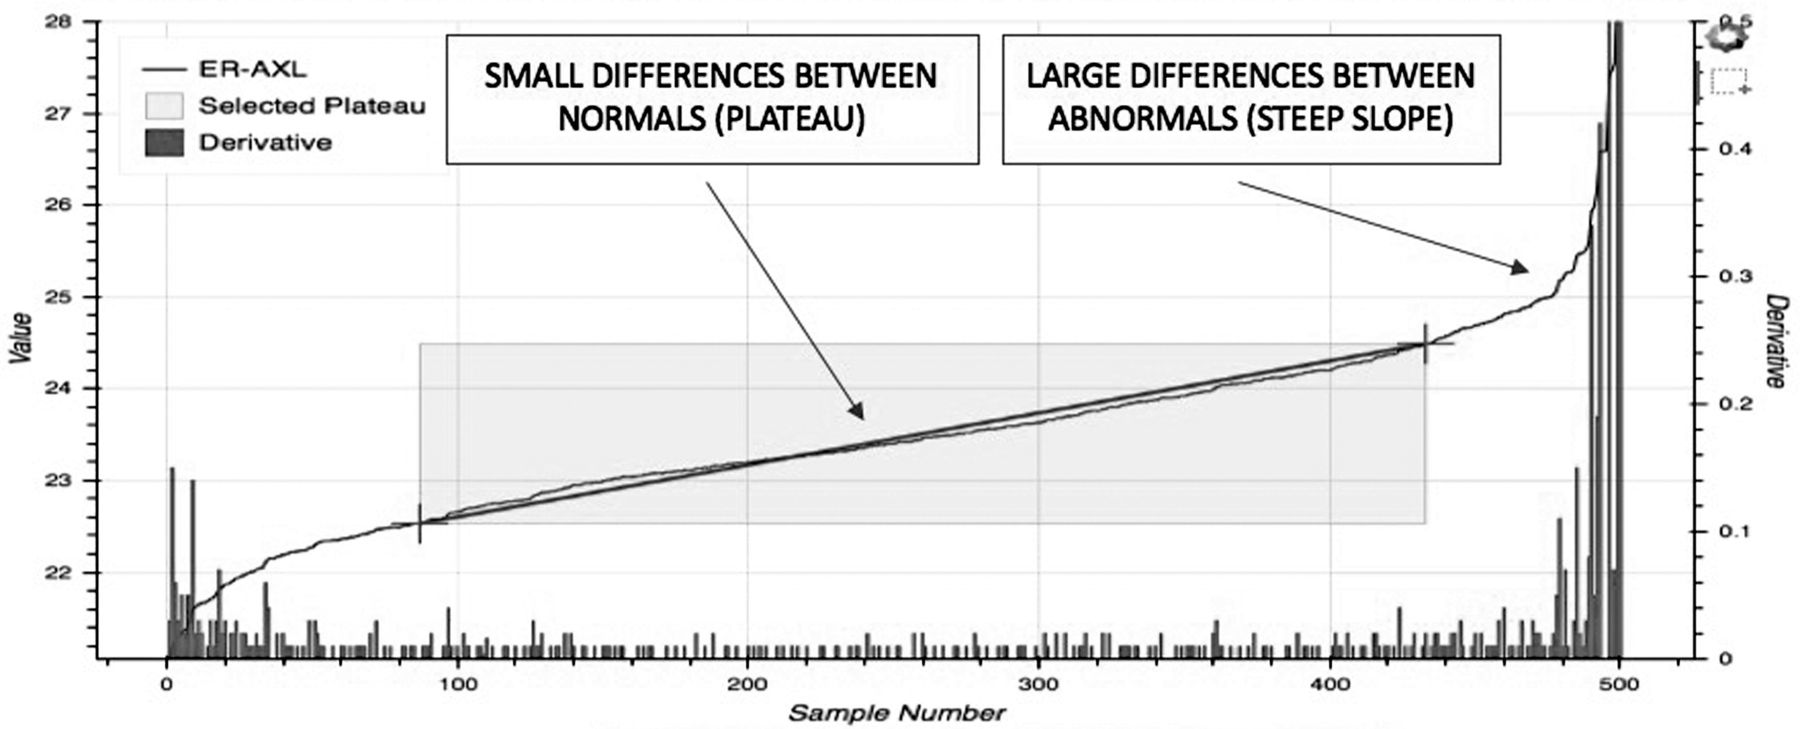
The inflection points are identified (figure 2); these represent the points where the steep lower left portion of the curve meets the middle plateau area on the left, and where the plateau portion of the curve changes into the steep upper portion of the curve. A straight fit line is drawn between the two points. This line represents the plateau of ‘e-norms’ (figure 2).
Note that the plateau represents that special section of the data set with the low steady increments (figure 3), indicating that when examining the value-to-value differences of ranked continuous measurements, the plateau population can be characterised with the slowest rate of increase. These represent the normal values of the data being analysed. The graph also shows that the values in the lower left (short eyes) and upper right (long eyes) of the curve display larger first-order differences, making the slope steeper on both sides.
The program evaluates the values within the plateau and calculates the mean of these values, SD, the minimal and maximal values, and the limits within ±2 SD of the mean.

The e-norms analysis of the axial length measurements, derived from enorms.com. The first-order differences are represented by the vertical lines at the bottom of the graph, and the cumulative distribution of the variable by rank is represented by the inverted S curve. e-norms, extrapolated norms.

The e-norms analysis of the axial length measurements, derived from enorms.com. The inflection points are identified, and the straight fit line connecting the two inflection points represents the plateau of ‘e-norms’. e-norms, extrapolated norms.

The e-norms analysis of the axial length measurements, derived from enorms.com. Note the small differences between the normal values within the ‘plateau’ revealing e-norms clustering, and the larger differences between the abnormal values represented by the steeper slope. e-norms, extrapolated norms.
The same analysis was conducted on the cases with an AL below the lower limits of the plateau to identify the medium-short eyes and the short eyes, and the cases exceeding the upper limits of the plateau to identify the medium-long eyes and the long eyes. The Ks, ACD and LT values were also evaluated.
Patient involvement
There was no patient participation in the study. Patients were not involved in the research project at any time, neither in the design of the study nor in the conduct of the study.
Results
The mean age of the 500 patients was 77.52±7.90 years (range 51–94 years). There was a fairly even distribution of men (49%) and women (51%) in the study group.
Table 1 shows the mean, SD and the limits of the e-norms analysis. Eyes with normal AL values (n=353) ranged from 22.50 to 24.50 mm, with a mean value of 23.50±0.50 mm. Sixty-five eyes were longer than 24.50 mm; an e-norms study on these 65 eyes further divided the group into medium-long eyes (n=40) with an AL ranging from 24.51 to 24.99 mm, and long eyes (n=25) with an AL of 25.00 mm and longer. Eighty-two eyes were shorter than 22.50 mm; an e-norms study on these 82 eyes further divided the group into medium-short eyes (n=52) with an AL ranging from 22.01 to 22.49 mm, and short eyes (n=30) with an AL of 22.00 mm or less.
Mean, SD and limits of the e-norm value
Normal values for the ACD (n=355) ranged from 2.50 to 3.50 mm (mean of 3.00±0.25 mm) with 82 eyes shallower than 2.50 mm and 63 eyes deeper than 3.50 mm.
Normal values for LT (n=343) ranged from 4.40 to 5.44 mm (mean of 4.92±0.26 mm) with 78 eyes thinner than 4.40 mm and 79 eyes thicker than 5.44 mm.
Normal values for the Ks (n=289) ranged from 42.50 to 44.82 dioptres (D) (mean of 43.66±0.58 mm) with 111 eyes flatter than 42.50 D and 100 eyes steeper than 44.82 D.
Table 2 compares the mean values from this study with the results of four other studies from the same practice where measurements were obtained with an immersion A-scan,4 optical low-coherence reflectometry,5 partial coherence interferometry6 and swept-source optical coherence tomography.7
Mean values as measured by different biometers
Table 3 compares the mean values in our cohort with e-norms (calculated from normal values) versus the conventional method (calculated from the entire data). The mean values and 95% CI are almost identical; however, the range of normal values (mean±2 SD) is much wider with the conventional method.
Calculated values with e-norms versus conventional method in our cohort
Discussion
The e-norms methodology allows the use of measurements taken from a database derived from a clinic’s own patient population to produce normative values for any parameter in this database. The e-norms method has been validated to date in a wide variety of neurophysiological applications.1–3 In a just completed work8 comparing the reliability of visual e-norms plateau identification by different observers, 20 raters drawn from a diverse pool of hospital workers were asked to identify the e-norms plateau in 393 upper and 284 lower extremity nerve conduction studies while blinded to the test they were analysing. There was no significant difference between their findings by an inter-rater analysis of variance without replication testing.
In this work, we have derived a reference range for the biometric measurements of patients scheduled for cataract surgery. A normal AL has arbitrarily been set in some studies as a measurement between 22.0 and 26.0 mm with short eyes measuring below 22.0 mm and long eyes measuring above 26.0 mm.11 12 In other studies, the normal AL values were arbitrarily set between 22.5 and 24.5 mm,13 between 22.5 and 25.5 mm,14 and between 23.5 and 26.0 mm.13 This lack of consistency affects the reported accuracy of IOL power formulas in the so-called short, normal and long eyes.15 The e-norms methodology established five categories of AL based on the measured value: short eyes (22.0 mm and less), medium-short (22.01–22.49 mm), average (22.50–24.50 mm), medium-long (24.51–24.99 mm) and long (25.00 mm and over).
Our study represents the first attempt to use the e-norms methodology in evaluating biometric data. To validate our findings, the mean values derived in our study were compared with other biometric mean values derived from conventional methods where the entire data are used to calculate the mean values. Our results compared favourably with four other studies from the same practice (table 2). The A-scan study4 included 750 eyes and showed comparable results with the ones reported this study. The three other studies5–7 were based on smaller number of cases and showed minor variations from the present study. The major advantage of the e-norms methodology is that it allowed us to calculate the mean values from typically normal eyes and not from the entire group.
The e-norms mean values in our cohort were also compared with the calculated means by a conventional method on the same series (table 3). The mean values and 95% CI are almost identical, further validating the e-norms methodology as a trusted method to calculate mean values. However, the conventional method yielded a much wider range of values, making it not suitable to calculate normal ranges.
An additional advantage of our method is the possibility of applying it successfully to smaller numbers within the cohort and subdividing certain groups. In our study, we applied the e-norms method on the longer eyes (n=65), further dividing them into medium-long with 40 eyes ranging from 24.51 to 24.99 mm and long with 25 eyes measuring 25.00 mm or longer. We then applied the e-norms method on the shorter eyes (n=82) and further divided them into medium-short with 52 eyes ranging from 22.01 to 22.49 mm and short with 30 eyes measuring 22.00 mm or shorter.
Many research studies can be expensive and time-consuming to complete. We believe that the e-norms methodology solves a problem that exists in any investigative research field where normative data that pertain to a subject cohort are needed. As a result, our method can be used on any cohort data; in our study, we elected to evaluate the biometric data of patients undergoing cataract surgery at our centre and establish five subgroups based on the AL differences. The method is fast and can be done using a local Excel spreadsheet or on the web using proper ethics permission.
In conclusion, we here described a new method to calculate normal biometric values quickly and easily. The speed and ease with which it can be accomplished are a major draw to use it in ophthalmology. In evaluating the biometric measurements in eyes undergoing cataract surgery, it allowed us to calculate the respective means, establish normative reference values and cluster patients into groups and subgroups based on AL differences.
Footnotes
Contributors JHS and JFJ participated in the concept and design of the study. JHS performed the measurements, collected the data and drafted the manuscript. JFJ is the author of the e-norms methodology. He analysed the data. JHS and JFJ interpreted the data and approved the manuscript.
Funding The authors have not declared a specific grant for this research from any funding agency in the public, commercial or not-for-profit sectors.
Competing interests None declared.
Patient and public involvement Patients and/or the public were not involved in the design, or conduct, or reporting, or dissemination plans of this research.
Patient consent for publication Not required.
Ethics approval The study was approved by the Milkie-Shammas Surgery Center Institutional Review Board (Lynwood, California). Data were collected in a manner consistent with the tenets of the Declaration of Helsinki.
Provenance and peer review Not commissioned; externally peer reviewed.