Article Text

Abstract
Objective This study aimed to determine which colour contrast sensitivity differences exist in early to advanced age-related macular degeneration (AMD) and examine the potential utility of the King-Devick Variable Color Contrast Sensitivity Chart in detecting AMD severity.
Methods and analysis A total of 85 participants (144 total eyes) were recruited from multiple clinical practices and enrolled in the study. The control group consisted of 57 healthy eyes. The non-exudative AMD (NE-AMD) group consisted of 45 eyes. The exudative AMD (E-AMD) group consisted of 42 eyes. In a single study visit, monocular best-corrected visual acuity (BCVA) at 40 cm with 100% black contrast was determined for each eye. Using the BCVA line, the number of letters correctly identified (out of 10) was recorded for various colour presentations (red, green, blue and yellow) and at decreasing contrast levels (100%, 75%, 50% and 25%).
Results Our results show worse visual performance under various colour contrast settings in E-AMD patients compared with healthy controls and NE-AMD. Colour contrast performance using blue and yellow differentiated more advanced stages of disease in E-AMD from earlier NE-AMD disease. Blue and black colour contrast performance more accurately identified the E-AMD group from healthy controls and the NE-AMD group.
Conclusion The findings of this study demonstrate that colour contrast, particularly with black, blue and yellow, is impaired in E-AMD suggesting the potential for colour contrast measures to serve as an adjunctive clinical tool in identifying subtle altered visual function as well as the potential for detecting disease severity.
- colour vision
- degeneration
- macula
- retina
This is an open access article distributed in accordance with the Creative Commons Attribution Non Commercial (CC BY-NC 4.0) license, which permits others to distribute, remix, adapt, build upon this work non-commercially, and license their derivative works on different terms, provided the original work is properly cited, appropriate credit is given, any changes made indicated, and the use is non-commercial. See: http://creativecommons.org/licenses/by-nc/4.0/.
Statistics from Altmetric.com
Key messages
What is already known about this subject?
Early detection and intervention in age-related macular degeneration (AMD) lead to superior visual outcomes. Colour contrast sensitivity differences exist in AMD.
What are the new findings?
Black, blue and yellow contrast settings are most affected in exudative AMD.
How might these results change the focus of research or clinical practice?
These colour contrast variations may be useful in earlier detection and better monitoring of AMD.
Introduction
Age-related macular degeneration (AMD) is the leading cause of significant and irreversible central vision loss in developed countries.1 The burden of vision loss due to progression of disease has a profound effect on quality of life and ability to function independently. As the global population ages, the prevalence of AMD is rapidly increasing. Worldwide, AMD prevalence estimates project approximately 200 million by 2020 and increasing to nearly 300 million by 2040.2 This considerable impending global burden of AMD has accelerated the development of new treatment and management paradigms.3 There have been significant advances in the clinical management of patients with AMD to slow progression, prevent blindness and in some cases even restore vision.3 However, although these revolutionary treatments exist, many patients still suffer irreversible vision loss due to poor detection of the early and subtle changes in visual function resulting in late presentation to their eye care providers. It is known that early intervention in exudative AMD can lead to superior outcomes, therefore the importance of exploring sensitive, convenient and inexpensive methods of detecting early disease severity cannot be underestimated in an effort to improve patients’ visual outcomes and quality of life.
The earliest changes in visual dysfunction, common in a variety of conditions impacting the central retina, involve the ability to discern low levels of contrast4 5 and distinguish colour.6 7 Contrast sensitivity has been shown to be a sensitive measure of visual function.8–10 In AMD, it has been established that contrast sensitivity function worsens with increasing drusen accumulation and progression of disease.11 Traditional methods of evaluating contrast sensitivity use research protocols for retroilluminated high and low contrast visual acuity charts. Similarly, impairment of colour vision is one of the earliest manifestations of retinal disease.12 13 In particular, AMD has been shown to lead to a larger loss of blue–yellow sensitivity over red–green sensitivity.12 13 Measuring subtle degenerative colour vision changes involves using complex tests such as the Farnsworth-Munsell 100 hue test.
Despite evidence supporting the usefulness of these contrast and colour vision screening tools in detecting and monitoring AMD severity, these assessments are time consuming and require specialised equipment and interpretation, making them difficult to implement in clinical practice. Previously studied in migraine headache,14 Parkinson’s disease15 and amyotrophic lateral sclerosis,16 the King-Devick Variable Color Contrast Sensitivity Chart (VCCSC) is an iOS platform application that is available on a portable mobile or tablet. Variable contrast levels as well as colour contrast presentations can be adjusted to allow simultaneous assessment of visual acuity, contrast sensitivity and colour vision. The application automatically sets the tablets to full brightness to ensure uniformity across repeated measures and was developed against the gold standard Early Treatment Diabetic Retinopathy Study (ETDRS) charts for contrast. Studies evaluating stability and comparison of tablet displays with traditional charts have shown positive results with the tablet testing platform.17 Tablet computers have shown less interdevice variability, higher contrast and better luminance uniformity than standard contrast sensitivity charts in both lights-on and lights-off environments.17 Overall, iPad tablets matched or marginally outperformed ETDRS charts in terms of photometric compliance with high contrast acuity standards.17 This study aimed to determine which colour contrast sensitivity differences exist in early to advanced AMD and examine the potential utility of the King-Devick VCCSC in detecting AMD severity.
Materials and methods
Patients were not directly involved in the design of this study. This investigation included patients recruited from two retina subspecialty clinical practices. Patients were enrolled based on specific inclusion and exclusion criteria. Inclusion criteria was as follows: (1) inclusive of both genders, (2) diagnosis of AMD and (3) signed informed consent form. Subjects were excluded if they had: (1) presence of macular pathology other than AMD, (2) visually significant cataracts and (3) any other ocular pathology besides AMD causing vision loss, other than corrected refractive error. AMD was classified according to the Clinical Classification of Age-related Macular Degeneration.18 Early AMD was characterised by small drusen (≥63–<125 µm) and no pigmentary abnormalities. The presence of large drusen or pigmentary abnormalities associated with at least medium drusen were considered to have intermediate AMD. Late AMD was described as having neovascular or geographic atrophy lesions. Diagnosis of AMD was confirmed by historical clinical diagnosis. Eyes with early or intermediate AMD were categorised into a non-exudative AMD (NE-AMD) group to represent patients with less severe disease. Eyes with late AMD were categorised as exudative AMD (E-AMD) to represent more severe disease with neovascularisation. Healthy age-matched control participants were recruited and enrolled as a comparison group. The inclusion criteria for control participants was: (1) no ocular pathology, other than corrected refractive error, (2) no visually significant cataracts and (3) signed informed consent form.
King-Devick VCCSC
The VCCSC (King-Devick Technologies, Inc, Oakbrook Terrace, Illinois, USA) is tablet-based software that allows for assessment of visual acuity, contrast sensitivity and colour vision in a mobile application (figure 1). Testing distance can be varied between clinically standardised testing distances of 40 cm, 2 m or 3 m. Letter size can be increased or decreased and is displayed in both Snellen and M units. Contrast can be varied from 1.25% to 100%, and there are preset contrast levels for 75%, 50%, 25%, 2.5% and 1.25% contrast levels. Randomised letters are displayed to eliminate memorisation and letter playback of randomised letter sequence allows for administrator testing or self-testing. Letter colour presentation is adjusted between red, green, blue and yellow. The VCCSC was used on an iPad Air for this study. The iPad application automatically sets the iPad to 100% brightness to ensure uniformity across repeated measures.
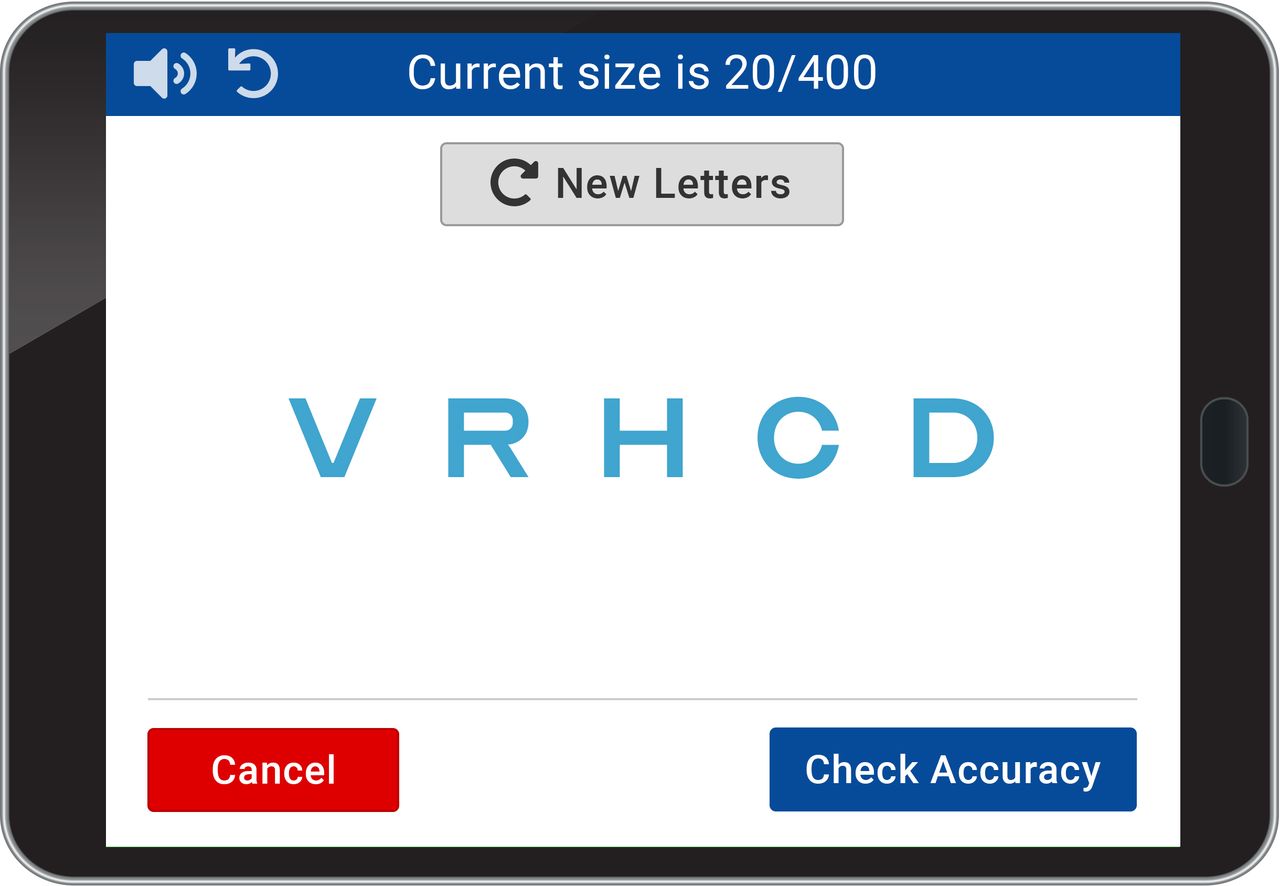
King-Devick Variable Color Contrast Sensitivity Chart.
Figure 1 is an image of the testing platform on an iPad screen.
In a single study visit, monocular best-corrected visual acuity (BCVA) at 40 cm with 100% black contrast was determined for each eye. Using the BCVA line, the number of letters correctly identified (out of 10) was recorded for various colour presentations (red, green, blue and yellow) and at decreasing contrast levels (75%, 50% and 25%).
Statistical analysis
Statistical analyses were performed using Stata V.14.0 software. Descriptive statistics were used to describe the cohort. One-way analyses of variance were used to compare differences in visual acuity performance by groups. Generalised estimating equation (GEE) models, accounting for age and adjusting for within-participant, intereye correlations were used to examine the capacity for wet versus dry group status to predict monocular measurements as continuous variables. P values <0.05 were considered statistically significant. Receiver operating characteristic (ROC) curves were analysed for each colour contrast acuity. The outcome measures for each test included letter size and number of letters correct for each ROC. The area under the ROC curves (AUR), a measure of test accuracy, were also calculated.
Results
A total of 85 participants (144 total eyes) were enrolled in the study. The control group consisted of 57 healthy eyes, mean age 61.7±9.1 years. The NE-AMD group consisted of 45 eyes, mean age 77.6±11.2 years. The E-AMD group consisted of 42 eyes, mean age 79.1±9.8 years. The results showed that the high contrast (100% black) visual acuity in the control group was significantly better than the NE-AMD group (logMAR (Logarithm of the Minimum Angle of Resolution) 0.30, 20/40 Snellen equivalent vs logMAR 0.65, 20/100 equivalent, p<0.001, table 1) and the E-AMD group (logMAR 0.30, 20/40 Snellen equivalent vs logMAR 1.00, 20/200 Snellen equivalent, p<0.001, table 1).
Visual function and colour contrast sensitivity performance by group
There were no significant differences between groups for the red and green colour and contrast presentations. There were however group differences in various black, blue and yellow contrast settings. Under black 75%, blue 100% and blue 75% contrast settings, the E-AMD group performed significantly worse than the NE-AMD group (black 75%: 8.3 vs 9.6 letters, p=0.007, table 1; blue 100%: 8.0 vs 9.3 letters, p=0.021, table 1; blue 75%: 7.9 vs 9.0 letters, p=0.046, table 1). For yellow coloured letters at 100% contrast, the E-AMD group showed significantly worse performance than the control group (5.5 vs 7.8 letters, p=0.003, table 1) and the NE-AMD group (5.5 vs 7.7 letters, p=0.01, table 1). Similar results were found at 75% contrast yellow letters where the E-AMD group had significantly worse scores than the control group (4.6 vs 6.8 letters, p=0.014, table 1). For blue letters at 50% contrast, the E-AMD group again scored lower than the control (6.3 vs 8.0, p=0.014, table 1) and NE-AMD (6.3 vs 8.5, p=0.002, table 1) groups. There were not significant differences between groups under the settings of black or yellow at 50% contrast, nor black, blue or yellow at 25% contrast.
Examining the blue and yellow colour setting further, the total blue letters correctly identified at each of the presented contrast levels (100%, 75%, 50% and 25%) were summed and compared between groups. The E-AMD group performed worse than the NE-AMD group in both blue and yellow total letters correctly identified, and this was a significant predictor of E-AMD status (4.7 letters worse out of 40 total blue letters, p=0.02, generalised estimating equation accounting for age and within-subject intereye correlation; 4.0 letters worse out of 40 total yellow letters, p=0.04, generalised estimating equation accounting for age and within-subject intereye correlation).
ROC curves and AUC were analysed for colour contrast acuities of 100% blue, and 75% blue and 75% black (figure 2), which were the best colour contrast acuities to differentiate the control and NE-AMD group versus E-AMD group. The 100% blue colour contrast acuity demonstrated an AUR of 0.814. The 75% blue colour contrast acuity demonstrated an AUR of 0.812. The 75% black colour contrast acuity demonstrated an AUR of 0.842.

ROC curves for blue and black colour contrast acuities. ROC, receiver operating characteristic.
Figure 2 displays ROC curves for 100% blue, 75% blue and 75% black colour contrast acuities. The 75% black colour contrast acuity demonstrated an overall accuracy of 84% (AUR of 0.842) for identifying individuals with E-AMD. The 100% blue colour contrast acuity demonstrated an overall accuracy of 81% (AUR=0.814), and the 75% blue colour contrast acuity showed an overall accuracy of 82% (AUR=0.817). Each of the colour contrast acuities demonstrated a good ability in distinguishing individuals with E-AMD in this cohort.
Discussion
As the ageing population grows and life expectancy extends, the incidence of AMD is growing exponentially. Despite advancing and novel treatments, the risk and burden of vision loss resulting from AMD remains. Providers often rely on patients with AMD to self-detect for the early and fine changes in visual function at home. These decreases in vision frequently go unnoticed until more noticeable and significant loss occurs subsequently resulting in late presentation for retinal evaluation and treatment. More effective means of measuring and monitoring the earliest changes in visual function through colour vision and contrast sensitivity have been shown to be effective in clinical trials; however, many of these research-based tools are not practical or economical for clinical implementation.9–13 The King-Devick VCCSC is a visual function tool that can be quickly administered with minimal training and with randomised letters and a playback feature, allowing for in-home self-testing. These qualities are important for a practicable screening tool that brings a measure of central cone-mediated function into the clinical setting and can serve as a predictor of vision loss risk. This study aimed to examine the utility of the King-Devick VCCSC in capturing AMD-related colour contrast acuity deficiencies.
Our results show worse visual performance under various colour contrast settings in E-AMD patients compared with healthy controls and NE-AMD. Colour contrast performance using blue and yellow differentiated more advanced stages of disease in E-AMD from earlier NE-AMD disease. Colour contrast performance with 100% blue, 75% blue, and 75% black most accurately differentiated individuals with E-AMD. The findings of this study demonstrate that colour contrast is significantly altered in E-AMD suggesting the potential for colour contrast measures to serve as an adjunctive clinical tool in identifying subtle altered visual function as well as the potential for detecting disease severity.
The results of the present study are consistent with previous findings documenting impaired short wavelength cone function and blue–yellow colour deficits in AMD patients, while red–green colour vision function remained intact.10 19 20 Other studies have shown a lack of significant differences for outcomes measured with traditional black contrast levels between study groups.11 This study revealed varying contrast of black, blue and yellow may provide more sensitive measures of afferent visual function. The 75% black colour contrast acuity demonstrated an AUR of 0.842. Therefore, the test had an overall accuracy of identifying individuals with E-AMD of 84%. The 100% blue colour contrast acuity demonstrated an overall accuracy of 81% (AUR=0.814), and the 75% blue colour contrast acuity showed an overall accuracy of 82% (AUR=0.817). Each of these colour contrast acuity tests demonstrated good accuracy for identifying E-AMD in this cohort.
Limitations of this pilot study include sample bias; however, our study recruited from two separate clinics to minimise this bias. Recruited study groups had large age differences; however, similar results in blue and yellow colour contrast between groups remained following linear regression models and analysis controlling for age. Additionally, the data represent only cross-sectional data. Future investigation should consider a prospective design to further examine colour contrast and contrast sensitivity changes over the disease course of AMD. Lastly, given that the results of this study support the use of the King-Devick VCCSC in discriminating between non-exudative and exudative disease, future studies should also consider the inclusion of colour contrast outcome measures for AMD therapeutic intervention.
Conclusion
Monitoring functional vision in AMD in a clinical setting requires a combination of tests that are efficient and easy to perform. Colour contrast testing can be easily implemented to allow clinicians to include cone-contrast evaluation in a clinical setting, and using a tablet-based testing method allows for standardisation of background illuminance and testing conditions.
The findings of this study demonstrate that colour contrast acuity, particularly in black, blue and yellow colour variations is impaired in E-AMD suggesting the potential for colour contrast acuity testing to serve as an adjunctive clinical tool in identifying subtle altered visual function as well as the potential for detecting disease severity and response to therapeutic intervention.
Acknowledgments
We would like to acknowledge the research grant funding support provided by the Illinois Society for the Prevention of Blindness.
References
Footnotes
Contributors Study conception and design: ASH, LVM and DL. Data acquisition: SI, ASH, LVM, DJT and DL. Data analysis and interpretation: SI, ASH, LVM, DL and SAS. Writing, editing and approving the manuscript: SI, ASH, LVM, DL and SAS. Responsible for the overall content as guarantor: SI, LVM, DL and SAS.
Funding The authors have not declared a specific grant for this research from any funding agency in the public, commercial or not-for-profit sectors.
Disclaimer DL was previously employed by King-Devick Technologies, Inc as the Chief Scientific Officer.
Competing interests None declared.
Patient consent for publication Not required.
Provenance and peer review Not commissioned; externally peer reviewed.
Data availability statement Data are available upon request.