Article Text

Abstract
Background/aims To determine the performance of combinations of structural and functional screening tests in detecting sight-threatening eye disease in a cohort of elderly subjects recruited from primary care.
Methods 505 subjects aged ≥60 years underwent frequency doubling technology (FDT) perimetry, iVue optical coherence tomography (iWellness and peripapillary retinal nerve fibre layer (RNFL) scans) and intraocular pressure with the Ocular Response Analyzer, all performed by an ophthalmic technician. The reference standard was a full ophthalmic examination by an experienced clinician who was masked to the index test results. Subjects were classified as presence or absence of sight-threatening eye disease (clinically significant cataract, primary open-angle glaucoma, intermediate or advanced age-related macular degeneration and significant diabetic retinopathy). Univariate and multivariate logistic regression analyses were used to determine the association between abnormal screening test results and the presence of sight-threatening eye disease.
Results 171 subjects (33.8%) had one or more sight-threatening eye diseases. The multivariate analysis found significant associations with any of the target conditions for visual acuity of <6/12, an abnormal FDT and peripapillary RNFL thickness outside the 99% normal limit. The sensitivity of this optimised screening panel was 61.3% (95% CI 53.5 to 68.7), with a specificity of 78.8% (95% CI 74.0 to 83.1), a positive predictive value of 59.5% (95% CI 53.7 to 65.2) and an overall diagnostic accuracy of 72.9% (95% CI 68.8 to 76.8).
Conclusions A subset of screening tests may provide an accurate and efficient means of population screening for significant eye disease in the elderly. This study provides useful preliminary data to inform the development of further larger, multicentre screening studies to validate this screening panel.
- screening
- optical coherence tomography, FDT perimetry
- diagnostic accuracy
This is an open access article distributed in accordance with the Creative Commons Attribution Non Commercial (CC BY-NC 4.0) license, which permits others to distribute, remix, adapt, build upon this work non-commercially, and license their derivative works on different terms, provided the original work is properly cited, appropriate credit is given, any changes made indicated, and the use is non-commercial. See: http://creativecommons.org/licenses/by-nc/4.0/.
Statistics from Altmetric.com
Key messages
What is already known about this subject?
Previous studies have found that no single test has sufficient predictive power to detect sight-threatening eye disease. Consequently, population screening for single sight-threatening disorders has not been shown to be cost effective.
What are the new findings?
This study found that a subset of screening tests that evaluate ocular structure and function had good discriminatory power for detecting sight-threatening eye disease in a cohort of elderly participants recruited from primary care.
How might these results change the focus of research or clinical practice?
The results provide useful data to inform the development of larger, multicentre population studies to evaluate the effectiveness and cost-effectiveness of screening for eye disease in the elderly.
Introduction
Population ageing is leading to substantial increases in visual impairment.1 Sight loss from cataract, age-related macular degeneration (AMD), diabetic retinopathy and uncorrected refractive error affects approximately two million of the UK population.1 The burden of sight loss disproportionally affects the elderly,2 with one in five people aged 75 years or over, and one in two people aged 90 years and over living with sight loss.3 Poor access to routine NHS sight testing in ‘at-risk’ populations, coupled with the absence of symptoms in the early stages of many of these diseases, can lead to delayed or late presentation.4 5 Given that a significant proportion of sight loss can be prevented through early detection and timely therapeutic interventions, it is likely that investment in prevention and screening for sight-threatening eye disease would lead to improved socioeconomic outcomes.6
Previous studies have examined the predictive power of individual screening tests to detect eye disease in both clinic-based and general populations and have found that no single test has sufficient predictive power to detect sight-threatening eye disease.7–10 By contrast, the performance of combining screening tests has shown greater promise. For example, Kopplin and Mansberger evaluated a test battery performed by ophthalmic technicians for the detection of visually significant eye disease in a population of American Indian and Alaskan Native participants.11 The authors identified that visual acuity worse than 6/12 (20/40), abnormal or poor-quality non-mydriatic photography, abnormal frequency doubling technology (FDT) perimetry, and abnormal or poor-quality confocal scanning laser ophthalmoscopy had the greatest predictive value.
We have previously demonstrated that combining structural and visual-function tests improves case detection of primary open-angle glaucoma (POAG) in a representative population of elderly subjects in the community.12 The aim of the current study was to extend this analysis to determine the performance of screening test combinations in detecting sight-threatening eye disease in the same population.
Methods
Study population
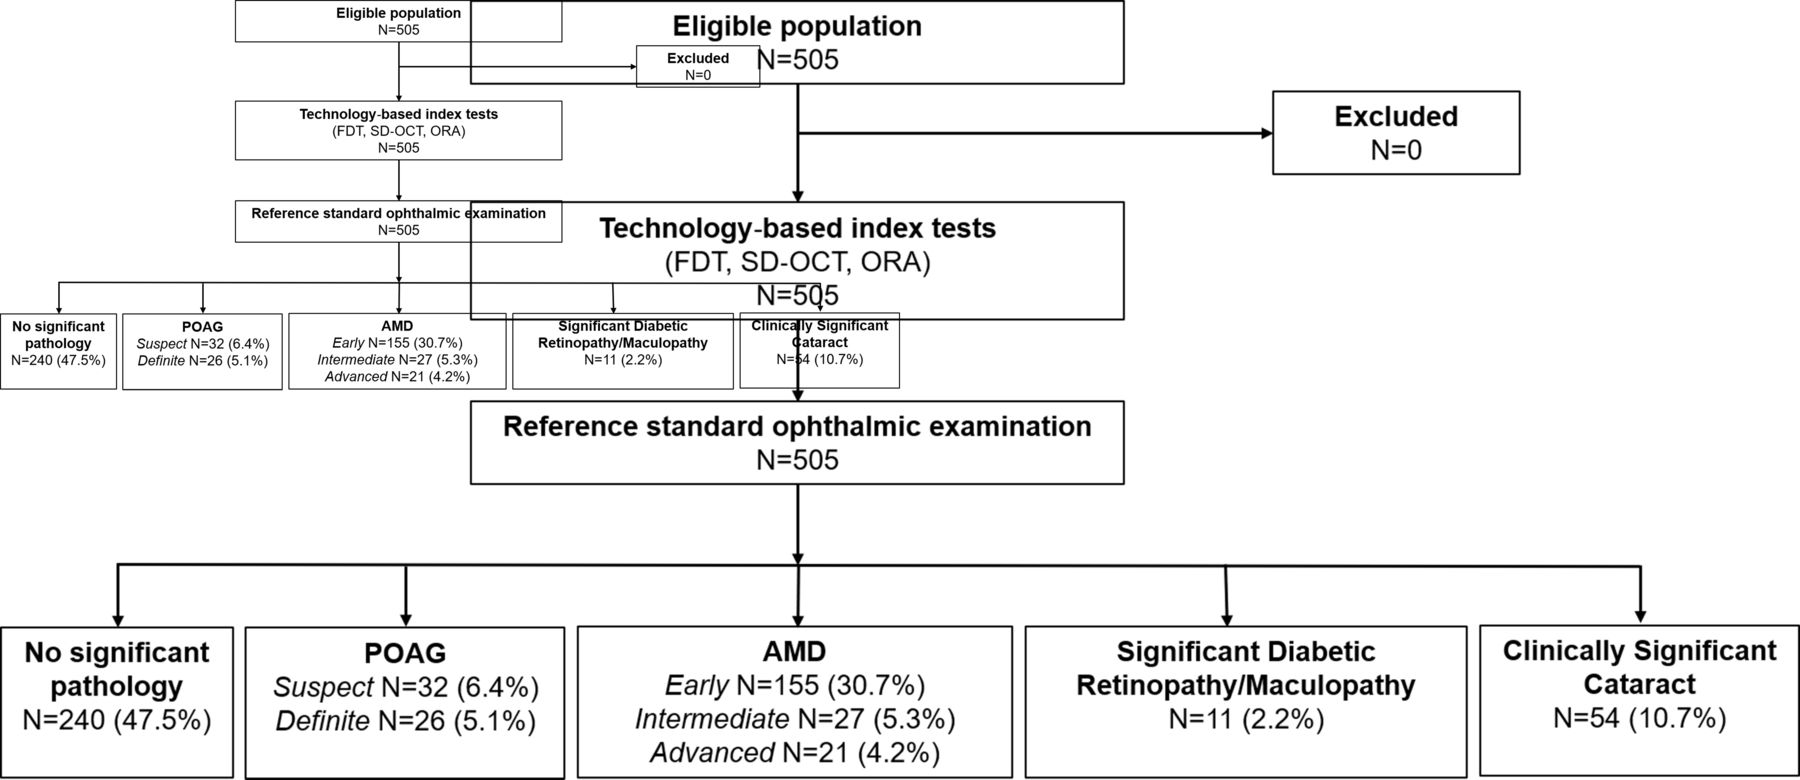
This prospective diagnostic accuracy study was conducted in an urban community eye clinic in London, UK, between September 2012 and September 2013. Men and women aged ≥60 years were invited to participate via a written invitation sent to community groups and local optometry practices. There were no exclusion criteria, and participants with prediagnosed ocular disease were included. Participants underwent a series of technology-based index tests followed by a reference standard ophthalmic examination (detailed further), conducted on the same day, to establish ocular health status. Figure 1 shows the study flow diagram.

Study flow diagram. The number of eye conditions exceeds the number of participants due to ocular comorbidity. AMD, age-related macular degeneration; FDT, frequency doubling technology; ORA, Ocular Response Analyzer; POAG, primary open-angle glaucoma; SD-OCT, spectral domain optical coherence tomography.
Index tests
The technology-based assessment comprised the measurement of intraocular pressure (IOP) using the Ocular Response Analyzer (ORA; Reichert Ophthalmic Instruments, Depew, NY, USA), assessment of visual fields with first-generation FDT perimetry (FDT; Carl Zeiss Meditec, Dublin, CA, USA) in C-20–5 suprathreshold mode and measurement of structural parameters of the macula and optic nerve head by spectral domain optical coherence tomography (SD-OCT) (iVue SD-OCT; Optovue, Fremont, CA, USA). Two optical coherence tomography (OCT) scans were performed: the proprietary iWellness protocol, which reports full retinal thickness and ganglion cell complex (GCC) thickness with normative comparisons, and a peripapillary retinal nerve fibre layer (RNFL) scan. An experienced ophthalmic technician performed all index tests with no prior knowledge of the subjects’ ocular status or findings from the reference standard ophthalmic examination. Thresholds of abnormality for the index tests were prespecified and were based on commonly used cut-offs reported in the literature or manufacturers’ suggested thresholds, based on comparisons with the instruments’ internal normative database. For the FDT, an abnormal result was defined using two thresholds: ≥1 location missed at either the p<5% or the p<1% significance level. The test was repeated once if one or more locations were missed or if the result was unreliable. For the SD-OCT, the defined cut-off for abnormality was any parameter falling outside the 99% normal limit based on the manufacturer’s integrated normal database; IOP>21 mm Hg was used as the threshold for the ORA.
Reference standard ophthalmic examination
All participants underwent a standard ophthalmological examination conducted by an experienced clinician who was trained and validated in glaucoma according to standard UK practice and also completed grader accreditation in diabetic retinopathy and AMD at the Reading Centre, Moorfield’s Eye Hospital, London, UK. The reference standard examination was conducted on the same day as the index tests, and the clinician was masked to the index test results. The reference examination consisted of LogMAR best-corrected visual acuities, full anterior segment assessment by slit-lamp biomicroscopy, assessment of limbal anterior chamber depth (with potentially occludable angles examined using gonioscopy), measurement of IOP using the Goldmann applanation tonometer, posterior segment examination through dilated pupils using indirect ophthalmoscopy and threshold visual field testing with a Humphrey field analyzer using Swedish Interactive Thresholding Algorithm (SITA) standard 24–2 pattern. The diagnostic criteria classifying the most commonly identified eye diseases are given in table 1.
Diagnostic criteria used for classifying the most prevalent eye diseasesn
Sample size calculation
The sample size was originally determined based on an anticipated sensitivity of 0.75 to detect POAG13 with a minimal acceptable precision of ±0.25 with 0.95 probability. This would require approximately 50 cases, and based on an anticipated prevalence of POAG in an elderly population of 8%–10%,14 it was therefore estimated that at least 500 participants would be needed. For this secondary analysis, we prospectively determined that a similar number of cases of intermediate and advanced AMDs would be required, based on a disease prevalence of 8% in the target population,14 an anticipated index test sensitivity of 0.75 and an equivalent level of precision.11
Statistical analysis
Summary statistics were tabulated and standard measurements of diagnostic accuracy (sensitivity, specificity, and positive and negative predictive values) were calculated to determine the ability of each index test to detect sight-threatening eye disease. We defined sight-threatening eye disease as a clinically significant cataract, definite or suspect POAG, intermediate or advanced AMD and significant diabetic retinopathy (proliferative or preproliferative) or diabetic maculopathy.
The unit of analysis was the individual participant and a comparison was made between the most abnormal index test from either eye and the overall reference standard classification. Unreliable results from the FDT and data from repeatedly poor-quality ORA and SD-OCT acquisitions were removed from the analysis.
Binomial logistic regression was used to identify the index tests with significant univariate associations (p<0.05) with individual eye diseases. Those with significant univariate associations were included as potential covariates in a multivariate model using stepwise logistic regression. A significance level of p<0.05 was set for entering and retaining the covariate in the final model. The impact of adding best-corrected visual acuity of <6/12 to the model was also evaluated post hoc, and the diagnostic performance of the final multivariate subset of screening tests was calculated.
All statistical analyses were performed using SPSS software V.21.0 (www.ibm.com/SPSS_Statistics) and MedCalc V.18.0 (www.medcalc.org).
Patient and public involvement
There was no patient involvement in the development of the research question or the study design; however, patient networks were used in study recruitment.
Results
The study recruited a total of 505 subjects with a median age of 68 years (range 60–92). Fifty-nine per cent were female. Self-reported ethnicities were white (88%), South Asian (8%), black (2%), Chinese (1%) and ‘other’ (1%). Approximately 12% of the population had diabetes and 16% reported a family history of glaucoma.
The eye diseases most commonly identified by the reference standard ophthalmic examination were AMD (n=203, 40%), definitive or suspect POAG (n=58, 12%) and clinically significant cataract (n=54, 11%). Based on the criteria from Hodapp et al,15 the 26 definitive cases of POAG were classified as follows: early n=11 (42%), moderate n=6 (23%) and advanced n=9 (35%).
Table 2 provides a summary of the prevalence of eye disease in our sample based on the previously described diagnostic criteria.
Eye disease identified by the reference standard examination
On repeat examination, 97% of the index tests were reliable and of sufficient quality for analysis. A total of 195 (38.6%) participants passed all three screening tests; 186 (36.8%) participants had one abnormal test result; 112 (22.2%) had two abnormal results; and 12 (2.4%) showed an abnormality on all three tests.
The test most commonly failed was the FDT, with 193 (38%) participants missing ≥1 location(s) at the 5% level.
Logistic regression analysis
Tables 3 and 4 show the results of the univariate and multivariate logistic regression analyses for the association between abnormal screening test results and the presence of sight-threatening eye disease. An abnormal FDT (based on one or more points missed at the p<5% or p<1% levels) was significantly associated with all target diseases. Visual acuity of <6/12 similarly showed univariate associations with all diseases, with the exception of significant diabetic retinopathy/maculopathy.
Univariate association testing of abnormal screening results with significant ocular disease using logistic regression
Multivariate stepwise logistic regression analysis of abnormal screening results with significant ocular disease
An abnormal SD-OCT (one or more parameters outside the 99% normal limit) was associated with POAG, AMD and diabetic retinopathy. The strongest association was observed between peripapillary RNFL thickness and POAG. An IOP of >21 mm Hg (determined by the ORA) was uncommon (14%) and showed no significant association with any of the target conditions. The sensitivity and specificity of the individual tests can be found in the online supplementary table.
Supplemental material
The tests that were significant (p<0.05) in the univariate analysis were used as candidate covariates in a stepwise multivariate logistic regression model (table 4). In the multivariate analysis, visual acuity of <6/12 was significantly associated with a clinically significant cataract and AMD. An abnormal FDT at either the 5% or 1% level was associated with cataract and POAG, and an abnormal SD-OCT was predictive of POAG, AMD and diabetic retinopathy. The multivariate analysis identified that visual acuity of <6/12, one or more locations missed at the 5% level on the FDT and the peripapillary RNFL thickness outside the 99% normal limit were predictive of sight-threatening eye diseases. The diagnostic performance of this optimised screening panel for any of the target conditions is summarised in table 5. The sensitivity and specificity of the panel were 61.3% and 78.8%, respectively, with a positive predictive value of 59.5% and an overall diagnostic accuracy of 72.9%. Of the subjects with a potentially sight-threatening eye disease that would not have been detected using the optimised subset of tests, the majority were classified as either having a clinically significant cataract, suspect glaucoma or intermediate AMD. Only five participants with the most severe disease, definitive glaucoma (n=1), significant diabetic retinopathy (n=1) or advanced AMD (n=3), would have been missed.
Diagnostic performance of the optimised panel of screening tests (SD-OCT, FDT and measurement of visual acuity) in identifying sight-threatening eye disease
Discussion
The current study evaluated the predictive value of a panel of standard screening tests in identifying sight-threatening eye disease in an elderly, predominantly white population. We established that reduced visual acuity, abnormal FDT and peripapillary RNFL thickness outside the 99% normal limit were predictive of any sight-threatening eye disease. These tests showed high positive and negative predictive values for the detection of POAG, AMD, significant diabetic retinopathy and clinically significant cataract, suggesting that a subset of screening tests could provide a basis for ophthalmic screening in the community. A trained technician could easily conduct these tests, and screen-positive individuals could then be referred for a full ophthalmic assessment.
Kopplin and Mansberger11 have similarly shown that ophthalmic technicians could effectively identify visually significant eye disease in a cohort of American Indian and Alaskan Native participants using a similar battery of screening tests. The test combination used in this study had a sensitivity of 94% and a specificity of 32%. By contrast, the sensitivity and specificity of the screening panel used in the current study were 61% and 79%, respectively, with similar positive and negative predictive values (60% and 80%). Although the screening panel failed to identify approximately a third of subjects with cataract, suspect glaucoma and intermediate AMD, over 90% of those with the most severe disease were detected.
An earlier UK study investigated the cost-effectiveness of a similar ‘technician screening’ model for POAG in a population aged >40 years, compared with the current opportunistic case finding strategy.16 The authors concluded that screening was unlikely to be cost-effective, based on a comparison of the incremental cost-effectiveness ratio to a standard threshold of a societal willingness to pay of £30 000 per quality-adjusted life year. However, a sensitivity analysis showed that the cost-effectiveness of screening for POAG was highly dependent on disease prevalence. For example, at a prevalence of 5%, the technician screening model became more cost-effective than current practice. The cost-effectiveness of population screening for eye disease could be increased by either screening a group with a higher prevalence of a target condition or extending the screening programme to encompass several diseases. In the current study, the prevalence of sight-threatening eye disease in our elderly participants was in the region of 30%, and therefore, technician screening for significant eye disease in this population is highly likely to be cost-effective. Furthermore, our model could provide a screening template for the detection of significant eye disease in underserved populations. Although at a higher risk of eye disease, people from minority ethnic groups and those from lower socioeconomic groups are less likely to access eye care services and consequently are at a greater risk of late presentation with associated poorer outcomes.17–20
The index tests used were designed to detect structural and/or functional defects. The first-generation FDT perimeter in the C-20–5 suprathreshold mode was used to evaluate visual function and determines contrast thresholds at 17 locations within the central 20 degrees of the visual field. Stimuli are initially presented at a contrast level that should be detected by 95% of age-matched normal subjects. This test was originally developed for glaucoma screening; however, the FDT has also been shown to be effective for the detection other eye diseases.21 An abnormal FDT result showed a univariate association with all target conditions and a threshold of ≥1 point missed at the 5% level was retained in the final multivariate model. Similarly, an abnormality in one or more SD-OCT parameters showed a univariate association with POAG, AMD and diabetic retinopathy. The OCT parameters selected for the analysis and the associated pass/fail criteria (value outside the 99% CI based on the iVue SD-OCT normative database) were established a priori. Thinning of the peripapillary RNFL showed the strongest association, and this parameter was retained in the final model. Predictably, the association was strongest for POAG, but a statistically significant association was also found for AMD. While the OCT is widely used as a diagnostic tool for neovascular AMD, where it is particularly effective in detecting subretinal fluid,22 more recently, morphological changes in the inner retina have been documented in eyes with AMD. Changes in the thickness of the GCC and RNFL have been reported in both atrophic and neovascular forms of AMD.23 24
In the UK and internationally, there has been a shift towards integrating advanced imaging technologies, particularly OCT, into routine case finding.25–28 Global interest in the value of SD-OCT for detecting retinal disease has recently been fuelled further by the application of artificial intelligence (AI) based on deep learning algorithms.29 30 Applying AI to a set of real-world OCT scans, taken from patients referred into a large tertiary referral centre, showed a diagnostic performance that was comparable and, in some cases, better than clinical experts for a range of sight-threatening retinal diseases.
Strengths and limitations
To our knowledge, this is the first UK study that has evaluated the performance of a combination of screening tests to detect clinically significant eye diseases in a primary care setting. The study has a number of strengths. The design, analysis and reporting complied with the principles of the Standards for Reporting of Diagnostic Accuracy statement.31 To reduce spectrum bias, the target population included consecutive subjects who met the inclusion criteria, and there were no exclusions. Although it is possible that higher numbers of those with a personal or family history of eye disease were more likely to agree to participate in the study, the prevalence of sight-threatening eye disease in our population (30%) was similar to a London-based cross-sectional study that used random sampling.14 Therefore, we believe that the study sample is likely to be broadly representative of the local population. The reference standard used to classify the participants’ ocular status corresponded to that used in a typical hospital eye clinic and was based on the results of a standard ophthalmic examination by a validated clinician. All index tests and the reference standard examination were undertaken on the same day, and the clinician performing the reference examination and the ophthalmic technician undertaking the index tests were masked to the results.
The study also has some limitations. Although a large sample of the population was examined, the prevalence of the individual target conditions was low, and consequently, the reported measures of index test performance were associated with wide confidence intervals. Furthermore, since the identified panel of screening tests was not tested on an independent validation sample, it is possible that the predicative value of these tests may be lower in other populations. Approximately 90% of our study population was of white European origin, and therefore, our findings may not be generalisable to other ethnic groups.
The current study did not include a formal cost-effectiveness analysis. One of the tenets of Wilson and Jungner’s widely implemented ‘Principles and Practice of Screening for Disease’32 states that ‘the cost of case-finding (including diagnosis and treatment of patients diagnosed) should be economically balanced in relation to possible expenditure on medical care as a whole.’ An economic evaluation of any proposed screening programme is therefore essential to assess the full costs of implementing, operating and sustaining the programme. Recent studies in ophthalmology have recognised the efficiencies gained in screening for more than one eye condition. For example, AMD screening carried out simultaneously with digital screening for diabetic retinopathy is cost-effective in the context of a public healthcare system in Hong Kong.33
Conclusions
Our study has demonstrated the feasibility of using a panel of standard screening tests performed by an ophthalmic technician to detect sight-threatening eye disease in a representative sample of the elderly population. The results provide useful data to inform the development of larger, multicentre population studies to evaluate the effectiveness and cost-effectiveness of screening for eye disease in the elderly.
Acknowledgments
The authors thank Optovue for the loan of the iVue optical coherence tomographer.
References
Footnotes
Contributors BRF: study design and conception, collection of data, data analysis and interpretation, writing of the manuscript and approval; PD: study design and conception, collection of data, data analysis and approval; AJ, IC and TP: data analysis and interpretation and approval; DFE: study design and conception, data analysis and interpretation, and approval; JGL: study design and conception, data analysis and interpretation, writing of the manuscript and approval.
Funding The study was funded by the College of Optometrists UK.
Competing interests None declared.
Patient consent for publication Not required.
Ethics approval The study was approved by the research and ethical committee of the Division of Optometry and Visual Science, City, University of London (reference number 189A.4b) and adhered to the tenets of the Declaration of Helsinki. Informed written consent was obtained prior to participation.
Provenance and peer review Not commissioned; externally peer reviewed.
Data availability statement All data relevant to the study are included in the article or uploaded as supplementary information.