Article Text

Abstract
Objective To elucidate the difference between choroidal thickness (CT) in primary open-angle glaucoma (POAG) and normal subjects and to compare the CT measured using spectral domain optical coherence tomography (SD-OCT) and swept source optical coherence tomography (SS-OCT).
Methods and analysis This cross-sectional observational study included 25 eyes of 17 POAG subjects (cases) and 31 eyes of 20 normal subjects (controls). All the patients underwent complete ophthalmologic examination, enhanced depth imaging, SD-OCT and SS-OCT. In both controls and cases, the CT was measured in seven predetermined points in macular and peripapillary area and were compared.
Results Choroid was significantly thicker on SS-OCT compared with SD-OCT in peripapillary and macular area in both cases and controls, except for inferior peripapillary in controls. The CT was not different from glaucoma and controls in peripapillary or macular area on SD-OCT (p>0.05), however, the CT was significantly thicker in glaucoma compared with controls in peripapillary area on SS-OCT (p<0.05) except inferior peripapillary (p=0.13). There was good intraobserver (±20 µm) and interobserver (±55 µm and ±45 µm) agreement on both SD-OCT and SS-OCT respectively.
On SD-OCT, choroid was thinnest at the temporal peripapillary and thickest at subfoveal location in controls. In POAG, choroid was thinnest at inferior peripapillary region and thickest (500 µm) nasal to the fovea. On SS-OCT, choroid was thinnest at inferior peripapillary and thickest at the temporal peripapillary area in both cases and controls.
Conclusion CT measurements on SS-OCT were higher than the SD-OCT measurements possibly due to better delineation of the sclerochoroidal junction on SS-OCT. CT was significantly thicker in glaucoma subjects compared with controls in peripapillary area on SS-OCT but not in macular area.
- choroidal thickness in POAG
- SS-OCT
- SD-OCT
- glaucoma
This is an open access article distributed in accordance with the Creative Commons Attribution Non Commercial (CC BY-NC 4.0) license, which permits others to distribute, remix, adapt, build upon this work non-commercially, and license their derivative works on different terms, provided the original work is properly cited, appropriate credit is given, any changes made indicated, and the use is non-commercial. See: http://creativecommons.org/licenses/by-nc/4.0/.
Statistics from Altmetric.com
Key messages
What is already known about this subject?
Choroid is a highly vascular tissue, hence changes in choroidal vasculature may lead to significant change in choroidal thickness (CT).
Previous studies that evaluated the correlation between different types of glaucoma and CT using spectral domain optical coherence tomography (SD-OCT) and swept source optical coherence tomography (SS-OCT) were inconclusive with conflicting results.
Very few studies have evaluated both macular and peripapillary CT in eyes with primary open-angle glaucoma (POAG) and compared with normal eyes.
What are the new findings?
In our study, we found SS-OCT is possibly superior to SD-OCT in measuring CT due to better delineation of the sclerochoroidal junction in both healthy subjects and POAG eyes.
Peripapillary CT was significantly in POAG eyes as measured on SS-OCT. Subfoveal CT did not show any significant difference in eyes with POAG in comparison to normal subjects on both SD-OCT and SS-OCT.
Increase in CT in POAG eyes in our study could be attributed to decrease in intraocular pressure (IOP) with medications and use of prostaglandin analogues in majority of the eyes.
Key messages
How might these results change the focus of research or clinical practice?
Measuring the CT before and after initiation of medical treatment with individual type of glaucoma medications at various IOP ranges in POAG subjects may help understand the influence of medication and IOP on CT.
Change in CT can be used as a biomarker to evaluate the responsiveness to medical treatment.
Peripapillary and macular CT in the quadrant or area corresponding to the visual field loss can be correlated to understand the localised changes in CT with disease severity.
Introduction
Primary open-angle glaucoma (POAG) is a subtype of glaucoma in which anterior chamber angle is open with elevated intraocular pressure (IOP) with no other associated ocular cause.1 The treatment options targeting the IOP and vascular factors may be useful in treating glaucoma.
As optic nerve head is mainly supplied by choroidal vasculature, the role of choroid in the development or progression of glaucoma has been extensively studied using fundus fluorescein angiography (with reduced or delayed choroidal fluorescence in glaucomatous optic neuropathy).2 Other studies using laser Doppler flowmetry found decreased optic nerve head blood flow which correlated with morphological and functional glaucomatous progression.3
Using newer technology, the optical coherence tomography angiography, reduced optic disc perfusion was noted in eyes with early glaucomatous damage.4 Choroid is a highly vascular tissue, hence changes in choroidal vasculature would lead to significant change in choroidal thickness (CT).5 Various studies have evaluated the correlation between different types of glaucoma and CT using spectral domain optical coherence tomography (SD-OCT) and swept source optical coherence tomography (SS-OCT).
A meta-analysis by Zhang et al, including studies that compared either macular CT or peripapillary CT (PPCT) or both using SD-OCT and SS-OCT in glaucomas and normals, indicated no association between the glaucomatous optic neuropathy and CT.6 However, another meta-analysis by Lin et al showed significantly decreased PPCT in open-angle glaucoma eyes compared with healthy individuals on SD-OCT.7 A study by Cennamo etal using SD scanning laser ophthalmoscopy/OCT found significantly thicker macular CT in POAG eyes.8 A study by Lyu et al reported least CT in the inferior peripapillary area and nasally in the macular area with a significant relationship between CT and visual field sensitivity in glaucomatous eyes.9 A study by Banitt concluded that CT did not change in macular area but PPCT was found to be thinner in glaucomatous eyes compared with normals.10
The previous studies were inconclusive with conflicting results. Very few studies have looked at both macular CT and PPCT in eyes with POAG using SD-OCT and SS-OCT and compared with normal eyes.
Methods
Study design and participants
In a cross-sectional observational study, we included 25 eyes of 17 POAG subjects (cases) and 31 eyes of 20 normal subjects (controls) visiting the outpatient department from 11 June 2016 to 9 June 2017. Inclusion and exclusion criteria were as follows. We included the participants with age >40 years, phakic, refractive error ≤3 D myopia and ≤1 D hypermetropia. We excluded patients with diabetes mellitus and hypertension, other types of glaucoma, retinal or uveal diseases, diabetic and hypertensive retinopathy, refractive error >3 D myopia and >1 D hyperopia, history of ocular trauma, any intraocular surgery or injections which are known to affect the CT.
Methodology
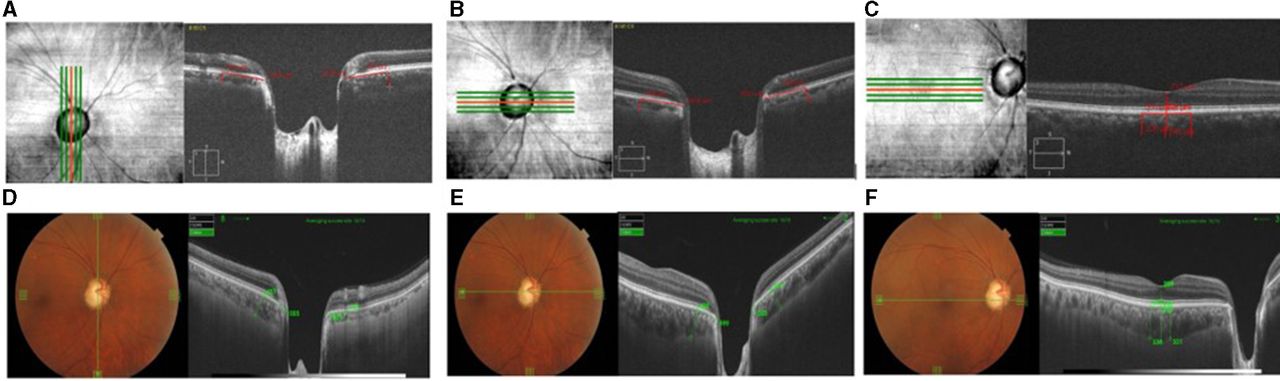
An informed written consent was obtained from all participants and the study methodology was approved by our institutional review board. All methods adhered to the tenets of the Declaration of Helsinki for research involving human subjects. Detailed ocular examination was performed. The scans on SD-OCT were taken in enhanced depth imaging (EDI) mode (Zeiss, Cirrus High-definition-OCT) five-line raster (6 mm) vertical and horizontal scans at the optic disc and at the macula, and scans on SS-OCT (Topcon, Deep retinal imaging-OCT Triton) five-line cross (12 mm) at the optic disc and at the macula were performed. We used the B-scan passing through the centre of the disc for uniformity of the measuring point and measured CT using built-in calliper, 1 mm from the disc margin in the superior, inferior, nasal and temporal quadrants, subfoveal and 500 μm nasal and temporal to fovea (figure 1).

Image acquired using SD-OCT EDI mode. (A) Five-line raster vertical at optic disc and measurement of choroidal thickness 1 mm from the disc margin superiorly and inferiorly. (B) Five-line raster horizontal at optic disc and measurement of choroidal thickness 1 mm from the disc margin nasally and temporally. (C) Five-line raster horizontal at the macula and measurement of choroidal thickness at fovea and 500 μm nasal and temporal to fovea. Image acquired using SS-OCT. (D) Five-line cross at optic disc and measurement of choroidal thickness 1 mm from the disc margin superiorly and inferiorly. (E) Five-line cross at optic disc and measurement of choroidal thickness 1 mm from the disc margin nasally and temporally. (F) Five-line cross at macula and measurement of choroidal thickness at fovea and 500 μm nasal and temporal to fovea.
Patient and public involvement
The protocol was explained in local language and written informed consent was obtained. The patients were not part of the design of the study. The normals were volunteers or hospital staff who consented for the study. This being a non-invasive test and a cross-sectional one, the tests were performed as per the patient’s convenience on their regular follow-up visit. The tests that were not a part of their routine glaucoma follow-up were not charged to the patient. They were also informed that there would be no benefit of participating in the study but the clinical information obtained from the study may help us understand the disease better.
Data collection
Age, gender, best corrected visual acuity, refractive error, IOP, cup-disc ratio, number and type of antiglaucoma medication (AGM) and CT measurements on both machines in all the study participants were collected.
Outcome measures
The difference in CT in peripapillary and macular area between cases and controls measured on SD-OCT and SS-OCT. CT difference between SS-OCT and SD-OCT in cases and controls.
Statistical methods
Statistical analyses were performed using R (V.3.3.2, ‘multcomp’ and ‘geepack’ package). Categorical data were described using proportions. Continuous data were checked for normality using Shapiro-Wilk test. Demographic and baseline clinical data were compared using generalised estimating equations (GEE). To compare between SS-OCT and SD-OCT at different scan positions for the case and control subjects we used multiple comparison of means by linear mixed effects model. To account for possible correlation between both eyes of the same patient we used linear mixed effects model or GEE. 95% CI and Bonferroni adjusted p value were also reported. For intraobserver and interobserver agreement we used Bland-Altman plot. A p value <0.05 was considered statistically significant.
Results
The demographic and clinical characteristics of controls and cases are summarised in table 1.
Demographic and clinical characteristics of controls and cases
In our study cohort, cases were older than controls (p=0.06), there were more females in the control group (p=0.01). In eyes with POAG, all were on AGMs. Among them, 12% were on four AGMs, 48% on three AGMs, 20% on two AGMs and 20% on one AGM. Among the AGMs used, 92% were on prostaglandin analogues and additional drugs were used in combinations. Mean CT measurements in both the groups are shown in table 2.
Summary of mean difference of choroidal thickness measured on SS-OCT and SD-OCT of cases and controls and mean difference of cases and controls measured on SD-OCT and SS-OCT
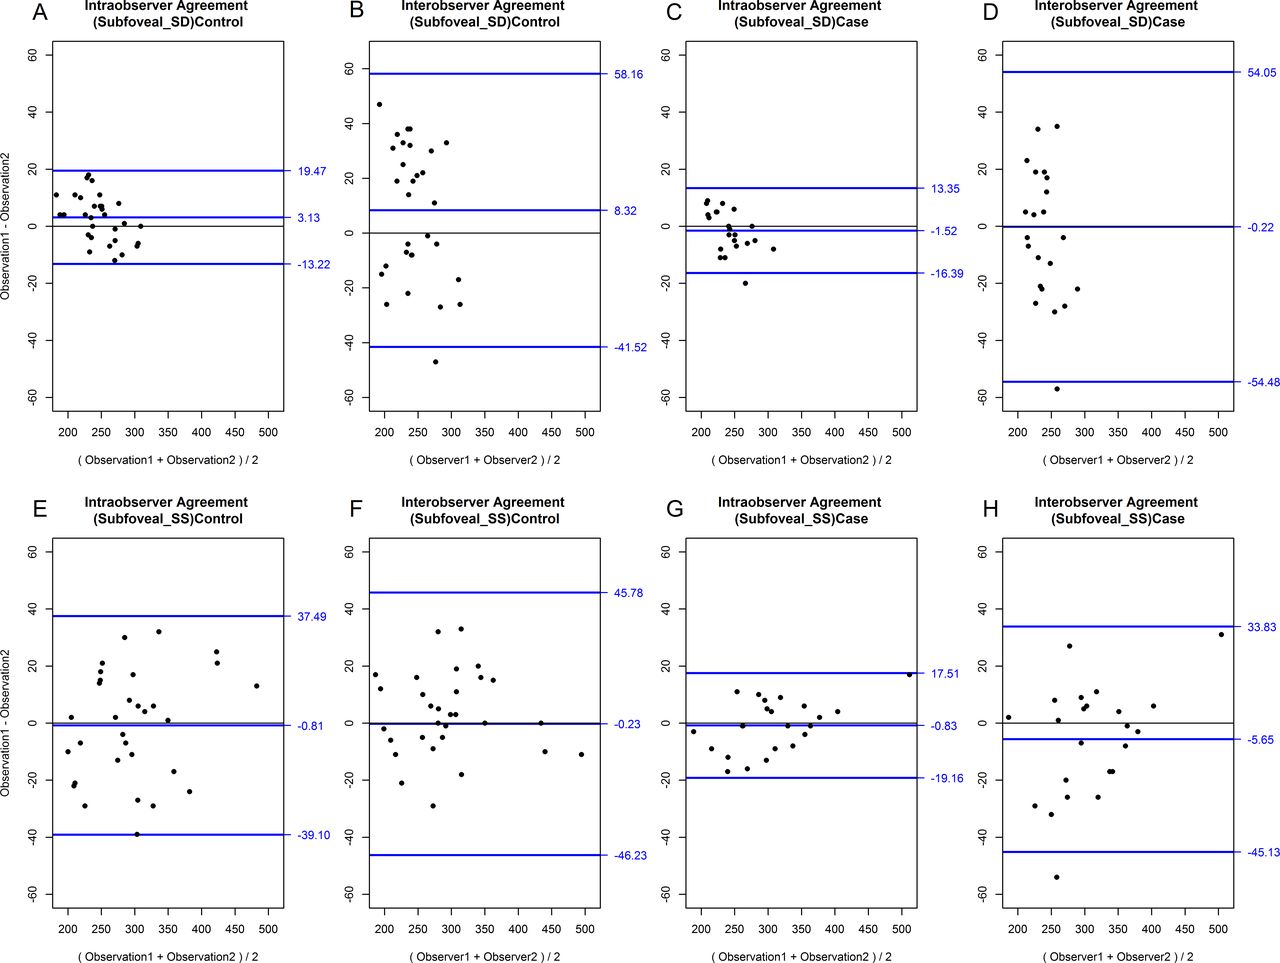
In our study, we found a good intraobserver and interobserver agreement for subfoveal CT (SFCT) measured by both the machines (figure 2).

Bland-Altman plot showing the (A) intraobserver and (B) interobserver variability in SFCT in controls in SD-OCT, the (C) intraobserver and (D) interobserver variability in SFCT in cases in SD-OCT, the (E) intraobserver and (F) interobserver variability in SFCT in controls in SS-OCT, the (G) intraobserver and (H) interobserver variability in SFCT in cases in SS-OCT. The Bland-Altman plots of SFCT showed 95% intraobserver measurement agreement within ±20 μm in both cases and controls and the interobserver agreement within ±55 and ±45 μm in cases and controls on SD-OCT and SS-OCT, respectively. SD-OCT, spectral domain optical coherence tomography; SFCT, subfoveal choroidal thickness; SS-OCT, swept source optical coherence tomography.
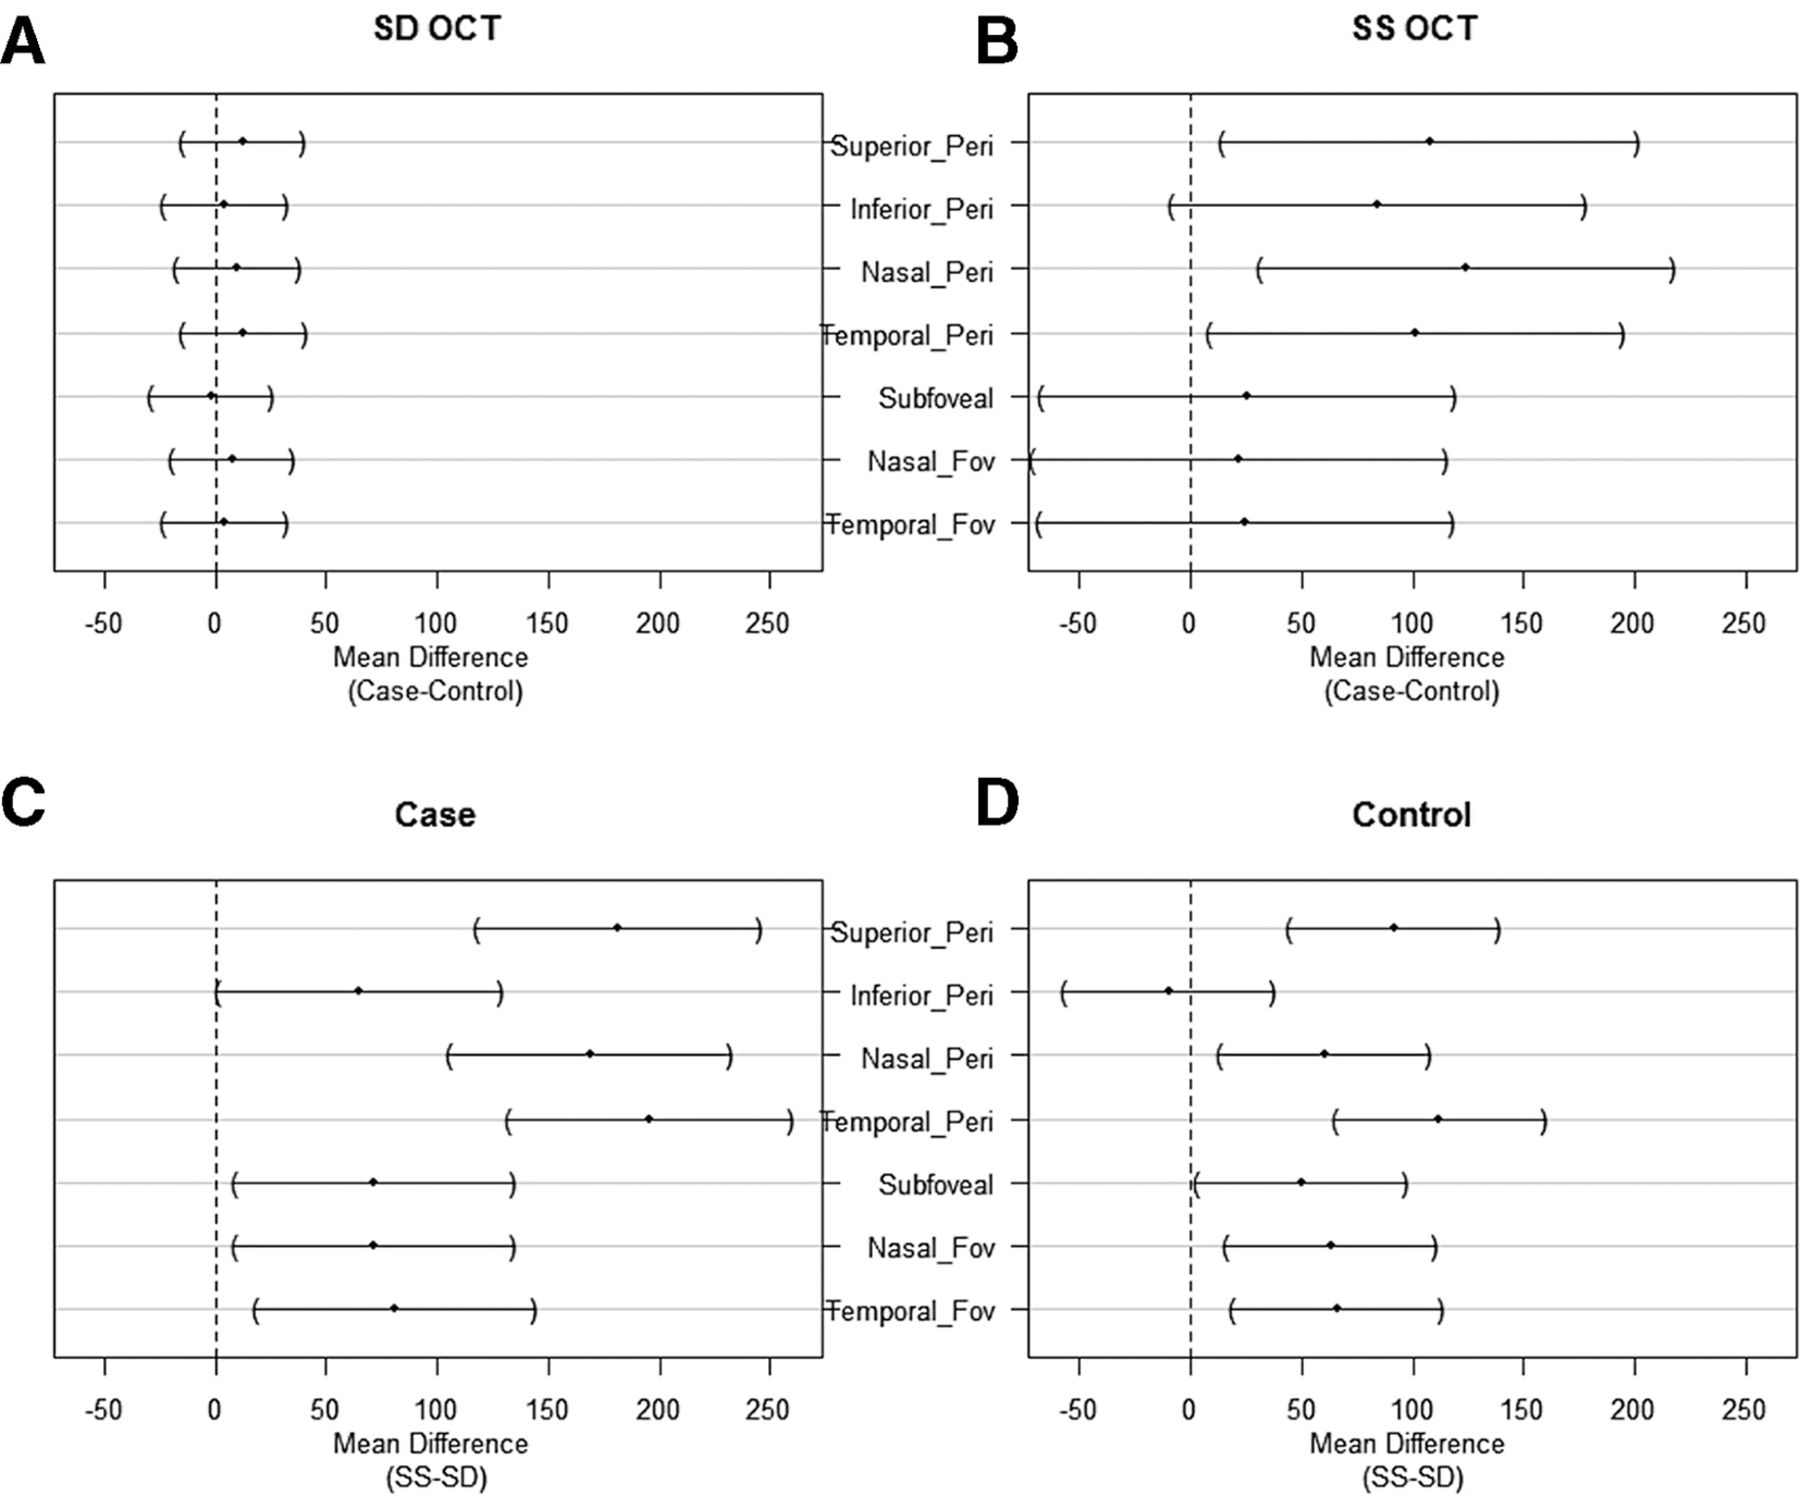
The choroid was thicker in POAG subjects compared with healthy subjects in all the seven points measured on SD-OCT and SS-OCT; however, it was not statistically significant on SD-OCT but it was significantly different on SS-OCT in the peripapillary area. Choroid was significantly thicker on SS-OCT compared with SD-OCT in peripapillary and macular area in both cases and controls (figure 3).
Mean difference plot of choroidal thickness measurements between cases and controls on (A) SD-OCT and (B) SS-OCT. Mean difference plot of choroidal thickness measurements on SS-OCT and SD-OCT of (C) cases and (D) controls. SD-OCT, spectral domain optical coherence tomography; SS-OCT, swept source optical coherence tomography.
The mean CT on SS-OCT in POAG was thicker compared with CT on SD-OCT at superior peripapillary area (p=0.00), inferior peripapillary area (p=0.04), nasal peripapillary area (p=0.00) and at temporal peripapillary area (p=0.00). The SFCT and CT nasal to fovea (p=0.02), and CT temporal to fovea were all thicker compared with SD-OCT (p=0.00).
The mean CT on SS-OCT in controls was thicker compared with SD-OCT at superior peripapillary area (p=0.00), while at inferior peripapillary area it was slightly thinner than CT on SD-OCT, however it was not statistically significant (p=1.00). At nasal and temporal peripapillary area it was thicker than CT on SD-OCT (p=0.00). The SFCT (p=0.03), CT nasal to fovea and CT temporal to fovea were thicker than CT on SD-OCT (p=0.00).
The mean CT in POAG on SD-OCT at all peripapillary points was thicker than in the controls, and thinner subfoveally, however it was not statistically different (p=1.00), and also the lower confidence limit of mean difference at all the areas was in negative values, implying that in few patients the CT was thin in cases compared with controls.
The mean CT in POAG on SS-OCT at superior peripapillary area (p=0.02), at inferior peripapillary area (p=0.13), at nasal peripapillary area (p=0.00) and at temporal peripapillary (p=0.03) area was thicker than in healthy controls. The SFCT was slightly thicker than in the controls; CT nasal to fovea and CT temporal to fovea were also slightly thicker than in healthy controls (p=1.00), however the CT difference in the peripapillary areas except inferior peripapillary and macular area was statistically significant.
There was a wide range of CT measured at all the areas in the healthy controls and the POAG eyes, and there was a wide variation in the CT measured on both the machines. In controls, on SD-OCT the choroid was thinnest at the temporal peripapillary area (219.68 µm) and thickest at subfoveal location (246.19 µm), however, in POAG subjects it was thinnest at inferior peripapillary area (222.04 µm) and thickest at 500 µm nasal to the fovea (244.12 µm). In controls, on SS-OCT the choroid was thinnest at inferior peripapillary area (210.1 µm) and thickest at the temporal peripapillary area (331.68 µm), similarly in cases it was thinnest at inferior peripapillary area (287.67 µm) and thickest at the temporal peripapillary area (426.46 µm).
Discussion
The present study looked at the CT in POAG subjects (cases) compared with normal healthy subjects (controls) using SD-OCT and SS-OCT at the peripapillary and subfoveal locations. In our study, the CT measured on SD-OCT in cases was found to be thicker compared with controls in both peripapillary and macular area, however this difference was not statistically significant. The lower confidence limit of mean difference at all the points was in negative values on SD-OCT and a few points in SS-OCT, implying that in few patients the CT was thin in cases compared with controls. Similarly, a meta-analysis by Zhang et al (evaluating 22 studies) compared CT in glaucoma and normal subjects using EDI mode SD-OCT and found no significant difference in CT in POAG and normal subjects.6 This observation on SD-OCT might be due to poor sclerochoroidal delineation.
On SS-OCT, we found thicker CT in cases compared with controls in peripapillary and macular area, but only PPCT was statistically significantly thicker except inferior peripapillary (p=0.13). In a study by Zhang et al, CT was found to be thinner in glaucomatous eyes compared with normal subjects using SS-OCT, which they attributed to older age, long axial length and more females in glaucoma subjects compared with normal subjects, however, they found no correlation between gender and CT.11 In our study, although the cases were older than controls we found increased CT, which might be due to more males, 68% in cases compared with 29% in controls. There are controversial reports on the effect of gender on CT measurements with studies reporting thicker CT in males,12 thicker CT in females,13 or found no relationship with gender.14
In our study, all the cases had well-controlled IOP on AGMs. Majority of our cases, that is, 23 out of 25 eyes (92%), were on prostaglandin analogues, which could have contributed to increased CT. This is supported by a study done by Akyol et al15 who looked at the SFCT using Optovue RTVue. In patients newly diagnosed with glaucoma, CT was compared before and after starting treatment on bimatoprost in one group and brinzolamide with timolol in another group. They found increased CT in both the groups, however CT was significantly thicker in bimatoprost group compared with brinzolamide with timolol group. This difference was attributed to the mechanism of action of bimatoprost, which acts by increasing the uveoscleral outflow and which is likely to have contributed to increase in CT. Increase in CT was shown to be associated with reduction in IOP following cataract surgery and trabeculectomy.16 17 Therefore, increase in CT in POAG eyes in our study could be attributed to decrease in IOP with medications and use of prostaglandin analogues in majority of the eyes. The major limitation of this hypothesis is that we do not have CT measurements of these eyes before medications were started. We compared the CT in eyes with prostaglandin anlogue (PGA) as monotherapy and those with multiple drugs and did not find any significant difference in their CT measurements.
The CT measured on SS-OCT was thicker than the CT measured on SD-OCT with EDI mode both in cases and controls, this might be due to the greater penetration of light in SS-OCT compared with SD-OCT which gives better delineation of sclerochoroidal junction and hence the higher values. Similar results were observed by Copete et al18 and Matsuo et al.19 In our study, we included the eyes which had well-delineated outer choroidal boundary; however, there could be some variability (higher or lower measurements) which may explain the different values from SD-OCT.
CT varied widely in different quadrants and had a wide range. The SFCT in our study in controls using SD-OCT was 246.19±32.48 µm (range: 180–309 µm) which was similar to SFCT of 254.6±107.4 µm in a study by Wei et al20 and Shao et al21; however, the SD was high in their study and included eyes with Chinese ethnicity. The SFCT measured on SS-OCT in our study in controls was 295.94±70.98 µm (range: 195–489 µm) which was similar to SFCT of 285.7±88.9 µm (range: 130–527 µm) in a study by Copete et al in Spanish population.18
In controls, the CT measured on SD-OCT with EDI mode in the peripapillary area was thinnest at the temporal peripapillary location (219.68 µm) and thickest at subfoveal location (246.19 µm). Similarly, in a study by Margolis and Spaide, the SFCT was found to be thickest, and the values were higher (287 µm) than in our study.22 In cases, the CT on SD-OCT was found to be thinnest at inferior peripapillary location (222.04 µm) and thickest at 500 µm nasal to the fovea (244.12 µm).
In controls, on SS-OCT, the CT was thinnest at the inferior peripapillary location (210.1 µm) and thickest in the temporal peripapillary location (331.68 µm). Similarly, in cases on SS-OCT, the choroid was found to be thinnest at inferior peripapillary location (287.67 µm) which was similar to the previous study by Lyu et al,9 and was thickest at the temporal peripapillary (426.46 µm) location. The CT was found to be thinnest in the inferior peripapillary area in cases on both SD-OCT and SS-OCT, implicating its possible role in early loss of neuronal tissue inferiorly in eyes with POAG and that posterior ciliary circulation which supplies the choroid might play a role in the pathogenesis of POAG.
Limitations of our study are small sample size; and female to male ratio in controls and cases was not comparable. Since this was a cross-sectional study, we did not have the CT measurements before and after initiating treatment in the POAG eyes and multiple drugs were used for IOP control. Due to these two reasons, the possible hypothesis of PGA induced or greater reduction in IOP in POAG eyes with medications (irrespective of the drug) as a cause for finding increased CT in POAG eyes compared with normals cannot be substantiated. Another limitation is the CT measurement in the subfoveal area. All four quadrants in the peripapillary area were included, however, only two quadrants, nasal and temporal to fovea, were included to compare the SFCT. There is ample literature available on different quadrants around the fovea with regard to CT, hence in the current study, we particularly focused on peripapillary region rather than the macular region. The axial length is shown to affect the CT.11 In this study, we did not have the axial length data, however, we excluded eyes with refractive error greater than ±3.0, which could be a surrogate for the axial length measurement. However, we accept the limitation that it cannot replace axial length.
In conclusion, SS-OCT is possibly superior to SD-OCT in measuring CT due to better delineation of the sclerochoroidal junction in both healthy subjects and POAG eyes. CT was significantly higher in peripapillary area in POAG eyes as measured on SS-OCT. SFCT did not show any significant difference in eyes with POAG in comparison to normal subjects on both SD-OCT and SS-OCT. Large sample size and measuring the CT before and after initiation of medical treatment (possibly with individual type of AGM) at various IOP ranges in POAG subjects may answer the question better. Also considering various ocular factors that affect the CT and also correlating peripapillary and macular CT in the quadrant or area of visual field loss might provide further insights into this observation.
Acknowledgments
The authors acknowledge Dr Vanita Pathak Ray for initiating the study.
References
Footnotes
Contributors SK: conception, design, acquisition of data and drafting the article. JC: conception, design and revising the article critically. MHA: statistical analysis. CSG: revising the article critically. SS: drafting the article, revising the article critically.
Funding This study was supported by the Hyderabad Eye Research Foundation (http://dx.doi.org/10.13039/501100005809).
Competing interests None declared.
Patient consent for publication Not required.
Ethics approval The study methodology was approved by our institutional review board.
Provenance and peer review Not commissioned; externally peer reviewed.