Article Text

Abstract
Objective Explore relationships between systemic exposure to intravitreal aflibercept injection (IAI) and systemic pharmacodynamic effects via post hoc analyses of clinical trials of IAI for neovascular age-related macular degeneration (nAMD) or diabetic macular oedema (DME).
Methods and analysis Adults from VGFT-OD-0702.PK (n=6), VGFT-OD-0512 (n= 5), VIEW 2 (n=1204) and VIVID-DME (n=404) studies were included. Validated ELISAs were used to measure concentrations of free and bound aflibercept (reported as adjusted bound) in plasma at predefined time points in each study. Non-compartmental analysis of concentration–time data was obtained with dense sampling in VGFT-OD-0702.PK and VGFT-OD-0512. Sparse sampling was used in VIEW 2 and VIVID-DME. Blood pressure or intrarenal function changes were also investigated.
Results Following intravitreal administration, free aflibercept plasma concentrations quickly decreased once maximum concentrations were achieved at 1–3 days postdose; pharmacologically inactive adjusted bound aflibercept concentrations increased over a longer period and reached plateau 7 days postdose. Ratios of free and adjusted bound aflibercept decreased over time. There were no meaningful changes in systolic/diastolic blood pressure over the duration of each study at all systemic aflibercept exposure levels. For all treatment arms in VIEW 2, there was no clinically relevant change in mean intrarenal function from baseline at week 52. Overall, incidence of systemic adverse events in VIEW 2 and VIVID-DME was low and consistent with the known safety profile of IAI.
Conclusion IAI administration was not associated with systemic effects in patients with nAMD or DME as measured by blood pressure or intrarenal function, two known pharmacologically relevant effects of anti-vascular endothelial growth factor.
- drugs
- pharmacology
- retina
- treatment medical
- vision
This is an open access article distributed in accordance with the Creative Commons Attribution Non Commercial (CC BY-NC 4.0) license, which permits others to distribute, remix, adapt, build upon this work non-commercially, and license their derivative works on different terms, provided the original work is properly cited, appropriate credit is given, any changes made indicated, and the use is non-commercial. See: http://creativecommons.org/licenses/by-nc/4.0/.
Statistics from Altmetric.com
Key messages
What is already known about this subject?
Intravitreally administered vascular endothelial growth factor (VEGF) inhibitors like aflibercept, ranibizumab and bevacizumab are bioavailable in the systemic circulation. Systemic VEGF concentrations decrease to a variable extent and duration under these treatments.
What are the new findings?
Systemic concentrations of free aflibercept after intravitreal administration of the approved dose of 2 mg are too low to elicit pharmacodynamic effects as shown for blood pressure or intrarenal function, two known pharmacologically relevant effects of anti-VEGF.
How might these results change the focus of research or clinical practice?
The pharmacokinetic/pharmacodynamic data presented in this paper further support the favourable safety profile of aflibercept and dispel concerns related to systemic side effects after intravitreal administration of aflibercept at the approved dose.
Introduction
Due to the ability of vascular endothelial growth factor (VEGF) to promote angiogenesis, VEGF and its receptors are important therapeutic targets in vascular disease.1 While both play major roles in physiological angiogenesis, they are also associated with pathological angiogenesis, such as in cancer2 and retinal disease.
Currently approved anti-VEGF treatment options for retinal disease include intravitreal (IVT) aflibercept injection (IAI), ranibizumab and pegaptanib injections, while IVT use of compounded bevacizumab is used off-label. However, despite local IVT administration, which results in low systemic concentrations, and a considerable volume of published safety and efficacy data that demonstrate the safe and effective use of anti-VEGF agents in the eye, there is still some debate surrounding the potential for systemic effects, particularly cardiovascular events.
Initial uncertainty was raised by the pivotal ranibizumab studies, MARINA (Minimally Classic/Occult Trial of the Anti-VEGF Antibody Ranibizumab in the Treatment of Neovascular Age-Related Macular Degeneration) and ANCHOR (Anti-VEGF Antibody for the Treatment of Predominantly Classic Choroidal Neovascularization in Age-Related Macular Degeneration).3–5 In both studies there was a slight increase in the incidence of myocardial infarction and stroke in patients receiving IVT ranibizumab compared with controls.3–5 The 2-year results of the Diabetic Retinopathy Clinical Research Network comparative effectiveness Protocol T study indicated an imbalance in the number of Antiplatelet Trialists’ Collaboration (APTC)-defined arterial thromboembolic events (ATE) for patients in the ranibizumab arm compared with the IAI and bevacizumab arms.6 In contrast, the Comparison of Age-related Macular Degeneration Treatment Trials reported that more patients receiving IVT bevacizumab experienced multiple systemic serious adverse events (AE) than those receiving ranibizumab,7 8 while the Inhibit VEGF in Age-related Choroidal Neovascularization trial reported no differences between bevacizumab and ranibizumab in the proportion of patients experiencing serious systemic AEs.9 In the VIEW studies there were no differences between aflibercept and ranibizumab in the overall incidence of systemic (non-ocular) AEs or serious AEs.10 Whether these imbalances between agents represent true findings, or are due to chance, has yet to be fully elucidated. Additionally, while there are notable differences in systemic pharmacokinetics and pharmacodynamics of anti-VEGF treatments following IVT administration, it is not known whether these differences translate into differences in systemic effects.
It has been reported that ranibizumab (a 48 kDa monovalent monoclonal antibody fragment containing an antigen-binding Fab without the Fc domain) appears only transiently in the systemic circulation and is rapidly cleared, whereas bevacizumab (a 149 kDa full-length, bivalent monoclonal antibody against VEGF-A) and aflibercept (a 115 kDa recombinant fusion protein comprising key VEGF-binding domains of human VEGF receptors 1 and 2 fused to the Fc domain of human IgG1) have greater systemic exposure and have been reported to produce a reduction of free VEGF in plasma.11–13 It should be noted that measurement of free VEGF in plasma can be challenging because of platelet rupture and/or activation, which can lead to release of intracellular VEGF and thus increased levels of VEGF.11 In addition, it has been shown that presence of VEGF-binding compounds in samples affects the VEGF measurement by the assay and can impair the validity of results, in particular when samples with different anti-VEGF drugs are compared.14
In a previous preclinical study, aflibercept has demonstrated a higher binding affinity to VEGF (and placental growth factor) than either ranibizumab or bevacizumab.15 Due to its intact Fc region, aflibercept is subject to rescue and recycling by the neonatal Fc receptor in endothelial cells, a process known to slow elimination of protein therapeutics containing an Fc domain.11
After IVT injection, aflibercept is systemically available in two distinct forms: free and bound. The free form of aflibercept is the active drug moiety and is capable of binding endogenous VEGF in a 1:1 stoichiometry to form a stable, inert VEGF:aflibercept complex (referred to as ‘bound’ aflibercept). Bound aflibercept is incapable of further VEGF binding and is thus biologically inactive. Aflibercept binds VEGF with a high affinity, with an equilibrium dissociation constant of 0.49 pM. This high affinity is attributable to fast association rates (ka/105 = 410/(Mˑs)) and slow dissociation rates (kd/10-5 = 2/(Mˑs)) of aflibercept to VEGF-A165.16 As a result of this slow dissociation rate, once bound to VEGF, there is virtually no release of aflibercept from this stable complex; this finding is in contrast to the considerably faster dissociation rates of ranibizumab and bevacizumab from VEGF.
The aim of the current analysis was to determine, using established and known sensitive biological indices of systemic VEGF inhibition, the relationship between systemic exposure to aflibercept after IVT administration and systemic pharmacodynamic effects of IAI in patients enrolled in clinical trials of IAI for neovascular age-related macular degeneration (nAMD) or diabetic macular oedema (DME).
Methods
Participants
Adult patients included in clinical trials of IAI for nAMD or for DME were included in this analysis. All patients provided informed consent to participate in the clinical trials; this consent covers the current analysis.
Study design
Analyses of studies in the IAI clinical trial database that included pharmacokinetic and/or pharmacodynamic data were conducted; the following trials were included: VGFT-OD-0702.PK, VGFT-OD-0512, VIEW 2 and VIVID-DME.
VGFT-OD-0702.PK was a pharmacokinetic extension study of the US-based clinical trial VGFT-OD-0702 (NCT00527423), a randomised, single-masked phase II study comprising patients with nAMD previously enrolled in clinical trials of IAI. Patients were treated with 2 mg IAI every 8 weeks after their previous treatment in study VGFT-OD-0702. Pharmacokinetic samples were taken after first injection only.
VGFT-OD-0512 (NCT00320814) was a phase I, US-based exploratory, 6-week open-label study in patients aged ≥18 years with DME who were treated with IAI 4.0 mg. Blood samples for pharmacokinetic analysis were collected at screening (visit 1) through day 155 (visit 8).
VIEW 2 (NCT00637377) was a phase III, randomised, double-masked, active-controlled trial conducted in in Europe, Asia, Australia and South America. Patients aged ≥50 years with nAMD were included in this trial. IAI was administered monthly at a dose of 0.5 mg every 4 weeks or 2 mg every 4 weeks, or 2 mg every 8 weeks after three initial monthly injections, and compared with monthly 0.5 mg ranibizumab.10
VIVID-DME (NCT01331681) was a phase III, randomised, double-masked, active-controlled, 148-week trial conducted in Europe, Japan and Australia. Patients aged ≥18 years with DME were included and randomised 1:1:1 to receive either IAI 2 mg every 4 weeks, IAI 2 mg every 8 weeks (after five initial monthly doses) or macular laser photocoagulation. The study designs of VIEW 2 and VIVID-DME have previously been fully described.10 17
Bioanalytical methods
Validated ELISAs were used to measure concentrations of free and bound aflibercept in the plasma of patients treated with IAI at predefined time points in each study. The free aflibercept ELISA measured systemic concentrations of aflibercept that were not in complex with VEGF, while the bound aflibercept ELISA measured systemic concentrations of aflibercept that were bound to endogenous VEGF to form a VEGF:aflibercept complex. The sum of both free and bound aflibercept is referred to as total aflibercept.
The assay for bound aflibercept was calibrated using the VEGF:aflibercept standards; the results are reported for bound aflibercept as weight per volume (eg, µg/L) of the complex (VEGF:aflibercept). Since 1 µg of complex (VEGF:aflibercept) equals 0.717 µg of aflibercept and 0.283 µg of VEGF, the concentration of the complex was multiplied by 0.717 to give an ‘adjusted bound’ aflibercept concentration, which is the concentration of aflibercept in the VEGF:aflibercept complex and is reported herein. The lower limits of quantitation (LLOQ) for free and adjusted bound aflibercept were 15.6 and 31.5 µg/L, respectively. For the calculation of arithmetic means, an analyte concentration below the LLOQ was set to zero. All valid concentration values were used for calculation of arithmetic means.
Pharmacokinetics/pharmacodynamics
Non-compartmental analysis of concentration–time data obtained with dense sampling was undertaken in VGFT-OD-0702.PK and VGFT-OD-0512. With this type of analysis, pharmacokinetic parameters like area under the curve (AUC) and maximum observed concentration (Cmax) are calculated based directly on the measured concentration–time data without model-based assumptions about body compartments of the drug. Plasma samples for free and bound aflibercept concentrations were collected at prespecified time points up to 28 and 154 days after administration, respectively. Sparse sampling for pharmacokinetics was used in VIEW 2 and VIVID-DME. Sampling time points are described in online supplementary appendix table 1. All samples for pharmacokinetic analyses were collected, processed and stored under conditions proven to ensure adequate analyte stability.
Supplemental material
Any changes in systolic/diastolic blood pressure, hypertension occurrence or intrarenal function change (measured using the urine protein:creatinine ratio [UPCR]),18 19 determined in single voided samples taken from baseline to end of study, were also investigated. Urine samples were obtained before performing fluorescence angiography to avoid artificial elevations in urine protein values.
Statistical analysis
Analyses of VGFT-OD-0702.PK, VGFT-OD-0512, VIEW 2 and VIVID-DME were based on available data for each study. All variables were analysed descriptively with appropriate statistical methods/categorical variables by frequency tables (absolute and relative frequencies) and continuous variables by sample statistics (ie, mean, SD, minimum and maximum).
Results
Patients
Key patient characteristics and demographics for the VGFT-OD-0702.PK, VGFT-OD-0512, VIEW 2 and VIVID-DME studies can be found in online supplementary appendix table 2.
Pharmacokinetics
VGFT-OD-0702.PK
A total of 10 plasma samples per patient were taken from six patients. Of the analysed plasma samples, three of the six patients had detectable concentrations of free aflibercept; however, the concentrations of free aflibercept were very low (≤54.0 µg/L) (figure 1, top). The resulting exposure in terms of AUC was therefore also very low and variable between patients. Only two patients had >1 quantifiable sample after Cmax.

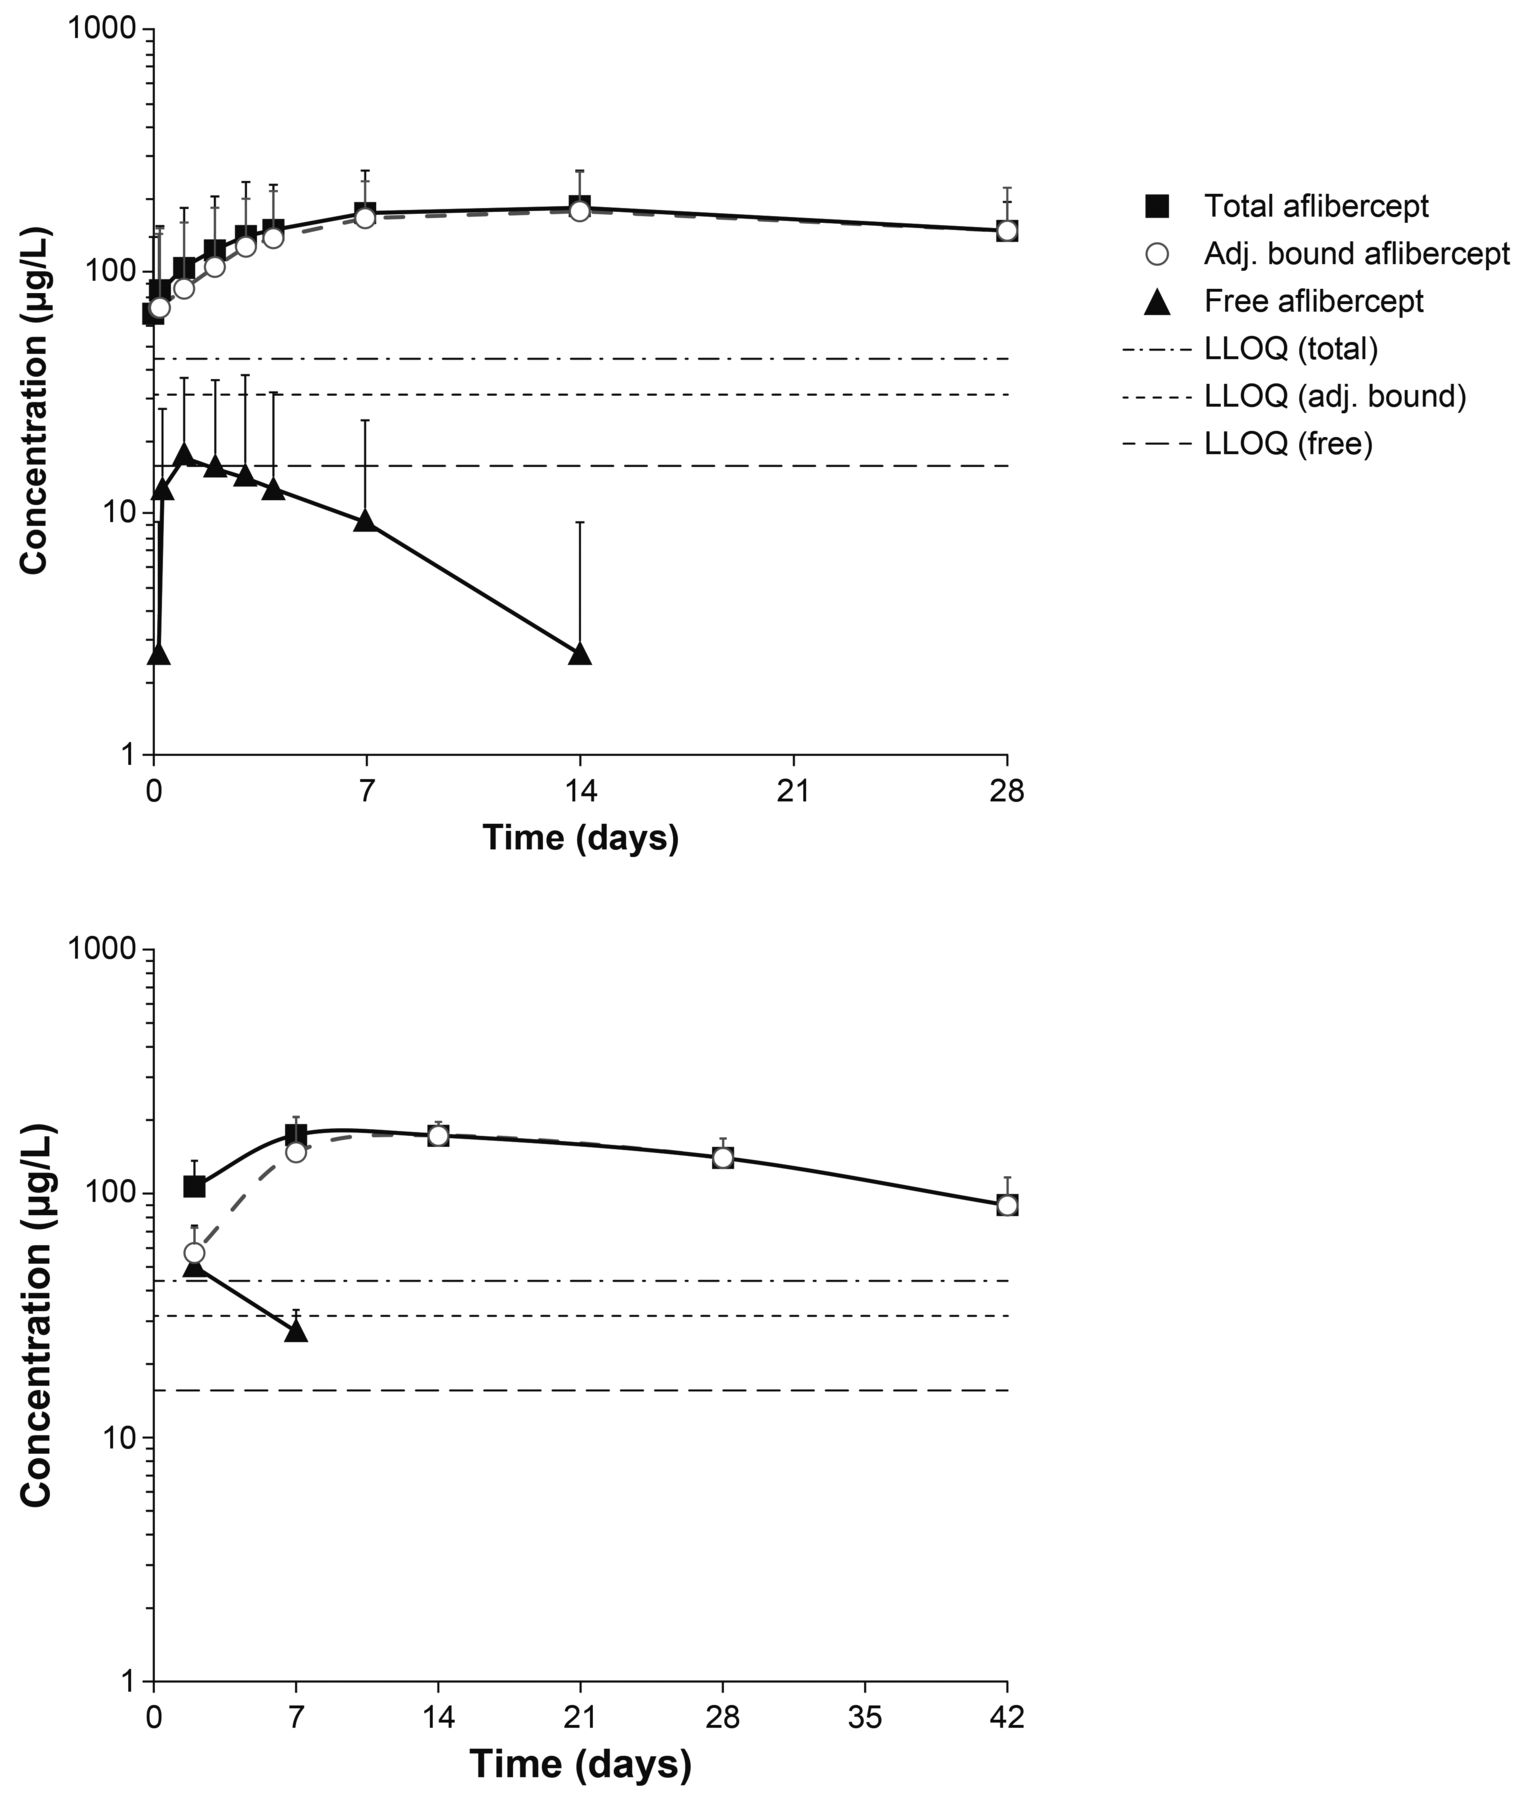
Mean observed log-scaled concentration of aflibercept (free and adjusted bound) following intravitreal administration in the VGFT-OD-0702.PK (top) and VGFT-OD-0512 (bottom) studies. LLOQ, lower limit of quantification.
Area under the plasma concentration–time curve up to the last measurable concentration (AUClast) ranged from 0 to 0.474 day·mg/L, with a median value of 0.022 day·mg/L and a mean of 0.119 day·mg/L. Cmax ranged from 0 to 54 µg/L, with a median value of 15 µg/L and a mean value of 19 µg/L (observed within 1–3 days after a 2 mg IVT injection). The concentrations of free aflibercept declined rapidly thereafter (within 7–14 days after IVT administration) to concentrations below the LLOQ (15.6 µg/L). The terminal elimination half-life (t½) could not be calculated by non-compartmental analysis from this study due to insufficient data, but was obviously much shorter than for adjusted bound or total aflibercept (figure 1, top).
The exposure to adjusted bound aflibercept (AUClast) was low, ranging from 2.12 to 6.71 day·mg/L (median: 4.67 day·mg/L; mean: 4.43 day·mg/L), while Cmax ranged from 100 to 286 µg/L (median: 193 µg/L; mean: 186 µg/L). The vast majority of the total aflibercept in the circulation after administration of IAI was in the inactive, bound form.
VGFT-OD-0512
For the pharmacokinetic analysis of aflibercept concentrations in VGFT-OD-0512, eight samples were collected in each of the five patients over 154 days after single administration of 4 mg IAI. Free aflibercept concentrations were only detectable in plasma at two time points after administration (2 and 7 days after administration) (figure 1, bottom). The maximum detected concentrations of free aflibercept were 92 and 36 µg/L on study days 3 and 8, that is, 2 and 7 days after administration, respectively. The corresponding mean concentrations of free aflibercept were 50 and 27 µg/L, respectively. The concentrations of adjusted bound aflibercept in plasma were quantifiable between 2 and 42 days after administration and consistently higher than the free aflibercept concentration. Total aflibercept concentrations were primarily a reflection of the pharmacologically inactive bound moiety.
VIEW 2
After administration of IAI 2 mg every 4 weeks and 2 mg every 8 weeks, the concentrations of free aflibercept in plasma were quantifiable in a minority of samples per time point; however, concentrations were very low and close to the analytical limits and were above the LLOQ in <30% of the patients (table 1). Cmax was observed 1 week after dosing, but concentrations of free aflibercept had declined to non-quantifiable concentrations in nearly all patients by 4 weeks after dosing. Repeated administration of IAI 2 mg every 4 weeks and 2 mg every 8 weeks did not result in accumulation of free aflibercept in plasma.
Concentration–time data for free aflibercept (µg/L) in the VIEW 2 and VIVID-DME studies over 52 weeks—all patients (SAF)
Exploratory subpopulation analysis revealed no clinically relevant differences in free or bound aflibercept concentrations in plasma with respect to age, sex, body mass index, creatinine clearance or geographic region (Europe and Japan).
For the lowest dose group of 0.5 mg, only two individual plasma samples obtained in the 167 patients with pharmacokinetic sampling in this group had free aflibercept concentrations above the LLOQ, that is, 1–4 hours after the first administration (25.3 μg/L) and in week 12 (31.2 μg/L). Therefore, pharmacokinetic results of this dose group are not further discussed in this section.
Adjusted bound aflibercept concentrations >LLOQ were observed in plasma starting 1 week after administration of IAI. Cmax was observed 4 weeks after the third administration of IAI 2 mg every 4 weeks (median concentration 120 µg/L after a dose of 2 mg). Following administration of IAI 2 mg every 4 weeks, mean adjusted bound aflibercept concentrations increased by approximately 1.5-fold between weeks 1 and 12. There was no further increase in the mean concentrations of IAI in plasma beyond week 12 with IAI 2 mg every 4 weeks dosing; however, after IAI 2 mg every 8 weeks dosing, the systemic adjusted bound aflibercept concentrations declined by approximately 30% in the 8 weeks postdose (compared with 4 weeks postdose).
VIVID-DME
Similar to VIEW 2, after administration of IAI 2 mg every 4 weeks and 2 mg every 8 weeks, the concentration of free aflibercept in plasma was low and below the LLOQ in most patients (table 1); at the time point of Cmax (days 2–4), about 50% of the concentrations were not quantifiable.
Repeated administration of IAI 2 mg every 4 weeks or 2 mg every 8 weeks did not result in accumulation of free aflibercept in plasma. Adjusted bound aflibercept concentrations were observed in plasma 2–4 days after administration of IAI. Cmax was observed at week 24 (ie, 4 weeks after the sixth administration of the IAI 2 mg every 4 weeks dosing regimen; note that no pharmacokinetic sample was taken in week 12 of this study) and at week 52 (ie, 4 weeks [half the dosing interval] after the ninth administration of the IAI 2 mg every 8 weeks dosing regimen), with mean values of approximately 150 and 100 µg/L, respectively.
Pharmacodynamics
After IVT aflibercept administration, there were no meaningful changes from baseline in systolic blood pressure over the duration of the studies, and no clinically relevant differences between treatments or indications (online supplementary appendix figure 1). Similar results were observed for diastolic blood pressure (data not shown).
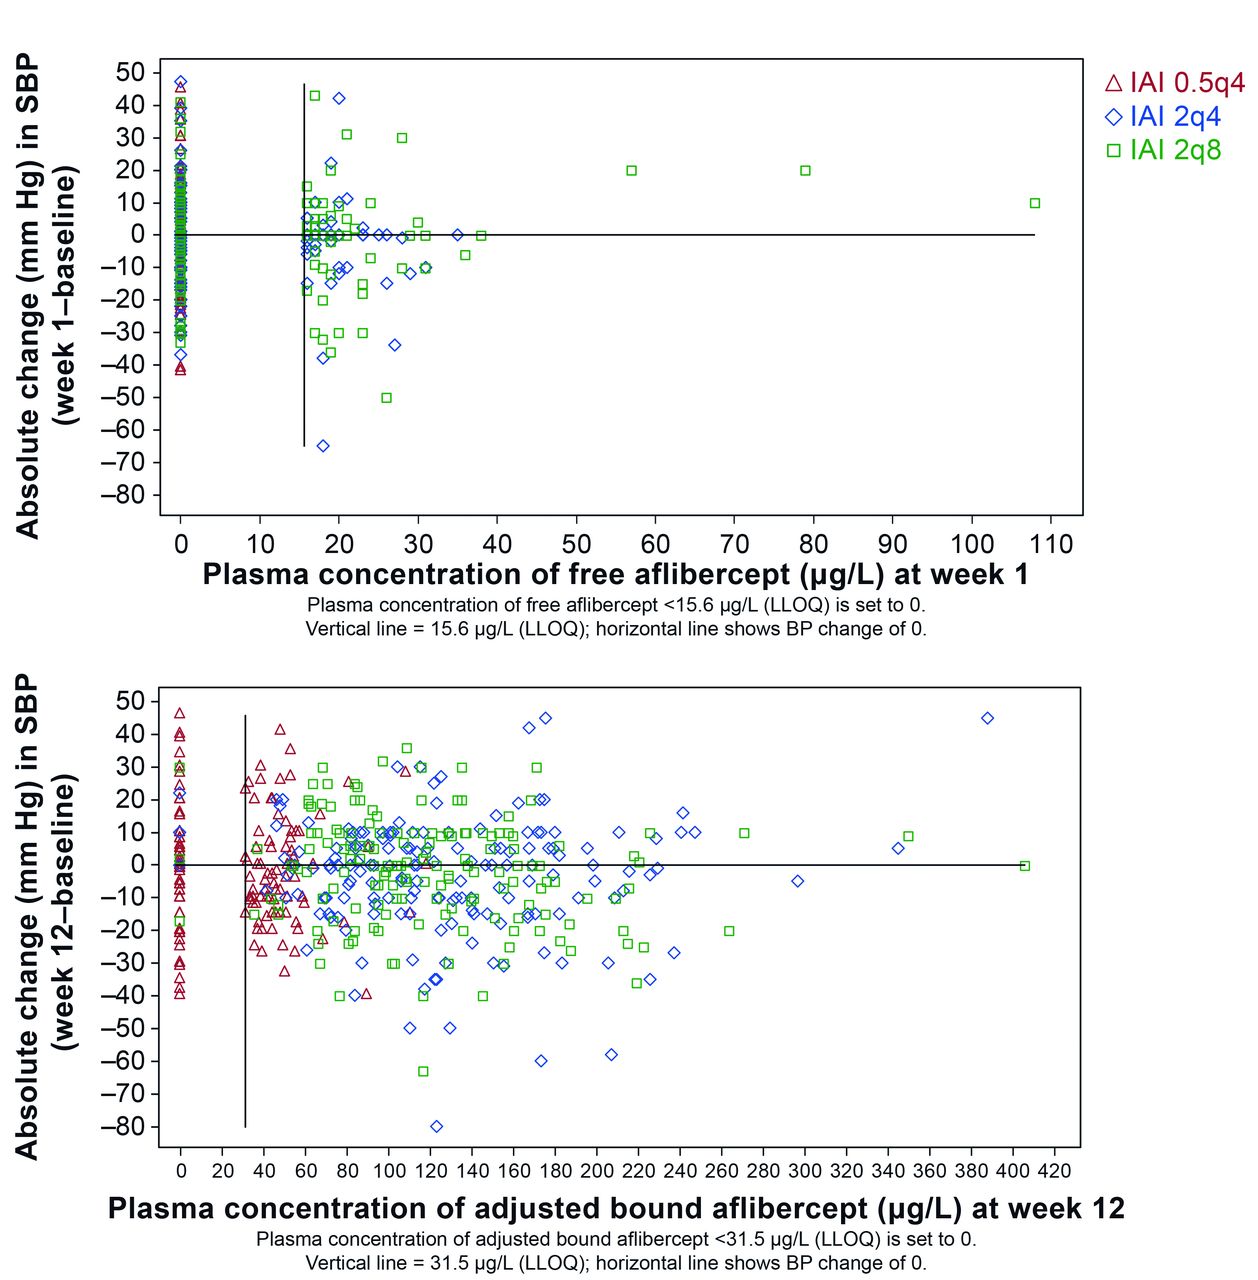
In patients treated with IAI in VIEW 2, blood pressure was evaluated relative to free or adjusted bound aflibercept concentrations in plasma. For this analysis, time points of Cmax were selected, that is, week 1 for free aflibercept and week 12 for adjusted bound aflibercept. Systemic concentrations of free or adjusted bound aflibercept did not correlate with blood pressure changes (figure 2). Blood pressure changes in patients with free or bound aflibercept concentrations below the LLOQ were in the same range as those with free aflibercept concentrations >LLOQ and up to the individual observed maximum of about 110 µg/L of free aflibercept and about 410 µg/L for adjusted bound aflibercept. Furthermore, there is not any indication for a trend of blood pressure increase with increasing aflibercept concentrations or IVT dose levels.

Relationship between the absolute change in systolic blood pressure (SBP) from baseline and the concentration of free (top) and adjusted bound (bottom) aflibercept in the VIEW 2 study. 0.5q4, 0.5 mg every 4 weeks; 2q4, 2 mg every 4 weeks; 2q8, 2 mg every 8 weeks; BP, blood pressure; IAI, intravitreal aflibercept injection; LLOQ, lower limit of quantification.
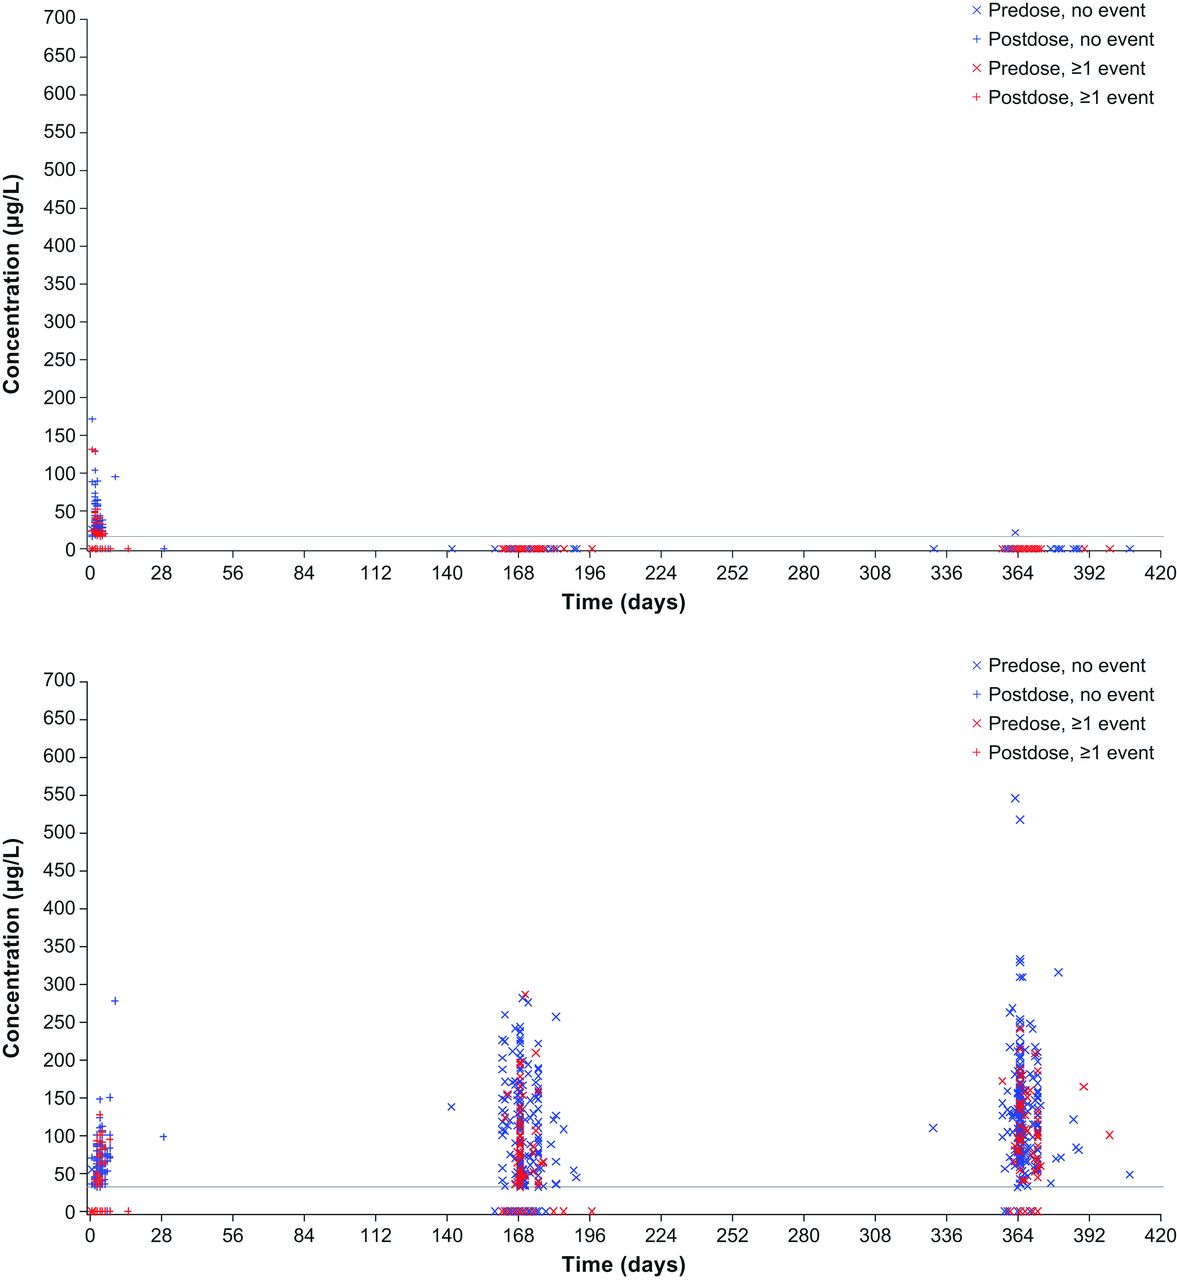
The relationship between free or bound aflibercept concentrations and the occurrence of blood pressure-related AEs, for example, hypertension was explored over the entire first year of VIEW 2, that is, the entire span of blood sampling for pharmacokinetics (figure 3). All aflibercept concentrations (observed range along the y-axis) of patients experiencing such an AE at any time during the first year of the study (time after first administration along the x-axis) were indicated by red symbols, while concentrations of patients without such event are shown in blue. The even distribution of the red symbols in the same range as the blue symbols indicates that there is no correlation between the concentrations of free or adjusted bound aflibercept in plasma with the occurrence of blood pressure-related AEs. In contrast, free aflibercept above 50 µg/L and adjusted bound aflibercept concentrations above 250 µg/L were all observed in patients without a blood pressure-related AE (figure 3).

Distribution of free (top) and adjusted bound (bottom) aflibercept concentrations over time by occurrence of any hypertension event in the VIEW 2 study.
Similarly, in VIVID-DME, systemic aflibercept exposure did not correlate with blood pressure changes (figure 4). Also when patients were stratified by age, there were no differences in systemic effects observed (online supplementary appendix figure 2).
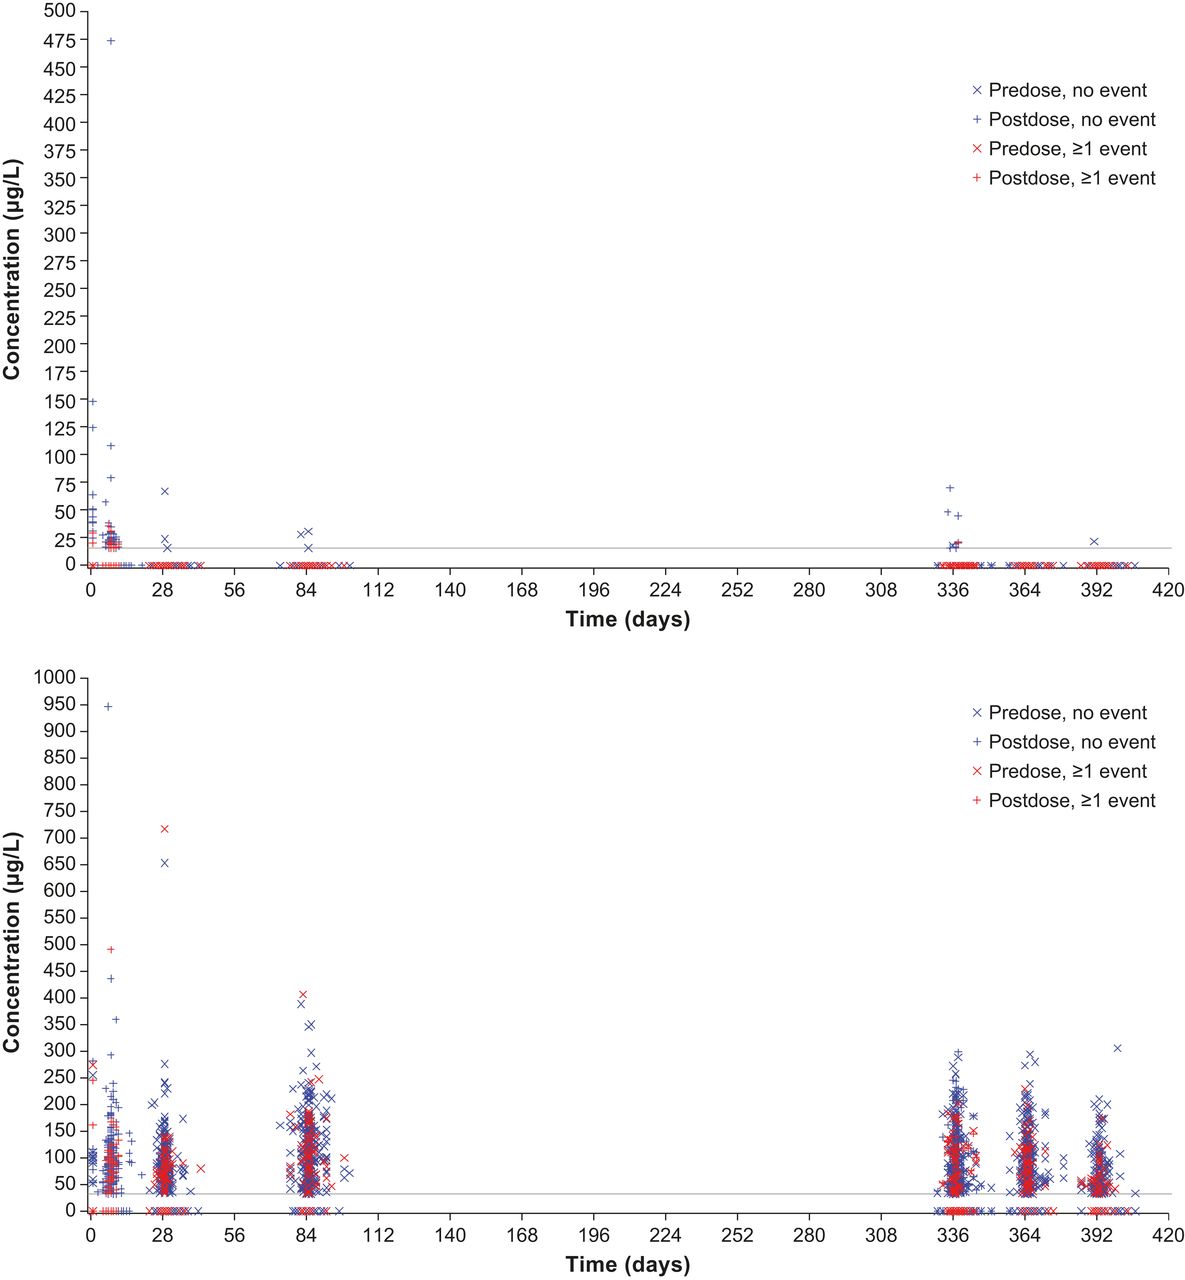
Distribution of free (top) and adjusted bound (bottom) aflibercept concentrations over time by occurrence of any hypertension event in the VIVID-DME study.
For all treatment arms in VIEW 2, there was no clinically relevant change in intrarenal function from baseline at week 52, with slight numeric decrease in mean UPCR over all IAI groups (see ‘IAI total’ in online supplementary appendix table 3) and mean changes in UPCR per individual treatment group (increase or decrease) in the range of ~1/10 of the SDs.
Safety
Overall, the incidence of systemic AEs, including APTC-defined ATEs, was low in VIEW 2 and VIVID-DME (online supplementary appendix table 4).
In VIEW 2, hypertension-related events (as treatment-emergent AEs [TEAE] and serious TEAEs, respectively [based on MedDRA SMQ]) were experienced by 82 (9.0%) and 4 (0.4%) IAI patients, and by 29 (10.0%) and 0 (0.0%) ranibizumab patients.
The most frequently reported ocular TEAEs in the study eye of patients receiving IAI (combined group) in VIEW 2 were reduced visual acuity (10.2%), conjunctival haemorrhage (10.0%) and retinal haemorrhage (9.2%). In patients receiving ranibizumab, the most frequently reported ocular TEAEs in the study eye were retinal haemorrhage (10.0%), eye pain (9.3%), conjunctival haemorrhage (7.9%) and macular degeneration (7.9%).
Similarly in VIVID-DME, hypertension-related TEAEs and serious TEAEs were experienced by 44 (16.2%) and 2 (0.7%) IAI patients, and by 19 (14.3%) and 0 (0.0%) laser patients, respectively.
The most frequently reported ocular TEAEs in the study eye of patients receiving IAI (combined group) in VIVID-DME were conjunctival haemorrhage (22.9%) and an increase in intraocular pressure (6.6%). In patients receiving laser, the most frequently reported ocular TEAEs in the study eye were abnormal visual acuity tests (14.3%) and reduced visual acuity (12.8%).
Overall AEs were consistent with the known safety profile of IAI in nAMD.
Discussion
The objective of this paper was to explore whether aflibercept, a potent VEGF inhibitor released at a low rate in the systemic circulation resulting in low or undetectable systemic concentrations after IVT administration at the approved dose of 2 mg, could be associated with systemic pharmacodynamic effects known to be related to VEGF inhibition.
IAI is approved in a number of indications including nAMD, DME, macular oedema following retinal vein occlusion and myopic choroidal neovascularisation; however, for the purpose of this pharmacokinetic/pharmacodynamic analysis the focus was on the two main indications, nAMD and DME. Available data from four studies with different pharmacokinetic sampling schemes were used. The two smaller studies VGFT-OD-0702.PK (nAMD) and VGFT-OD-0512 (DME) with dense pharmacokinetic sampling provided a full concentration–time profile for aflibercept plasma concentrations in a limited number of patients. In contrast, the large phase III clinical studies VIEW 2 (nAMD) and VIVID-DME were dependent on a limited number of sampling time points for drug concentration measurement in each patient to make them compatible with a phase III setting; however, this allowed sampling in a larger number of patients and therefore exploration of the relationship between pharmacokinetics and pharmacodynamics as well as AEs.
Based on evidence from oncology studies, using large, intravenously administered doses of anti-VEGF agents, blood pressure increases and changes in intrarenal function (UPCR) have become established sensitive markers of systemic vascular VEGF inhibition.20 21 Both of these parameters were monitored during clinical studies with IAI. Although the interindividual variability in UPCR18 is generally high in elderly patients (due to the higher number of concomitant disorders vs younger patients), results suggest that there is no difference in renal protein loss following IVT treatment with aflibercept compared with baseline. These results are also in line with postmarketing data, which do not support a causal association between IAI and development or worsening of renal impairment (Bayer data on file).
The current analyses were conducted for both free and bound aflibercept. Following IVT administration, aflibercept is slowly released from the eye into the systemic circulation, where it is predominantly observed in its biologically inactive bound form. While free aflibercept is detectable in plasma 1–2 weeks after administration and does not accumulate after repeated administration every 4 weeks, bound aflibercept accumulates after repeated administration and reaches a steady state 4 weeks after the third IAI administration, that is, at week 12. The ratio of free and bound aflibercept is not constant, but decreases over time as the concentration of free aflibercept increases to Cmax at a faster rate than bound aflibercept and then decreases quickly thereafter, while bound aflibercept concentrations plateau. As such, total aflibercept concentrations (defined as the sum of free and bound aflibercept) should not be used as a surrogate for active drug concentrations (as it is often used for small molecules bound to plasma proteins that show no concentration dependence of protein binding).
Overall, systemic pharmacokinetic and pharmacodynamic parameters of aflibercept were similar across both nAMD and DME indications and consistent across the four studies included in this analysis as well as with recently published data on free aflibercept concentrations after IAI.22 Free aflibercept concentrations obtained 1 week after the first IAI administration were used to explore the potential pharmacokinetic/pharmacodynamic relationship for the pharmacologically active moiety. Although pharmacologically inactive, the relationship between bound aflibercept and potential systemic pharmacodynamic markers of VEGF inhibition at week 12 were also explored for the sake of completeness.
Based on data fromVGFT-OD-0702.PK (comparison of mean AUC values), only 3% of the total aflibercept in the plasma was related to free aflibercept. However, the ratio of free and total aflibercept concentrations in the plasma is not constant over time (figure 1), but shows a faster elimination of free versus total aflibercept. As a result, only free aflibercept is present during the first week after administration (and only measurable in half of the patients investigated); most of the time total aflibercept concentrations exclusively reflect inactive bound aflibercept. Free aflibercept exhibits non-linear pharmacokinetics consistent with saturable, target-mediated drug disposition and is predominantly cleared by relatively rapid, specific and saturable high-affinity binding to VEGF, but also via slower, non-saturable clearance mechanisms. It is thought that these latter mechanisms are proteolytic catabolism processes that affect both free and bound aflibercept. In contrast, bound aflibercept is cleared by linear proteolytic processes. Compared with free aflibercept, the slower elimination of bound aflibercept results in quantifiable concentrations of adjusted bound—and consequently total—aflibercept over a longer period of time. Quantifiable concentrations of bound aflibercept were therefore already at predose values observed in the pharmacokinetic substudy VGFT-OD-0702.PK because these patients were pretreated with IAI in VGFT-OD-0702 before entering VGFT-OD-0702.PK.
In VIEW 2, there was no accumulation of free aflibercept in plasma, suggesting that longer treatment duration is not likely to be associated with an increased risk of systemic side effects.
Notably, IVT aflibercept did not have any effect on blood pressure or kidney function in any of these studies; in addition, there was no association with regard to the systemic concentrations of free or bound aflibercept at the patient level. There were also no signals for any difference in systemic effects between age groups. This absence of any systemic pharmacodynamic effects following treatment with IAI is in line with a recent publication23 and with the understanding of the physiological role of VEGF. VEGF, a 27 kDa macromolecule, is an autocoid and thus is synthesised at its intended site of action in the vascular endothelium. Platelets sequester the majority of VEGF released into the systemic circulation and thus restrict the activity of VEGF to its site of synthesis.24 This supports the hypothesis that VEGF concentrations in plasma have no physiological relevance to any downstream processes. Furthermore, it should be considered that only free aflibercept can bind VEGF, while bound VEGF is pharmacologically inert and thereby unable to bind further VEGF. The small amount of free aflibercept that is released into the systemic circulation following IVT injection can, even at its maximum, only bind a small fraction of the VEGF produced daily by the body.25
The absence of any systemic pharmacodynamic effects is also consistent with the low number of systemic AEs, including hypertension and APTC-defined ATEs, showing no difference between aflibercept and control. These findings appear to be in line with what has previously been reported in the literature. In a comprehensive review of safety data from 10 phase II and III clinical trials (>4000 patients contributing >7000 patient-years at risk) of IAI in nAMD, macular oedema secondary to central/branch retinal vein occlusion, and DME, the incidence of systemic AEs (including adjudicated APTC-defined ATEs) was low and similar across the IAI and control groups.26
In conclusion, based on the findings presented here, and given the sensitivity of blood pressure changes and kidney function as a proxy for systemic anti-VEGF activity, there was no indication that the use of IVT aflibercept was associated with systemic effects in patients with nAMD or DME.
Acknowledgments
We thank Leigh Prevost and Albert Balkiewicz of PAREXEL for medical writing support.
References
Footnotes
Contributors All authors (PKK, LK, JFK, JW, AT, OZ, RV, CA, TZ, ATD and JH) had full access to the data in the study, contributed to the concept and design of the analysis, participated in the acquisition, analysis or interpretation of the data, drafted and provided critical revision of the manuscript for intellectual content and confirmed submission of the manuscript for publication. PKK, CA, OZ, TZ, ATD and JH contributed to and provided input to the statistical analysis. PKK and JH are responsible for the overall content as guarantors of the information presented. The sponsor Bayer was involved in study design, collection, analysis and interpretation of data, writing the report and in the decision to submit the article for publication.
Funding The publication of this article was supported by Bayer.
Competing interests PKK is a consultant to Bayer and Regeneron. LK is a principal investigator for trials sponsored by Alcon, Bayer and Novartis; has also sat on advisory boards for Alcon, Allergan, Bayer, Krys, Novartis and Théa; and has received lecture fees from Alcon, Allergan, Bayer, Novartis, Théa and Zeiss. JFK is a consultant for Alcon, Alimera, Allergan, Bayer, Boehringer Ingelheim, Novartis, Roche, Thea and Zeiss. JW is a consultant to Bayer. AT, RV and ATD are employees of Regeneron. OZ, CA, TZ and JH are employees of Bayer.
Patient consent for publication Not required.
Provenance and peer review Not commissioned; externally peer reviewed.