Article Text

Abstract
Objective To estimate the macular ganglion cell complex (GCC) asymmetry in patients with suprasellar tumours, to compare its diagnostic performance to the nasal GCC thickness and visual field (VF) and to investigate how the parameters correlate with magnetic resonance imaging (MRI) findings.
Methods and analysis Cross-sectional study of patients with suprasellar tumours affecting the optic chiasm. Macular optical coherence tomography (OCT) scans were evaluated for nasal GCC sector thinning and loss of normal GCC asymmetry between corresponding nasal-temporal sectors. Equivalently, VFs were analysed for defects compatible with chiasm dysfunction. The relationship between optic chiasm and tumour was measured on MRI.
Results Thirty-three eyes of 33 patients were included. There were OCT findings in 14 eyes. Nasal GCC thinning was found in 9 eyes and loss of GCC asymmetry in 12 eyes; the two parameters were not significantly different with respect to number of positive findings (p=0.45). Loss of GCC asymmetry, however, occurred in 5 eyes among 24 without GCC thinning (proportion 0.21; 95% confidence interval 0.071 to 0.42). In 8 eyes, VF indicated pathology; of these, 7 had concurring OCT findings. The prevalence of OCT and VF findings increased significantly with suprasellar tumour extension on MRI.
Conclusion The diagnostic capabilities of nasal GCC thinning and loss of GCC asymmetry were comparable, whilst their complementary performances increased the proportion of eyes in which OCT suggested compression. The prevalence of both OCT and VF findings grew with suprasellar tumour extension. In several cases, however, structural findings on OCT preceded detectable VF deficits.
- optical coherence tomography
- compressive optic neuropathy
- visual field
- magnetic resonance imaging
This is an open access article distributed in accordance with the Creative Commons Attribution Non Commercial (CC BY-NC 4.0) license, which permits others to distribute, remix, adapt, build upon this work non-commercially, and license their derivative works on different terms, provided the original work is properly cited, appropriate credit is given, any changes made indicated, and the use is non-commercial. See: http://creativecommons.org/licenses/by-nc/4.0/
Statistics from Altmetric.com
Key messages
What is already known about this subject?
In chiasmal compression, optical coherence tomography (OCT) can objectively detect macular ganglion cell complex (GCC) thinning in a predominant nasal arrangement, and OCT findings can even precede detectable visual field deficits.
Still, relatively wide reference ranges for normal GCC thickness might limit OCT’s ability to detect early GCC thinning.
What are the new findings?
In healthy eyes, the macular GCC is thicker in the nasal than the temporal hemisphere, constituting a horizontal GCC asymmetry.
As GCC thinning in chiasmal compression predominantly occurs nasally, it leads to loss of this asymmetry. Furthermore, as loss of GCC asymmetry merely represents nasal GCC thinning relative to the temporal hemisphere, it can be detected in cases with nasal GCC thickness within normal reference range.
Combining assessment of nasal GCC thickness and GCC asymmetry increases the proportion of eyes in which OCT suggests chiasmal compression.
How might these results change the focus of research or clinical practice?
Implementing horizontal GCC asymmetry analysis in OCT software solutions could improve OCT’s diagnostic performance in neuro-ophthalmology.
Introduction
Alleviating or preventing visual compromise is crucial in the management of pituitary region tumours; the presence of a visual field (VF) deficit due to compression of the optic pathways is considered a strong indication for surgery of non-lactotroph adenomas.1 2 Assessment of the VF with perimetry, however, relies on a subjective test, which, as any psychophysical method, is prone to low patient reliability. In addition, retinal ganglion cell (RGC) atrophy can precede VF loss.3 Thus, there is a need for a complementary test capable of objectively diagnosing even early optic neuropathy.
Optical coherence tomography (OCT) can provide objective evidence for retinal neural loss in compressive optic neuropathy, as it eventually leads to descending optic atrophy and loss of the RGCs, presenting on OCT as thinning of the inner retinal segments. In chiasmal compression, recent studies have shown that macular OCT can objectively detect ganglion cell complex (GCC) thinning in a predominant nasal arrangement.4–6 These studies typically use age-matched normative databases to identify thinning of the macular GCC. Still, relatively wide reference ranges due to interindividual variability of the normal GCC thickness might limit OCT’s ability to discriminate healthy nerves from early compressive optic neuropathy.7
In healthy eyes, the macular GCC is thicker in the nasal than the temporal hemisphere, constituting a horizontal GCC asymmetry.8 One can thus anticipate loss of this asymmetry in chiasmal compression as a consequence of the nasal thinning. Furthermore, as a decline of macular GCC asymmetry merely represents nasal GCC thinning relative to the temporal hemisphere, loss of GCC asymmetry might be possible to detect before absolute nasal GCC thinning.
The purposes of the present study were to estimate the horizontal macular GCC asymmetry in patients with suprasellar tumours, to compare its diagnostic performance to the nasal GCC thickness and VF and to investigate how the parameters correlate with MRI findings.
Materials and methods
Since 2016, patients with tumours in the pituitary gland or neighbouring structures referred to neuro-ophthalmological assessment at Oslo University Hospital have been included in a prospective registry-based study approved by the institutional data protection officer. In the present cross-sectional study, the inclusion criterion was untreated tumours from the registry with MRI evidence of tumour-chiasmal abutment or displacement. Furthermore, in accordance with our normative OCT database, only Caucasians of age≥20 years and spherical equivalent refraction in the range of −6.0 to +3.0 dioptres were included. Exclusion criteria were other ophthalmological or neurological disorders that could influence macular OCT or VF, for example, cataract, glaucoma, age-related macular degeneration, epiretinal fibrosis or demyelinating disease. Subjects with poor OCT image quality or weak VF reliability were also excluded.
OCT analyses
Macular spectral domain OCT images were obtained with a RS-3000 OCT Advance (NIDEK Co.) and its 9×9 mm Macula Map program. The image quality was ensured by only accepting scans with ‘high’ signal strength index (SSI) values (SSI≥7 out of 10) and by visually confirming correct placement of the GCC segmentation lines between the inner plexiform layer and the retinal nerve fibre layer (RNFL).
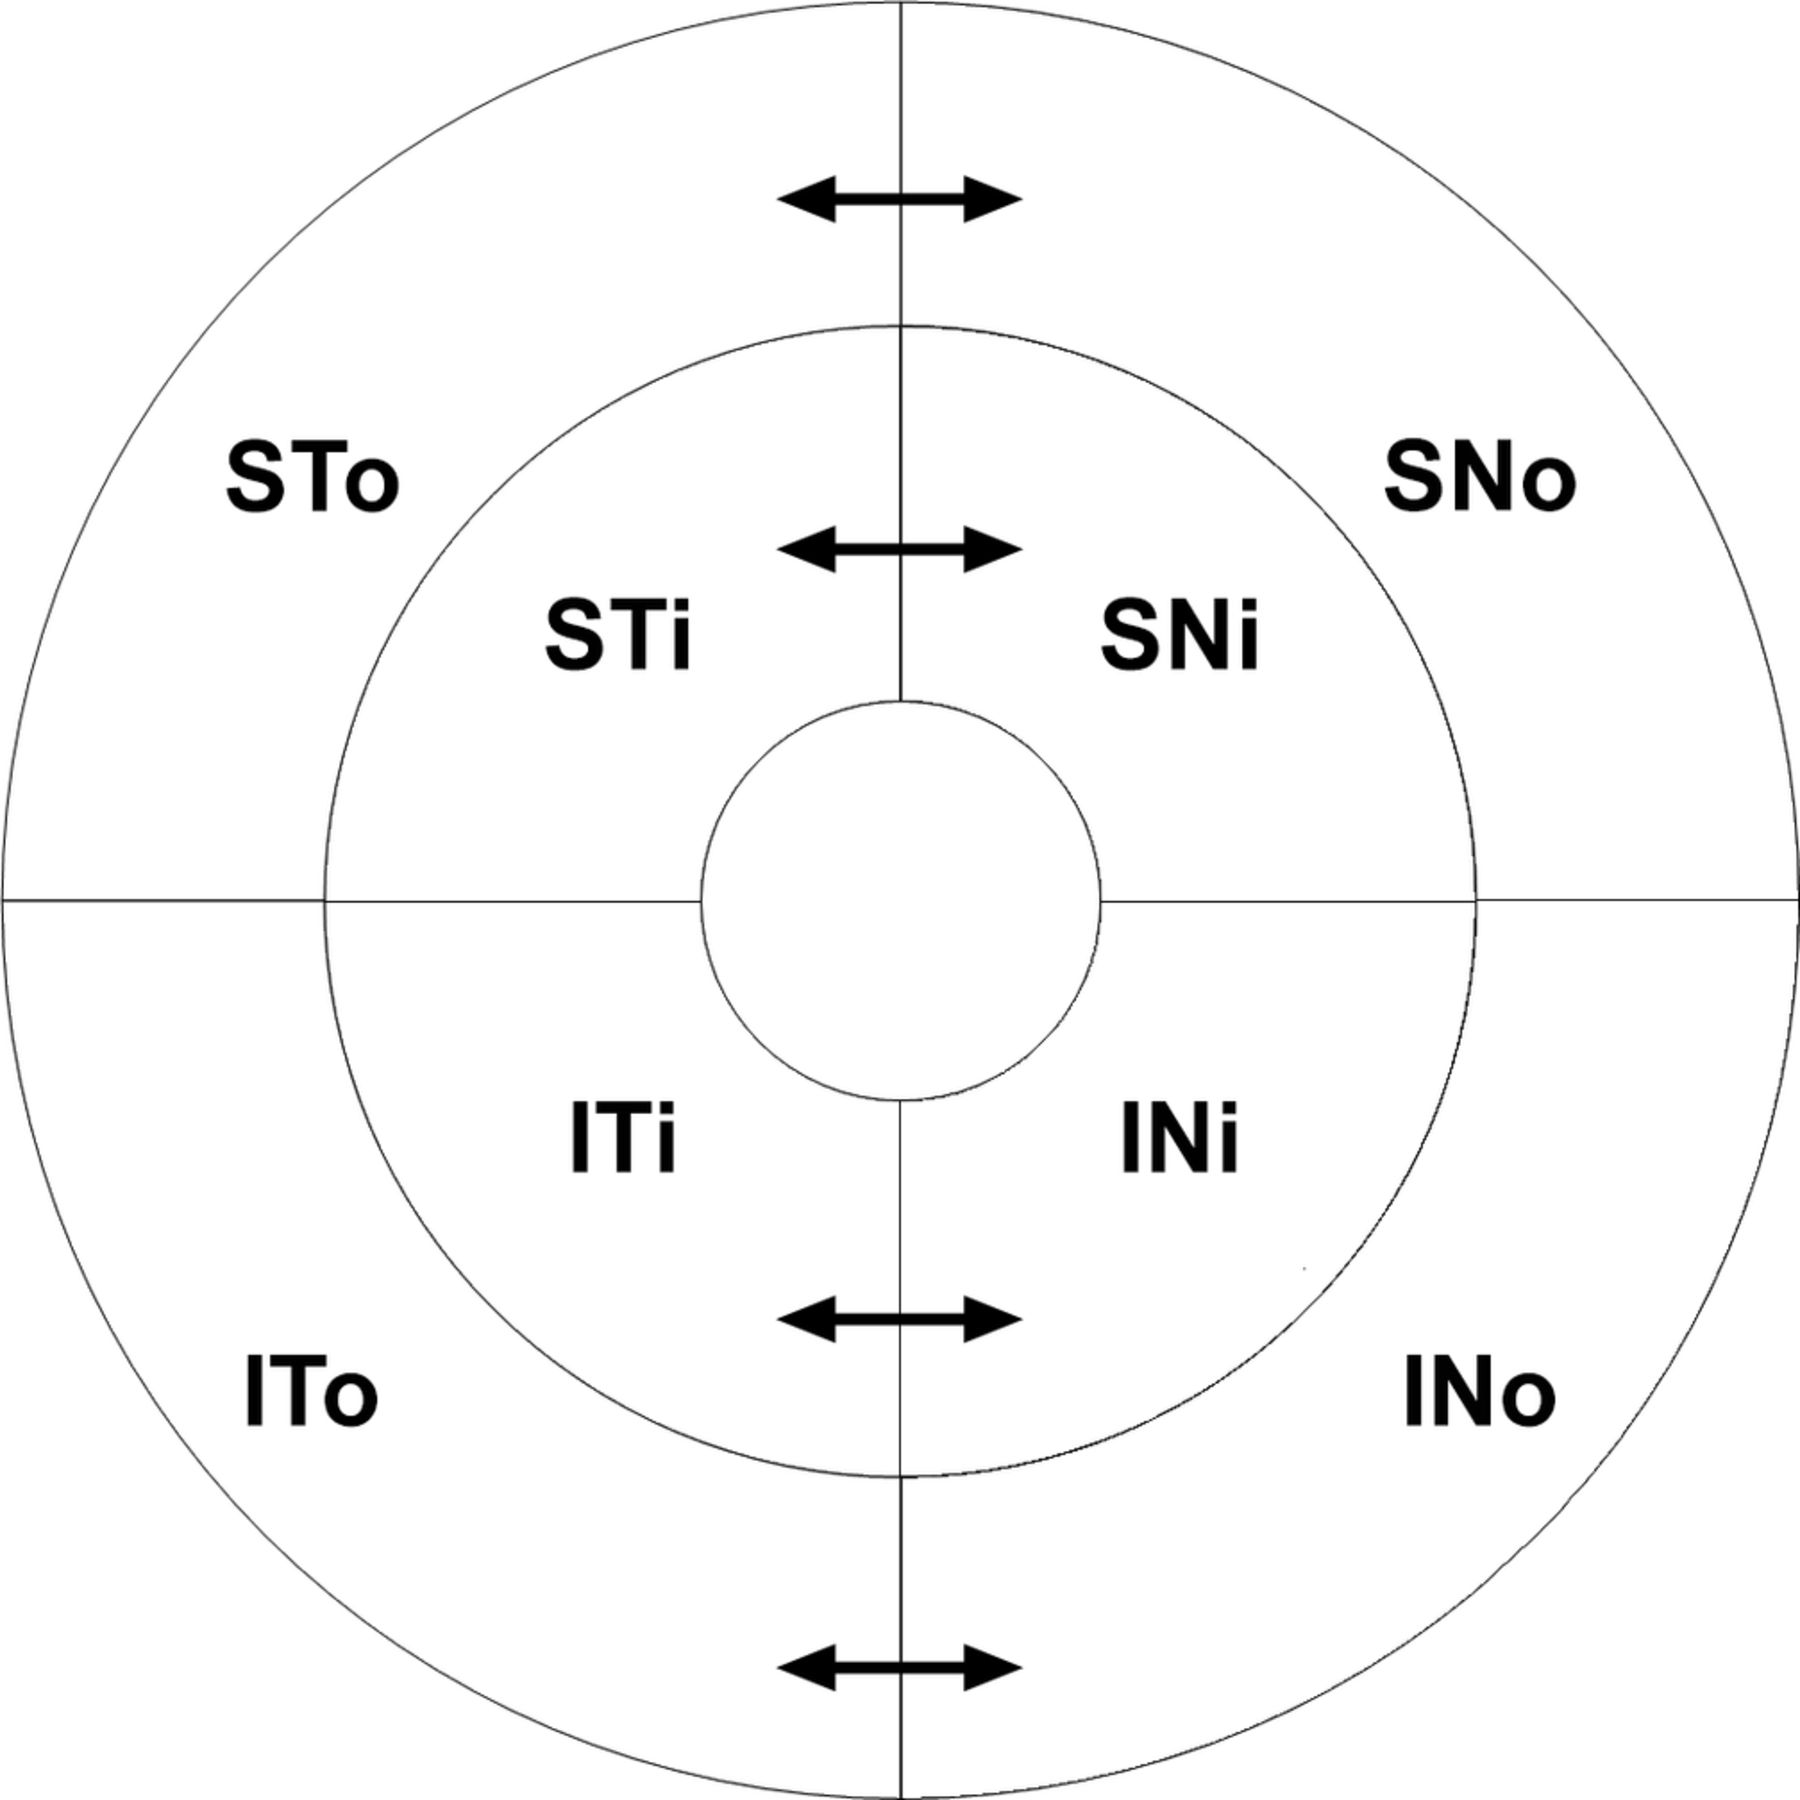
Using the Navis-EX software (NIDEK CO., LTD.), we visualised the GCC thickness as a 9×9 mm topographic image and as a circular grid with a radius of 4.5 mm divided into four inner and four outer sectors respecting the horizontal and vertical meridians. To assess the horizontal GCC asymmetry, we calculated the difference in GCC thickness between each nasal sector and its corresponding temporal sector (a total of four nasal-temporal sector pairs) (figure 1).

The macular GCC thickness visualised as a circular grid with a radius of 4.5 mm divided into four inner and four outer sectors respecting the horizontal and vertical meridians (S=superior, I=inferior, T=temporal, N=nasal, o=outer and i=inner). To assess the horizontal GCC asymmetry, we calculated the difference in GCC thickness between each nasal sector and its corresponding temporal sector (arrows): SNo–STo, SNi–STi, INi–ITi and INo–ITo. GCC, ganglion cell complex.
The OCT data were compared with a normative database of 90 healthy Caucasian subjects. In a prestudy validation of the normative database, the mean GCC thickness and horizontal GCC hemispheric asymmetry both decreased with age; coefficient of determination (r²) was 0.21 (p<0.001) and 0.35 (p<0.001). For the age groups 20–39 years, 40–59 years and 60–79 years, we therefore calculated two different sets of age-specific 95% reference ranges: one for each GCC sector thickness and one for GCC asymmetry between each of the four nasal-temporal sector pairs.
The patients’ OCT images were evaluated for nasal GCC thinning or loss of horizontal GCC asymmetry suggesting compression of the optic chiasm region. Nasal GCC thinning suggesting compression of the optic chiasm region was defined as GCC thickness in at least one of the four nasal sectors below the age-specific 95% reference range. Correspondingly, loss of horizontal GCC asymmetry suggesting compression of the optic chiasm region was defined as asymmetry in at least one of the four nasal-temporal sector pairs below the age-specific 95% reference range.
Perimetry analyses
Standard white-on-white threshold perimetry was performed by a trained perimetrist using an Octopus 900 perimeter (Haag-Streit AG). The central 30° field of vision was examined using the general (G) programme and the tendency-oriented perimetry test strategy. Enabling fixation control and only accepting a maximum of three false answers ensured good patient reliability. VF abnormality was defined as square root of loss variance>2.5 dB or mean defect>2.0 dB, representing a local or global VF defect outside the age-specific 95% reference range. Using the EyeSuite software (Haag-Streit AG), we analysed the patients’ VFs for abnormality in a pattern compatible with dysfunction of the optic chiasm region, that is, unitemporal or bitemporal defects with or without additional nasal field involvement or homonymous defects.9
The OCT and VF results were blinded and analysed independently by two separate neuro-ophthalmologists. In cases with conflicting outcomes, agreement was reached through consensus decision-making.
MRI analyses
MRI examination included≤3 mm thin T1-weighted sequences of the pituitary region in the sagittal and coronal planes before and after gadolinium contrast enhancement. We measured the maximum suprasellar tumour extension on coronal images perpendicular to a reference line drawn between the upper surfaces of the horizontal segments of the internal carotid arteries within the cavernous sinuses.10 Furthermore, the relationship between the optic chiasm and tumour on coronal images was graded from I to IV.11 Grade I indicated contact without optic chiasm deformity, that is, abutment only. Grade II indicated optic chiasm deformity and visible suprachiasmatic cistern. Grade III indicated optic chiasm deformity, invisible suprachiasmatic cistern and no cerebral deformity. Grade IV indicated cerebral deformity. The MRI images were blinded, and all images were analysed by the same neuro-radiologist.
Statistical analyses
To avoid correlated data, one eye from each subject was randomised to enrolment. In the patient group, linear regression analysis was used to explore the relationships between OCT, VF and MRI findings. A two-sided sign test was used to compare the diagnostic capabilities of nasal GCC thinning and loss of GCC asymmetry. A binomial 95% CI was used to estimate the effect of introducing loss of GCC asymmetry as complementary OCT strategy. The study database, randomisation and GCC algorithms were created in Excel 2016 (Microsoft). Significance was defined as p<0.05. The data are presented as mean (SD), median (range) or as 95% reference ranges.
Results
Fifty-four subjects in the registry fulfilled the study’s inclusion criteria. Seventeen patients were excluded due to other disorders that could influence VF or macular OCT, and 4 patients were excluded due to poor OCT image quality or weak VF reliability. Of the 33 patients (21 women and 12 men) included, the mean age was 47.2 (17.6) years. The mass lesion was an incidental finding in 14 cases; clinical presentation leading to diagnosis was headache in 10 cases, pituitary dysfunction in 5 cases and visual symptoms in 4 cases.
OCT and VF results
Typical OCT and VF findings are shown in figure 2. Fourteen of 33 eyes demonstrated OCT findings suggesting compression of the optic chiasm region. Of the 14 eyes, nasal GCC thinning was found in 9 eyes and loss of GCC asymmetry in 12 eyes. Nasal GCC thinning without loss of GCC asymmetry was found in two eyes, and loss of GCC asymmetry without nasal GCC thinning was found in five eyes. Nasal GCC thinning and loss of GCC asymmetry were not significantly different with respect to number of eyes suggesting compression of the optic chiasm region (p=0.45). Nevertheless, assessment of GCC asymmetry suggested compression of the optic chiasm region in 5 eyes among 24 eyes without GCC thinning; the 95% confidence interval for this proportion of eyes (0.21) was (0.071–0.42). For both GCC thickness and GCC asymmetry, pathological findings most frequently occurred in the inner inferior nasal sector (7 of 9 eyes) and the corresponding inner inferior nasal-temporal sector pair (8 of 12 eyes).
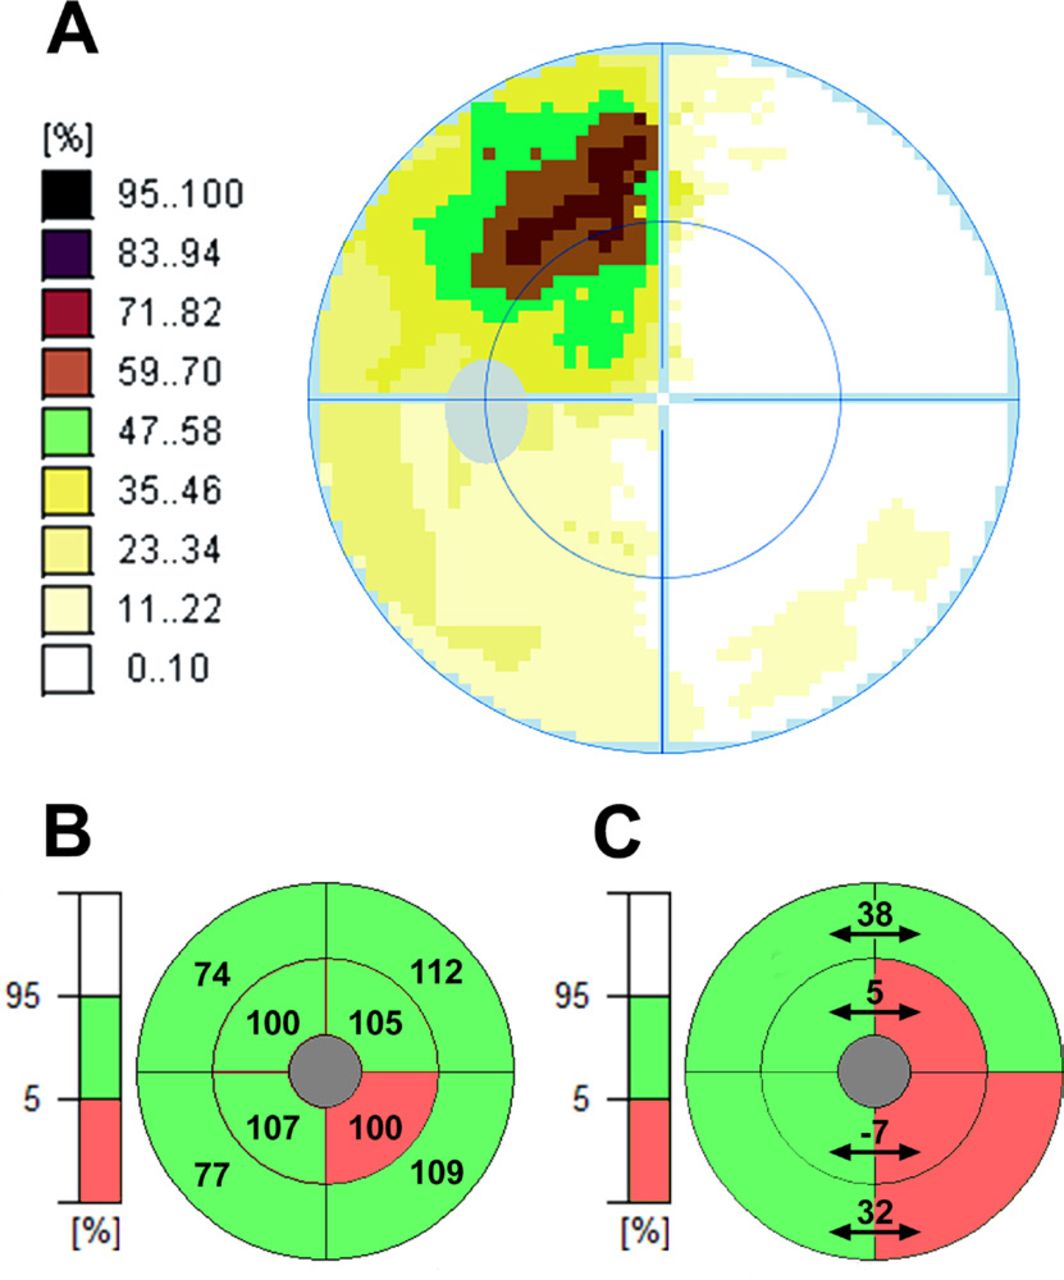
VF and macular OCT findings in the right eye of a 42-year-old patient. In this case, visual symptoms led to the diagnosis of a pituitary adenoma with a maximum suprasellar extension of 14 mm, optic chiasm deformity and an invisible suprachiasmatic cistern (optic chiasm-tumour relationship grade III). The VF (A) showed a temporal defect. Correspondingly, the OCT images revealed both nasal GCC thinning (B) and loss of horizontal GCC asymmetry (C). Both the mean GCC thickness in the inferior nasal sector and the GCC asymmetry between the inner inferior nasal-temporal sector pair were below the age-specific 95% reference ranges (103 µm to 137 µm) and (0.64 µm, 19.4 µm). Furthermore, the GCC asymmetry between the inner superior and outer inferior nasal-temporal sector pairs were below the age-specific 95% reference ranges (5.1 µm to 20.4 µm) and (33.9 µm to 57.4 µm). GCC, ganglion cell complex; OCT, optical coherence tomography; VF, visual field.
Among all 33 eyes, decreasing mean GCC thickness correlated significantly with decreasing mean hemispheric GCC asymmetry; coefficient of determination (r²) was 0.61 (p<0.001) (figure 3).

Scatter plot with line of best fit of the relationship between mean GCC thickness and mean horizontal hemispheric GCC asymmetry in the patient group. Decreasing GCC thickness correlated significantly with decreasing GCC asymmetry; coefficient of determination (r²) was 0.61 (p<0.001). GCC, ganglion cell complex.
Eight of 33 eyes demonstrated VF findings compatible with dysfunction of the optic chiasm region. Of the eight eyes, seven had concurring OCT findings suggesting compression of the optic chiasm region; one eye with a VF defect compatible with dysfunction of the optic chiasm region had preserved GCC thickness and horizontal GCC asymmetry. In all eyes, the pathological VF pattern was a temporal defect with additional nasal field involvement.
MRI results
MRI diagnosis was pituitary adenoma in 22 cases, Rathke’s cleft cyst in 4, meningioma in 2, craniopharyngioma in 2, epidermoid cyst in 1 and mixed cystic and solid mass of uncertain aetiology in 2. Of the 33 MRI examinations, 28 could be graded according to protocol; 5 tumours could not be graded accurately due to irregular surfaces. The relationships between the 28 gradable MRI images, OCT and VF findings are shown in table 1.
Relationships between MRI, OCT and VF findings in patients with tumours affecting the optic chiasm
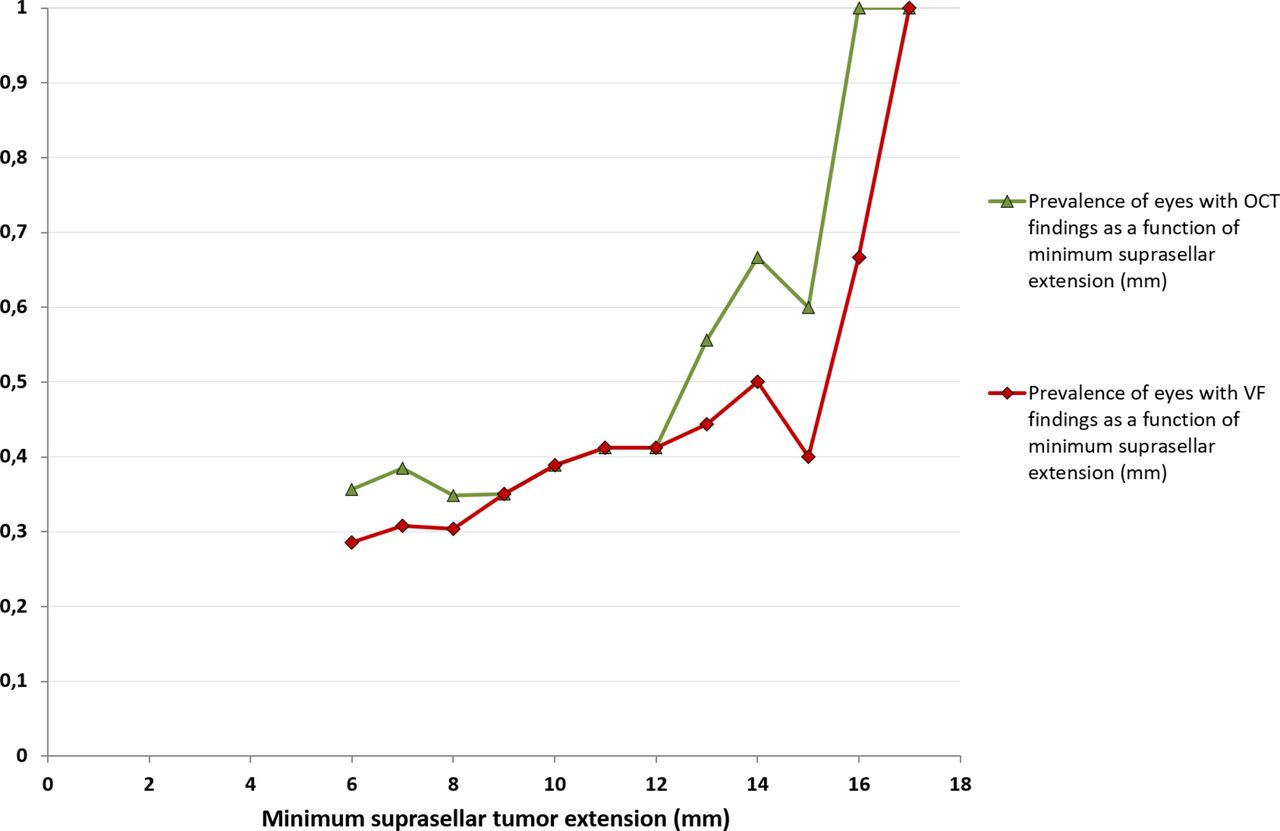
The prevalence of OCT and VF findings both correlated significantly with suprasellar tumour extension; coefficient of determination (r²) was 0.75 (p<0.001) and 0.64 (p=0.002) (figure 4).
Prevalence of eyes with OCT and VF findings suggesting optic chiasm compression as a function of minimum suprasellar tumour extension. The prevalence of OCT and VF findings both correlated significantly with suprasellar tumour extension; coefficient of determination (r²) was 0.75 (p<0.001) and 0.64 (p=0.002). OCT, optical coherence tomography; VF, visual field.
Discussion
In the present paper, we identify loss of horizontal macular GCC asymmetry as an OCT indicator of chiasmal compression. Loss of GCC asymmetry as a complementary OCT strategy increased the proportion of eyes in which OCT suggested compression of the optic chiasm region.
There is no universally accepted definition of compressive optic neuropathy. Although both functional and structural criteria can be used to define disease, the traditional gold standard method in the setting of optic chiasm compression is assessment of the visual function; perimetry has been the cornerstone of examination, whereas a structural correlate in the form of ophthalmoscopic optic nerve atrophy typically becomes evident in more advanced disease. Progress in OCT technology and image-processing techniques fundamentally change the ability to provide objective evidence of even early structural changes in compressive optic neuropathy. Equivalently, for glaucomatous optic neuropathy, current consensus is that the diagnosis of glaucoma no longer requires the detection of VF defects, as structural findings with modern imaging technology generally precede detectable functional deficits.12
In glaucoma, asymmetric findings between the superior and inferior hemispheres are well-established indicators of early disease. Such asymmetry can be demonstrated functionally with threshold perimetry and anatomically with OCT, and vertical ganglion cell asymmetry analysis is now even commercially available (Spectralis OCT, Heidelberg Engineering). On the other hand, neuro-ophthalmic diseases, including chiasmal compression, commonly respect the vertical meridian. However, to our knowledge, equivalent OCT algorithms for horizontal GCC asymmetry has not been developed or thoroughly studied.
The strong correlation between decreasing mean GCC thickness and decreasing mean hemispheric GCC asymmetry in the patient group confirmed the anticipated loss of normal horizontal GCC asymmetry in chiasmal compression. Notably, loss of GCC asymmetry co-occurred in most eyes with nasal GCC thinning but also in cases with GCC thickness within the reference ranges. While loss of GCC asymmetry in an individual patient does suggest thinning of the nasal GCC, OCT will not detect patient-specific GCC thinning within the 95% reference range. In this way, relative wide reference ranges due to interindividual variability of the normal GCC thickness limit OCT’s ability to detect early GCC thinning, especially in patients with higher initial GCC thicknesses. On the other hand, healthy individuals with thick or thin GCC might display similar asymmetry patterns, thereby minimising the effect of normal GCC thickness variability on GCC asymmetry. This may explain how OCT can demonstrate loss of GCC asymmetry without evidence of nasal thinning; the normal variability in GCC asymmetry is lower than that of each macular GCC sector per se, leading to narrower GCC asymmetry reference ranges and higher sensitivity for chiasmal syndromes.
At the same time, chiasmal syndrome manifestations are heterogeneous, and GCC thinning does not necessarily exclusively take place in the nasal hemisphere; any temporal GCC thinning will counteract loss of GCC asymmetry. Accordingly, a few eyes had nasal GCC thinning without loss of GCC asymmetry, whereas the complementary performances of the two parameters increased the proportion of eyes in which OCT suggested compression of the optic chiasm region.
One eye demonstrated a VF defects with normal OCT. As evidence implies OCT to be more sensitive than perimetry, a VF defect in the absence of GCC findings could be attributed to a false positive perimetry result. However, anatomical findings do not always, as a rule, precede functional deficits. While loss of visual function can develop rapidly (eg, traumatic optic neuropathy), OCT findings rely on a time-dependent mechanism (descending optic atrophy) to occur.13 Accordingly, within a limited time frame, isolated VF findings might also be found in cases of compressive optic neuropathy.
We found overlapping results between the two MRI grading methods: maximum suprasellar tumour extension and optic chiasm-tumour relationship. The overlap can be explained by anatomical variations in the distances between the suprasellar structures; individuals with shorter distances will reach higher grades of compression sooner in the setting of suprasellar tumour growth. When comparing the two MRI grading methods, maximum suprasellar tumour extension (in mm) seemed to predict the likelihood of clinical findings better than optic chiasm-tumour relationship (grades I–IV). Previous studies have shown a correlation between the degree of optic chiasm displacement on MRI and the likelihood of visual dysfunction, typically defined as a VF defect.10 14 15 Similarly, we found the prevalence of OCT findings to increase with suprasellar tumour extension. In particular, tumours extending≥14 mm suprasellary demonstrated a high prevalence of both VF and OCT findings. There was, however, no MRI cut-off for disease, as OCT indicated pathology in cases limited to tumour abutment. An explanation of this observation might be that MRI was unable to distinguish all cases of abutment from subtle chiasm-tumour compression. Spontaneous tumour shrinkage prior to the study examination can also have occurred. Moreover, in theory, gravitational forces on the brain could compress the optic chiasm more in the upright position, introducing a supine MRI bias. Nevertheless, although VF defects only concurred with MRI evidence of optic chiasm deformity, these OCT findings challenge the perimetry-based view that the optic chiasm is robust to dislocation and deformation.16
For non-functioning pituitary adenomas, guidelines consider the presence of a VF deficit due to compression a strong indication for surgery.1 2 An important concern in expectant management is the risk of permanent visual sequela if surgery is delayed awaiting development of a VF defect.17 Previous studies indicate that preoperative OCT findings have prognostic value; more demonstrable structural deterioration is associated with worse VF outcome.18–20 Thus, even with stable VF performances, significant changes in OCT parameters might have negative prognostic implications. As for glaucoma, an exclusively VF-based observation strategy could lead to delays in clinical decision-making; watchful waiting should necessitate close attention to both VF and OCT changes indicating disease progression.
The present study has several limitations. As we lack a better ‘gold standard’ test for comparison, false positive or negative results cannot be ruled out. There are relatively small sample sizes and tumour heterogeneity. The OCT images were only evaluated for nasal GCC thinning patterns suggesting compression of the optic chiasm region; occasional homonymous findings might present an inverted OCT pattern (temporal GCC thinning causing increased GCC asymmetry) in one eye. Finally, the GCC results were based on data as presented by the OCT software; as the macular GCC includes passing RNFL axons to peripheral RGCs, segmentation and analysis of the macular RGC layer exclusively might correspond better to localised atrophy in chiasmal compression.
In conclusion, loss of horizontal GCC asymmetry is an OCT indicator of chiasmal compression. Combining macular GCC thickness and horizontal GCC asymmetry in the clinical assessment increased the proportion of eyes in which OCT suggested compression of the optic chiasm region. The prevalence of both macular OCT and VF findings grew with suprasellar tumour extension. In several cases, however, structural findings on OCT preceded detectable VF deficits. Implementing horizontal GCC asymmetry analysis in OCT software solutions could improve OCT’s diagnostic performance in neuro-ophthalmology.
Acknowledgments
The authors would like to thank Geir Aksel Qvale, who programmed the study database and GCC algorithms, and Reza Ghiasvand and Morten Valberg, who gave statistical advice. NIDEK CO., LTD. also supported the study by providing normative data in order to determine GCC reference ranges.
References
Footnotes
Contributors ØKJ planned the study, collected and analysed the data, drafted the manuscript and submitted the study. ARW planned the study, collected and analysed the data. PBM planned the study, collected and analysed the data. MCM planned the study and analysed the data. JAE planned the study and analysed the data. All authors read and approved the final manuscript. MCM and JAE supervised the study and are its guarantors.
Funding This study was funded by Oslo University Hospital.
Competing interests None declared.
Patient consent Not required.
Ethics approval Institutional data protection officer.
Provenance and peer review Not commissioned; externally peer reviewed.
Data sharing statement No unpublished data are available.