Article Text

Abstract
Objective To evaluate dry eye disease (DED)-induced alterations in subsets of corneal antigen presenting cells (APCs) in a mouse model of experimental DED.
Methods and Analysis Seven to 8-week-old female C57BL/6 mice were housed in a controlled environment chamber and were treated with subcutaneous scopolamine to induce DED. Normal mice were used as controls. The frequencies of different subsets of dendritic cells (DCs) and macrophages in the cornea were evaluated using immunohistochemistry and flow cytometry at days 2, 7 and 14 after DED induction. Real-time PCR was used to assess the functional phenotype of macrophages in the cornea of DED mice.
Results Our results demonstrated significant corneal infiltration of CD11b+ and CD11c+ cells on days 7 and 14. Further analysis of different DC subsets revealed non-significant changes in the frequencies of total CD11b+CD11c+ cells at different time points. However, frequencies of CD11c+CD11b- DCs, CD11c+ Langerin (CD207)+ DCs and macrophages were significantly increased on both days 7 and 14 after DED induction. Real-time PCR data demonstrated increased expression of M1 macrophage markers, iNOS and TNF-α, and reduced expression of M2 macrophage markers, Arg1 and IL-10, by corneal F4/80+ macrophages at day 7.
Conclusion Although the frequencies of total CD11b+CD11c+ cells do not significantly change in the course of DED, CD11c+CD11b- DCs and Langerin+ DCs do show a significant increase. Interestingly, macrophages exhibit a predominant inflammatory M1 phenotype and suppressed anti-inflammatory M2 phenotype early after induction of DED, which are restored to near baseline levels in later stages of the disease.
- cornea
- immunology
- inflammation
This is an Open Access article distributed in accordance with the Creative Commons Attribution Non Commercial (CC BY-NC 4.0) license, which permits others to distribute, remix, adapt, build upon this work non-commercially, and license their derivative works on different terms, provided the original work is properly cited and the use is non-commercial. See: http://creativecommons.org/licenses/by-nc/4.0/
Statistics from Altmetric.com
Key messages
What is already known about this subject?
The role of antigen presenting cells (APCs) in the pathogenesis of dry eye disease (DED) has been established. However, DED-induced changes in the frequencies of different APC subtypes are not fully understood.
What are the new findings?
We demonstrate that desiccating stress leads to an increase in the frequencies of most dendritic cell (DC) and macrophage subtypes in the cornea.
Our data suggest that corneal macrophages polarise to an inflammatory M1 phenotype with a suppressed M2 phenotype soon after DED induction.
How might these results change the focus of research or clinical practice?
The results of this study provide the framework for future studies that could investigate the distinct role of different APC subtypes in the pathogenesis of DED.
Introduction
Dry eye disease (DED) is an inflammatory disorder of the ocular surface which is estimated to affect over 5 million people above the age of 50 in the United States.1 2 The immunopathogenesis of DED is not yet fully understood, but ocular surface inflammation has been shown to play a significant role in the development and progression of the disease.3 Increased levels of inflammatory cytokines, such as interleukin (IL)-1, IL-6 and tumour necrosis factor (TNF)-α in the tear fluid and epithelium of cornea and conjunctiva have been demonstrated in DED.4 5 This inflammatory milieu activates immature antigen presenting cells (APCs) in the cornea, which prime naïve T cells in the secondary lymphoid tissues, leading to the development of CD4+ T cells, such as interferon (IFN)-γ-producing Th1 and IL-17-producing Th17 cells.6–8 This ongoing cycle of pro-inflammatory cytokine production and conjunctival infiltration of effector CD4+ T cells sustains ocular surface inflammation and causes corneal epithelial damage.9 10
APCs orchestrate the immune response through their capacity to capture, process and subsequently present antigens, and play a central role in the pathogenesis of many immune-mediated disorders, including DED.3 Bone marrow (BM)-derived professional APCs include dendritic cells (DCs), macrophages and B cells. DCs are considered to be the most potent APCs, and are the key activators of the adaptive immune response to foreign antigens.11 Macrophages also interact closely with CD4+ T cells, serving as both T cell-directed phagocytes and T cell-activating APCs in DED.12 Macrophages are heterogeneous, versatile cells that present distinguishedremarkable phenotypic plasticity and functional diversity.13 14 Therefore, activated macrophages often are classified in a spectrum of polarisation states. While the classification of macrophage phenotypes has been evolving, in general two distinct states of polarised macrophages have been recognised: the classically activated (M1) macrophage phenotype and the alternatively activated (M2) macrophage phenotype.13–15 The M1 macrophages are induced by IFN-γ or microbial stimuli (lipopolysaccharide, LPS), and characterised by expression of high levels of inducible nitric oxide synthase (iNOS), pro-inflammatory and T cell polarising cytokines (IL-1β, TNF-α, IL-12 and IL-23) and chemokines (CXCL9 and CXCL10), and typically induce inflammation and tissue destruction.16 17 M2 macrophages, on the other hand, are driven by Th2 cytokines IL-4 and IL-13 and are characterised by high expression of mannose receptor (CD206) and production of IL-10, which promote resolution of inflammation, tissue remodelling and healing.16 17
Multiple studies have identified heterogeneous populations of APCs in the cornea.18–20 CD11c+CD11b+ DCs, which represent DCs of myeloid lineage, are mostly present in the anterior stroma, while CD11c-CD11b+ macrophages are mainly detected in the posterior stroma.18 19 Another distinct subtype of DCs referred to as Langerin+ DCs, are present both in corneal epithelium and stroma.20 Despite characterisation of different APC subtypes in the cornea, much less is known about alterations in the frequencies of each of these APC subsets in ocular surface inflammation, specifically in DED. The aim of this study was to investigate DED-induced changes in populations of corneal APCs, including different DC subsets and macrophages, in a mouse model of DED.
Materials and methods
Experimental animals
Seven to 8-week-old female C57BL/6 mice (Charles River Laboratories, MA) were used in the experiments. The protocol was approved by Schepens Eye Research Institute Animal Care and Use Committee, and all animals were treated according to the Association for Research in Vision and Ophthalmology (ARVO) Statement for the Use of Animals in Ophthalmic and Vision Research.
Induction of DED
DED was induced by housing mice in a controlled environment chamber (CEC) and administering scopolamine for maximal ocular surface dryness, as previously described.21–23 In brief, CEC conditions were controlled to provide a relative humidity of <25%, airflow of 10 L/min, and temperature of 20°C to 22°C for 24 hours a day. Mice were exposed to the CEC for 14 days and scopolamine hydrobromide (0.5 mg/0.2 mL) (Sigma-Aldrich, St. Louis, MO) was injected subcutaneously into mice three times per day. Untreated age- and sex-matched mice placed in the standard vivarium served as normal controls. Mice were euthanized on days 2, 7 and 14 and corneas were harvested for further analysis. To evaluate the effect of desiccating stress on the ocular surface, corneal fluorescein staining (CFS) was performed at baseline (day 0) and on days 2, 7 and 14. A 1 µL sample of 1% fluorescein (Sigma-Aldrich) was applied to the inferior-lateral conjunctival sac and fluorescein staining was examined using a slit lamp biomicroscope under cobalt blue light 3 min later. Punctate staining was evaluated in a masked fashion using the National Eye Institute grading system, giving a score of 0 to 3 to each of the five areas of the cornea.23 24
Immunohistochemical studies
For whole-mount corneal staining of APCs, four corneas from four mice (one eye) harvested on days 0, 2, 7 and 14 were fixed in acetone for 15 min and incubated with anti-FcR CD16/CD32 antibody (BD Pharmingen, San Jose, CA) for 45 min to block non-specific staining. Corneas were immunostained with primary or isotype control antibodies overnight and mounted using Vector Shield mounting medium with DAPI (4,6-diamidino-2-phenylindole; Vector Laboratories), as previously described.23 Flat-mount corneas were examined with a confocal microscope (Leica TCS SP5; Leica, Germany) at 400× magnification, and Z-stack images were taken through the whole thickness of the cornea. Antibody-reactive cells in cornea were counted in five or six areas in the periphery (0.5 µm area from the limbus) and two areas within the central 1 mm of each cornea in a masked fashion using Z-stack images. Series of multiple Z-sections were generated, which collected images from all depths of the stroma that contained antibody-reactive cells. Merging the stacked Z-sections created a single image. The number of positive cells within the merged image was manually counted in a masked fashion and the mean number of cells in each examined area was determined.
Cornea digestion and single cell preparation
Excised corneas were incubated with 20 mM EDTA at 37°C to separate the corneal epithelium, and were subsequently digested in RPMI media containing 2 mg/mL collagenase D (Roche, Indianapolis, IN) and 0.5 mg/mL DNase I (Roche) for 60 min at 37°C. The suspension was filtered through a 70 µm cell strainer (BD Falcon; Becton-Dickinson, Franklin Lakes, NJ).
Flow cytometric analysis
Cells were incubated with Fc blocking antibody in 0.5% BSA at 4°C for 30 min. Cells were then immunostained with the following antibodies: FITC-conjugated anti-CD11b, PE/Cy7-conjugated anti-CD11c, APC-conjugated anti-CD45 and PE-conjugated anti-CD207 primary antibodies, and isotype-matched control antibodies (eBioscience, San Diego, CA). Stained cells were analysed using the LSRII flow cytometer (BD Biosciences, San Jose, CA) and Summit v4.3 software (Dako Colorado, Fort Collins, CO).
Real-time PCR
Corneal macrophages were isolated from digested corneal tissues (10 corneas from five mice per group) using anti-mouse F4/80 biotin antibody (clone: REA126) and magnetic beads (anti-microbead Biotin isolation kit; Miltenyi Biotec, Belgium). Total RNA was extracted from isolated corneal macrophages using Trizol (Invitrogen, Carlsbad, CA) and the RNeasy Microkit (Qiagen, Valencia, CA). First strand cDNA was synthesised with random hexamers using SuperScript IIITM reverse transcriptase (Invitrogen), and quantitative real-time PCR was performed using Taqman PCR Mastermix and FAM dye-labelled predesigned primers (Applied Biosystems, Foster City, CA) for iNOS, TNF-α, Arg1 and IL-10. The GAPDH gene was used as the endogenous reference for each reaction. The results were analysed by the comparative threshold cycle (CT) method and the relative expression level of each sample was expressed as fold change compared with the control group.
Statistical analyses
Data are expressed as the mean±SEM of at least three separate experiments. The significance of difference between groups was analysed with a one-way ANOVA test using Prism software (version 5.0; GraphPad, San Diego, CA). A p value of <0.05 was considered statistically significant.
Results
Effect of DED on infiltration of antigen presenting cells to the cornea
Corneal fluorescein staining was performed to evaluate the severity of DED. As shown in figure 1A, corneal staining scores were significantly increased from day 2 up to day 14 after DED induction. To elucidate DED-induced changes in corneal antigen presenting cell frequencies, infiltration of CD11b+ and CD11c+ cells were evaluated on days 2, 7 and 14 after DED induction in the peripheral and central cornea. Immunofluorescence staining results demonstrated a significant increase in frequencies of CD11b+ cells at the centre and periphery of the cornea on day 7 (p<0.001) and day 14 (p<0.001) compared with non-DED mice (figure 1B). Similarly, the frequencies of CD11c+ cells demonstrated a significant increase at both the central and peripheral cornea on days 7 (p<0.05) and 14 (p<0.001) compared with non-DED controls (figure 1C).
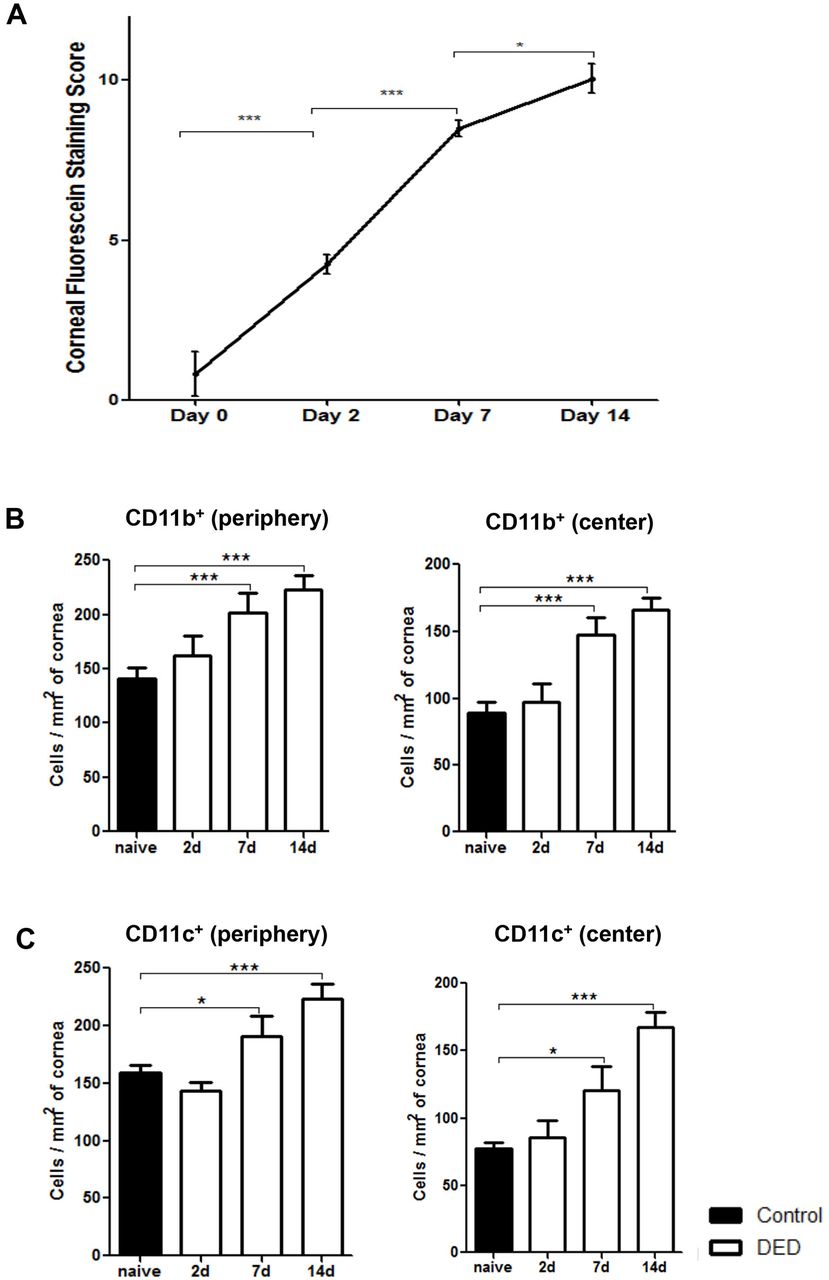
Frequencies of corneal CD11b+ cells and CD11c+ cells increase in the course of dry eye disease (DED). (A) DED was induced in the controlled environment chamber (CEC) by subcutaneous administration of scopolamine to maximise ocular dryness. Corneal fluorescein staining scores were significantly increased on days 2, 7 and 14. Data are presented as the mean±SEM of three independent experiments. Each experiment consisted of six animals per group. Dry eye induction led to significantly increased frequencies of (B) CD11b+ cells and (C) CD11c+ cells in the periphery and centre of corneal stroma on days 7 and 14. Data are presented as the mean±SEM of three independent experiments, involving three to four corneas per group (*p<0.05, **p<0.01, ***p<0.001).
DED-induced alterations in the frequencies of different DC subtypes
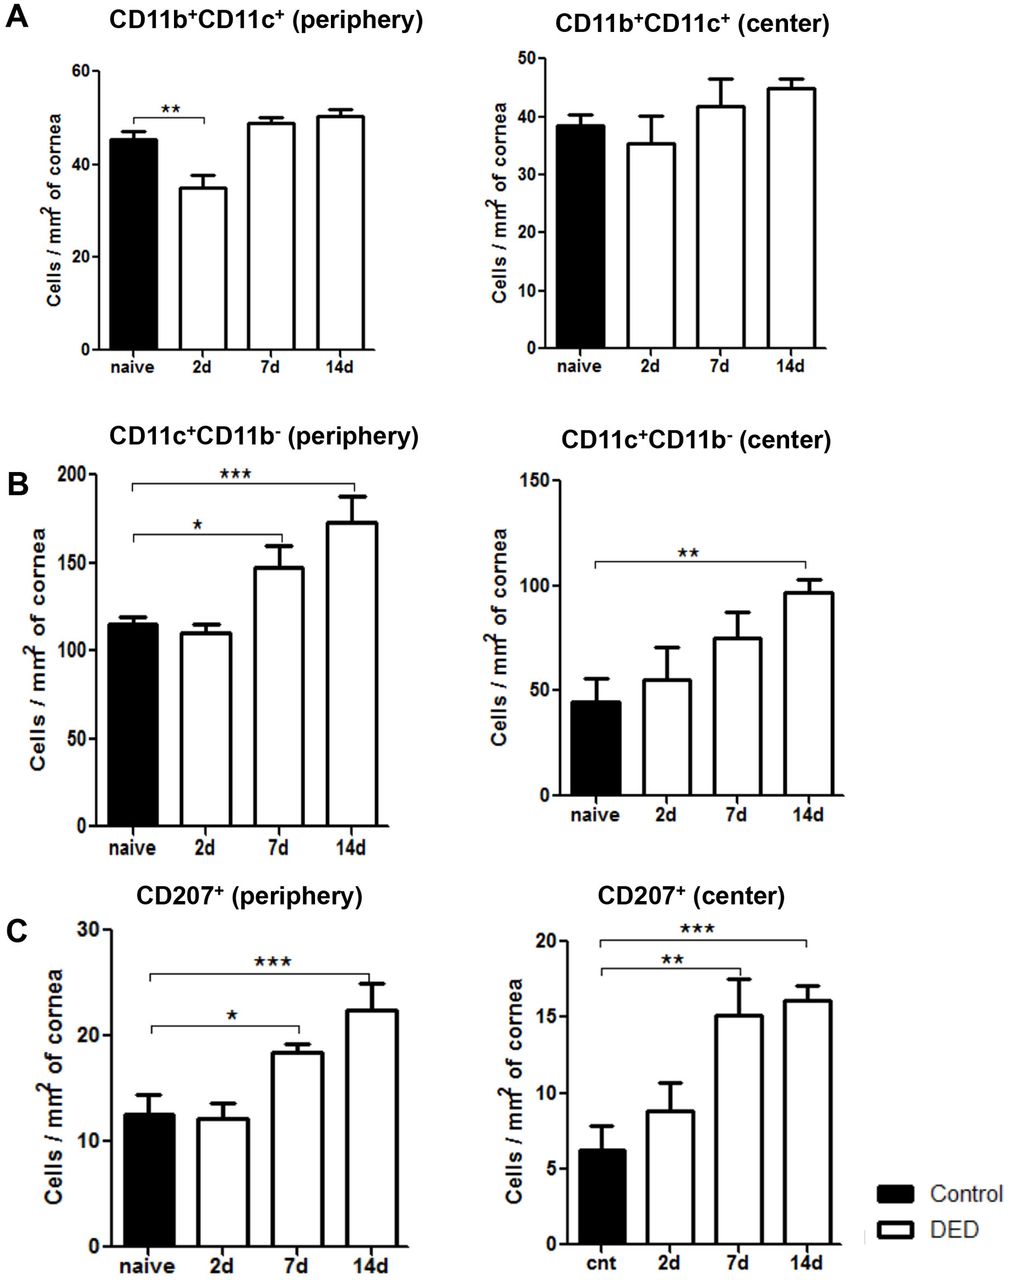
To further investigate the effect of DED on corneal DC populations, we investigated the frequencies of different DC subtypes, including CD11c+CD11b- conventional DCs, CD11c+CD11b+myeloid DCs, and CD11c+CD207 (Langerin)+ DCs at baseline, and on days 2, 7 and 14 after DED induction using flow cytometry (figure 2) and immunohistochemistry (figure 3). Our results demonstrated that the frequencies of CD11b+CD11c+ monocytic DCs were significantly decreased on day 2 after DED induction in the periphery of the cornea (p<0.01), but not in the central cornea (figure 3A). However, the population of monocytic DCs was restored back to near baseline levels on days 7 and 14 in both the central and peripheral cornea (figure 3A). The frequencies of CD11b-CD11c+ conventional DCs were significantly increased in the peripheral cornea on day 7 (p<0.05) and in the central and peripheral cornea on day 14 (p<0.01 and p<0.001, respectively) (figure 3B). Additionally, the population of CD11c+CD207 (Langerin)+ DCs demonstrated a progressive increase in both the periphery and centre of the cornea on day 7 (p<0.05 and p<0.01, respectively) and day 14 (p<0.001) (figure 3C). These results collectively indicate that most DC subsets, except for CD11b+CD11c+ monocytic DCs, show increased frequencies starting from day 7 after induction of DED and can be detected in both central and peripheral parts of the cornea.

Representative flow cytometric plots showing different populations of dendritic cells and macrophages in the corneal stroma of mice with dry eye disease (DED) at baseline and on days 2, 7 and 14 after DED induction. Representative flow cytometry data are derived from three independent experiments with pooled corneal stromal cells from three to four mice at each time point.

Frequencies of CD11c+CD11b- DCs and Langerin+ DCs progressively increase in the cornea of mice with dry eye disease (DED). Representative bar charts demonstrating quantitative immunohistochemistry data on the frequencies of (A) CD11b+CD11c+ DCs, (B) CD11c+CD11b- DCs and (C) CD11c+CD207 (Langerin)+ DCs in the periphery and centre of cornea at baseline and on days 2, 7 and 14 after DED induction. Data are presented as the mean±SEM of three or four independent experiments involving three to four corneas per group (*p<0.05, **p<0.01, ***p<0.001).
Corneal macrophage frequencies and phenotypic change during the course of DED
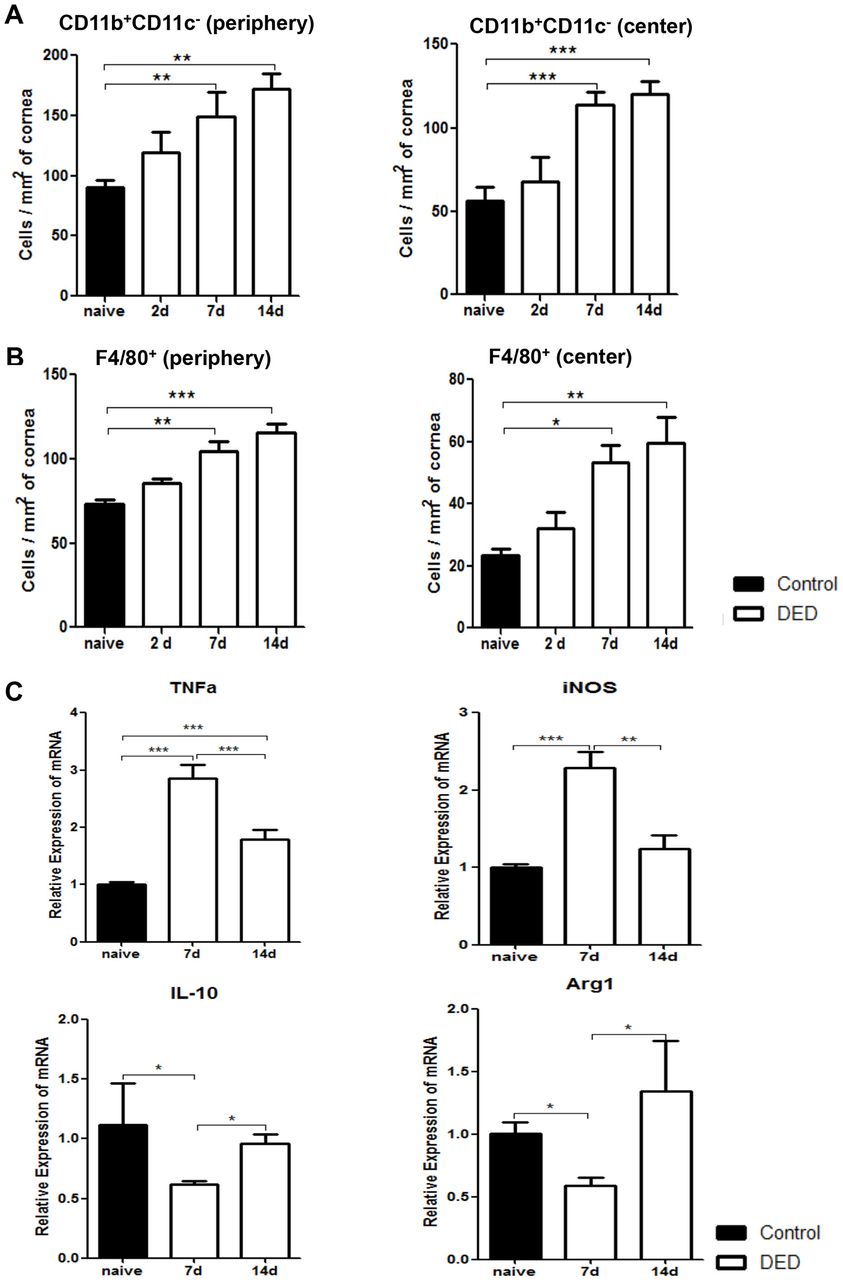
We next investigated DED-induced changes in corneal macrophage populations by analysing the frequencies of both CD11b+CD11c- cells and F4/80+ cells. Our quantified immunohistochemistry data demonstrated that the frequencies of CD11b+CD11c- cells progressively increased on both days 7 and 14 after DED induction in peripheral and central cornea (p<0.01) (figure 4A). Similarly, the frequencies of peripheral F4/80+ cells significantly increased on day 7 and 14 in the cornea of DED mice compared with normal controls (p<0.05 and p<0.01, respectively) (figure 4B). To further elucidate whether DED alters the phenotype of macrophages, expression of M1 macrophage markers TNF-α and inducible nitric oxide synthase (iNOS), and M2 macrophage markers IL-10 and arginase-1 (Arg1) were assessed in F4/80+ cells isolated from the cornea of DED mice using real-time PCR. Our data demonstrated that the expression of both TNF-α and iNOS increased significantly on day 7 (p<0.001). However, the expression of these inflammatory cytokines was significantly decreased on day 14 (p<0.001 and p<0.01, respectively) (figure 4C). Concurrently, expression of IL-10 and Arg1 decreased significantly on day 7 (p<0.05), but returned to near baseline values on day 14 (figure 4C). These data suggest that in the acute phase of DED, infiltrating macrophages demonstrate a predominant M1 or inflammatory phenotype, while M2 or anti-inflammatory macrophages significantly decrease in number. However, as the disease progresses, the M1 phenotype is suppressed while the M2 phenotype is restored to near baseline levels.

Corneal macrophages increase in number and polarise to an inflammatory phenotype early after induction of dry eye disease (DED). Representative bar charts demonstrating quantitative immunohistochemistry data on the frequencies of CD11b+CD11c- cells (A) and F4/80+ macrophages (B) in the periphery and centre of cornea at baseline and on days 2, 7 and 14 after DED induction. (C) Relative mRNA expression of M1 macrophage markers (TNF-α and iNOS) and M2 macrophage markers (IL-10 and Arg1) by magnetic bead sorted (MACS) F4/80+ corneal macrophages at baseline and on days 7 and 14 after DED induction (n=10 corneas per group). Data are presented as the mean±SEM of four independent experiments each consisting of 10 corneas per group (*p<0.05, **p<0.01, ***p<0.001).
Discussion
In addition to epithelial cells, keratocytes and endothelial cells, a morphologically heterogeneous population of APCs reside in the healthy cornea.18–20 These cells are thought to be the primary sentinels of the immune system; they also play a critical role in inducing and regulating T cell-mediated responses against a variety of foreign antigens. DCs, the most potent APCs, are the major interface between the innate and adaptive immune systems. These cells efficiently capture, internalise and process antigens and present them along with major histocompatibility complex (MHC) class II molecules to antigen-specific T cells in a CCR7-mediated fashion.25–27 During inflammation, immature stromal and epithelial resident DCs alter their phenotype to that of mature DCs with high expression levels of MHC class II and co-stimulatory molecules CD80 and CD86, and demonstrate augmented capacity in activating T cells.19 23 27 28
In the present study, we investigated the kinetics of distribution of DCs and macrophages in DED using a well-established mouse model of experimental DED. To our knowledge, this study is the first to describe dry eye-induced changes in the frequencies of different DC and macrophage subsets. Our results demonstrate significantly increased frequencies of CD11b+ and CD11c+ cells at the central and peripheral cornea at days 7 and 14 after DED induction. These results are in line with our previous observations regarding significant corneal infiltration of CD11b+ cells in DED and its relative correlation with the severity of the disease.23 Further analysis of different DC subtypes revealed non-significant changes in the total frequencies of CD11b+CD11c+ DCs in the dry eye cornea at different time points after DED induction, although we did note a significant increase in the frequencies of Langerin+ DCs, which are mostly positive for CD11b. Hamrah et al have described the presence of CD11b+CD11c+ DCs in the anterior third of the corneal stroma.18 These myeloid DCs demonstrate a more mature phenotype in the periphery of the cornea and are positive for MHC class II and co-stimulatory markers CD80, CD86 and CD40.19 Our flow cytometric analysis of CD11c+ cells revealed a prominent population of CD11b-CD11c+ DCs in the cornea, phenotypically representative of conventional DCs. This population of CD11b-CD11c+ DCs increases significantly in number on days 7 and 14 after DED induction in the cornea. Additionally, the population of CD11c+CD207 (Langerin)+ cells is also increased in the periphery and centre of corneal stroma of dry eye mice at day 7. Studies have shown corneal stroma to be endowed with a population of (non-Langerhans cell) Langerin+ DCs distinct from Langerhans cells (LCs) in the epithelium.20 Langerin is a c-type lectin expressed by specific dendritic cell (DC) populations, which was originally thought to be expressed exclusively by LCs, a subset of DCs identified in the epidermis that are recognised by the expression of HLA-DR and CD1a and presence of Birbeck granules.29 30 Recently, however, other CD11c+ populations distinct from LCs have been found to express Langerin.20 These Langerin+ (non-LC) DCs have been recognised for their efficiency in cross-presentation of antigens through major histocompatibility complex (MHC) class I molecules and are believed to play a central role in host defence against viral infections.31 Dermal LCs and Langerin+ DCs demonstrate differential roles in promoting T cell responses; while dermal LCs have been found to drive the development of Th17 cells, Langerin+ DCs have been shown to promote Th1 responses while simultaneously inhibiting the development of Th17 cells.32
Certain macrophages are remarkably plastic in altering their functional profile in response to changes in their microenvironment.17 Our results demonstrate a considerable increase in infiltration of macrophages to the cornea after exposure to desiccating stress. Moreover, we observed increased expressions of TNF-α and iNOS by corneal macrophages at day 7, accompanied by a decrease in expression of IL-10 and Arg1. These results indicate the polarisation of macrophages to an M1 inflammatory phenotype concomitant with a suppressed M2 anti-inflammatory phenotype in the more acute phases of DED. Changes in the phenotype of macrophages could be due to expression of pro-inflammatory cytokines and induction of Th1 responses in response to acute desiccating stress, which shift macrophages towards an M1 phenotype.9 M1 macrophages express pro-inflammatory cytokines, such as IL-6 and IL-23 that are highly implicated in the development of Th17 cells and pathogenesis of DED.33 M2 macrophages, on the other hand, produce high levels of IL-10 and play a central role in tissue remodelling and attenuation of inflammatory response.34
In summary, we present herein evidence that the frequencies of most DC subsets and macrophages significantly increase after exposure of mice to desiccating stress. The distinct function of these different APC subsets in the pathogenesis of DED remains to be determined. In addition, our study suggests that exposure to desiccating environmental conditions skews macrophage polarisation towards an inflammatory phenotype. Better understanding of immunological functions of distinct DC and macrophage subtypes could provide the framework for the development of novel therapeutic modalities to suppress ocular surface inflammation in DED.
References
Footnotes
Acknowledgements The authors would like to thank Dr. Daniel R. Saban (PhD) for his technical help with flow cytometry and critical review of the manuscript.
Contributors HSL performed the experiments, analyzed the data and wrote the paper. AA analyzed the data and wrote the paper. RD designed the study, analyzed the data and approved the final version of the manuscript.
Funding This study was supported by the National Institutes of Health/National Eye Institute Grant R01EY20889 (RD) and the National Eye Institute Core grant P30EY003790 (Schepens Eye Research Institute).
Competing interests None declared.
Patient consent Study does not involve human subjects.
Provenance and peer review Commissioned; externally peer reviewed.