Article Text

Abstract
Objective: The 97.5th percentile for vertical cup to disc ratio (VCDR) has been proposed as a useful tool to assist in the diagnosis of glaucoma in population studies. Previous reports of VCDR percentiles have either not been adjusted for disc size or have been calculated by regression analysis from small hospital based cohorts. The authors’ aim was to generate VCDR percentiles in a large, population based sample.
Methods: Data were collected from 3654 individuals, aged 49 years or older, living in the Blue Mountains, west of Sydney. Vertical disc diameter and VCDR were determined by planimetry from stereo optic disc photographs. The distribution of VCDR and percentiles (95th, 97.5th, 99th) were calculated.
Results: 6678 eyes were included in the analysis. Median cup to disc ratio, 95th, 97.5th, and 99th percentile increased with vertical optic disc diameter in a linear fashion. An increase of 0.2 in median VCDR (0.35 to 0.55) was observed between small (1.1–1.3 mm) and large (1.8–2.0 mm) optic discs. An equivalent increase of 0.2 (0.59 to 0.74) was observed for the 97.5th percentile from small to large discs.
Conclusion: VCDR percentiles for a “normal” population, adjusted for vertical optic disc diameter are presented. One quarter of all discs fell within the small or large disc categories highlighting the importance for estimating optic disc size. These data may assist in the diagnosis of glaucoma in clinical practice as well as providing a normative database. Sole use of VCDR percentile cut offs in defining glaucoma cases in population surveys requires further validation.
- cup to disc ratio
- percentiles
- glaucoma
- optic nerve
- Blue Mountains Eye Study
- VCDR, vertical cup to disc ratio
- VDD, vertical disc diameter
- cup to disc ratio
- percentiles
- glaucoma
- optic nerve
- Blue Mountains Eye Study
- VCDR, vertical cup to disc ratio
- VDD, vertical disc diameter
Statistics from Altmetric.com
- cup to disc ratio
- percentiles
- glaucoma
- optic nerve
- Blue Mountains Eye Study
- VCDR, vertical cup to disc ratio
- VDD, vertical disc diameter
- cup to disc ratio
- percentiles
- glaucoma
- optic nerve
- Blue Mountains Eye Study
- VCDR, vertical cup to disc ratio
- VDD, vertical disc diameter
Vertical elongation of the optic cup is a characteristic feature of glaucomatous optic neuropathy. The vertical cup to disc ratio (VCDR) is a simple, robust indicator of glaucomatous loss of the neuroretinal rim1 Unlike other measures of optic nerve morphology, such as rim area, clinical estimations of the VCDR are commonly made by most ophthalmologists and do not require multiple measurements or additional imaging equipment. However, the VCDR as a single measure has limited value in the identification of glaucomatous discs. This is because of a large variation within normal populations,2 as well as significant overlap in VCDR between normal and glaucomatous eyes.
Foster et al recently proposed a scheme designed to identify glaucoma cases for population based prevalence surveys.1 This scheme defines glaucoma on the basis of structural and functional defects of the optic nerve. The highest level of evidence for glaucoma is fulfilled when an optic disc falls outside the 97.5th percentile for VCDR and/or VCDR asymmetry, or has a rim width (between the 11 to 1 o’clock and 5 to 7 o’clock positions) reduced to <0.1, combined with a definite visual field defect consistent with glaucoma. The second level of evidence was sought in cases where subjects were unable to perform reliable visual field tests but had optic discs that fell outside the 99.5th percentile for VCDR and VCDR asymmetry.
These definitions require data describing the distribution of VCDR for the population under investigation. Previously published figures describing VCDR have either not adjusted for disc size or were estimated by regression analysis from small hospital based cohorts. Our previous report documented the relation between VCDR and disc size and showed that cup to disc ratios have a near normal distribution.3 In this study, we aim to describe the 95th, 97.5th, and 99th percentiles for VCDR in a large population based cohort.
METHODS
Study design
The Blue Mountains Eye Study is a population based survey of common eye diseases in individuals 49 years of age or older living in the Blue Mountains west of Sydney (NSW, Australia). The survey methods and protocols have been described in detail previously.4 The data used in this study were derived from baseline eye exams performed between 1992 and 1994 on 3654 individuals (82.4%) of the eligible population. The Western Sydney Area Health Service approved the study and written consent was obtained for all participants.
A comprehensive eye examination was performed including Goldmann applanation tonometry (Haag-Streit, Bern, Switzerland) and dilated 30° colour stereo-optic disc photographs, taken using a Zeiss FF3 fundus camera (Carl Zeiss, Oberkochen, Germany).
Visual field assessment
Visual field assessment was performed in two phases. Initially, a central 30° suprathreshold screening test was performed using the Humphrey 76 point test algorithm (Humphrey Visual Field Analyzer 630 with Statpac 2, Humphrey Instruments, Inc, San Leandro, CA, USA). In the second phase, a subset of participants defined as glaucoma suspects returned for full threshold Humphrey 30-2 tests, as well as gonioscopy and repeat tonometry. Glaucoma suspects included patients with a history of glaucoma or ocular hypertension, a hemifield difference of five points or more on the 76 point suprathreshold test, and optic disc signs suggestive of glaucoma (VCDR ⩾0.7, VCDR asymmetry ⩾0.3, rim thinning, or visible nerve fibre layer defects).5
All 30-2 fields were assessed by the study ophthalmologist (PM) in a masked fashion as previously described.4 Visual field abnormalities were considered glaucomatous if the Humphrey glaucoma hemifield test was abnormal, together with one or more characteristic patterns of field loss, which could not be ascribed to other ocular or neurological causes.4
Optic disc photographs and grading
The estimation of VCDR and vertical disc diameter in this study has been described in detail.4 Optic disc transparencies were mounted in clear plastic sheets and examined with a Donaldson stereo viewer (USA). The longest vertical diameter of the optic disc (inner limit of the scleral ring) was measured to the nearest 0.01 mm, using a template of small circles (Pickett small circles number 1203, USA), which was placed under the stereo pair. The optic cup was determined by contour with the outer margin taken to be the point where the wall met the plane of the disc surface at the level of the scleral ring. Optic disc measurements were corrected according to spherical equivalent refraction as previously described.3,5 All photographs were graded by one of two trained graders. The chief investigator (PM) adjudicated discrepancies. The interobserver and intraobserver variability for a random sample of 100 optic discs assessed in a masked fashion has been reported and was in excellent agreement range.
Diagnosis of open angle glaucoma
Open angle glaucoma was diagnosed in eyes with typical glaucomatous visual field loss combined with matching optic disc rim thinning and an enlarged VCDR (usually ⩾0.7) or cup to disc assymetry between the two eyes of ⩾0.3.4 Visual field tests and optic disc photographs were assessed in a masked fashion by a panel including glaucoma specialists and chief investigators from other population based eye surveys in Australia. Consensus was required for the diagnosis of glaucoma.4
Statistcal analysis
Linear regression equations were generated for the relation between vertical disc diameter (VDD) and VCDR and percentile values were calculated with Statistical Analysis System (SAS Institute Inc, Cary, NC, USA) software.
Results
The Blue Mountains Study population consists of a predominantly white population of 3654 participants. A total of 7304 eyes were initially considered for analysis. Gradable optic disc photographs were obtained for both eyes in 97.5% of participants and in at least one eye for 98% of eyes. Overall, data were incomplete for 204 (2.8%) eyes, which were not included in the analysis. The distribution of eyes in each exclusion category is shown in table 1. The method used in this study to calculate optic disc size was based on the spherical equivalent refraction using the same set up and magnification correction as that described previously.3,6 As this is altered by cataract surgery, pseudophakic and aphakic eyes (n = 302) were also excluded from the dataset. In addition, a further 71 eyes with tilted optic discs and 12 eyes with other disc anomalies were excluded (table 2). Detailed diagnositc criteria for diagnosing tilted discs have been published previously.6 This provided a data set of 6678 eyes, which were included in the analysis. Of these eyes 120 (1.8%) were defined as having glaucoma. Fellow eyes of individuals with unilateral glaucoma were not excluded. In light of concordance between the two eyes of any individual, percentile values and regression lines for percentile values were also calculated for all eligible right eyes. A total of 3323 right eyes were used for calculation of percentile values; of these, 54 eyes had a diagnosis of glaucoma. The main analysis performed in this study was performed on a “normal” population which excluded eyes with glaucoma.
Distribution of eyes by exclusion categories
Anomalous discs excluded from the dataset
Vertical disc diameter
Optic discs were grouped to the nearest 0.1 mm for analysis. The number of eyes for each disc diameter increment is shown in figure 1. The median vertical optic disc diameter for non-glaucomatous discs was 1.50 mm (population range 0.55–2.68 mm); 98.9% of discs had vertical disc diameters between 1.2–1.9 mm. Percentiles were not calculated outside the stated range because of the relatively small number of eyes.
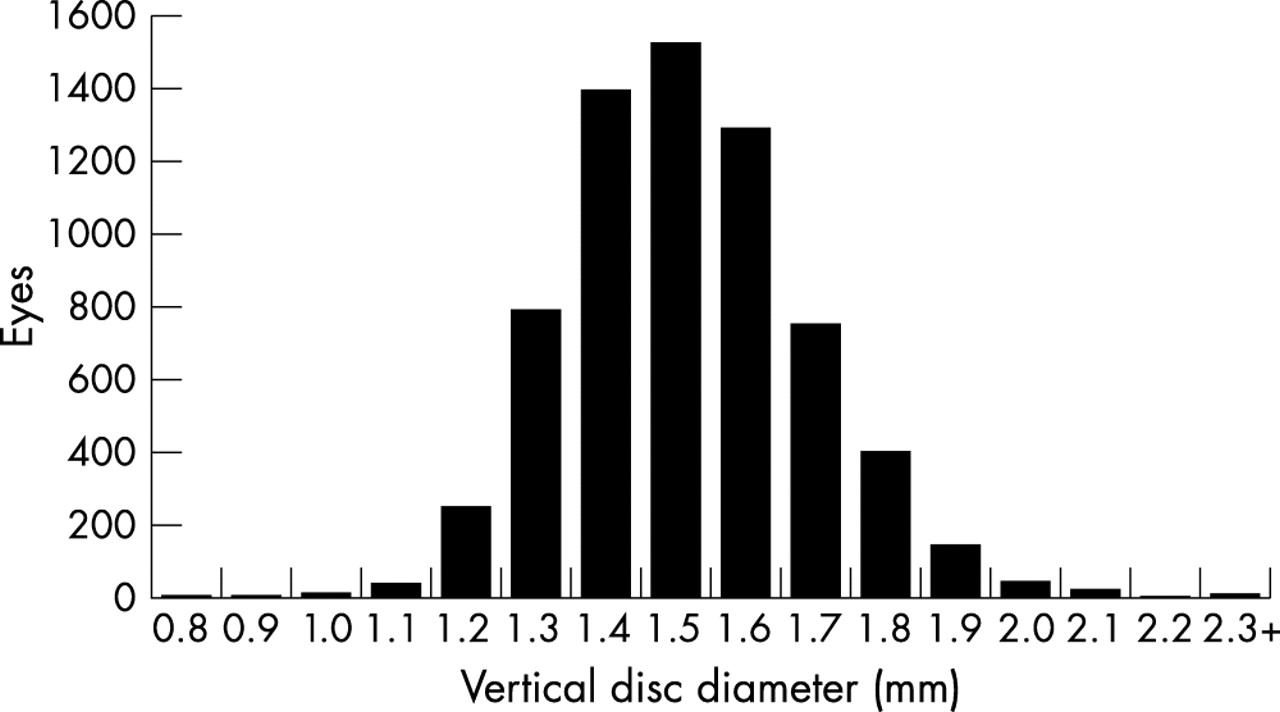
Distribution of vertical optic disc diameters for eyes included in the analysis (Blue Mountains Eye Study).
Vertical optic cup diameter and vertical cup to disc ratio
A wide range of vertical optic cup diameters was observed across the non-glaucomatous discs (median 0.63 mm, range 0.09–1.88 mm) (fig 2). The median vertical cup to disc ratio (VCDR) was 0.43 (range 0.07 to 0.84). Percentile values for VCDR for the whole population are shown in table 3 and figure 3. A linear relation between median VCDR and VDD was observed, with the following regression equation: VCDR = 0.33×VDD−0.069. The median VCDR increased from 0.33 for 1.2 mm optic discs to 0.55 for 1.9 mm optic discs (table 4).
Percentile values of VCDR for the whole population (non size adjusted)
Percentile values of VCDR adjusted for increments in VDD

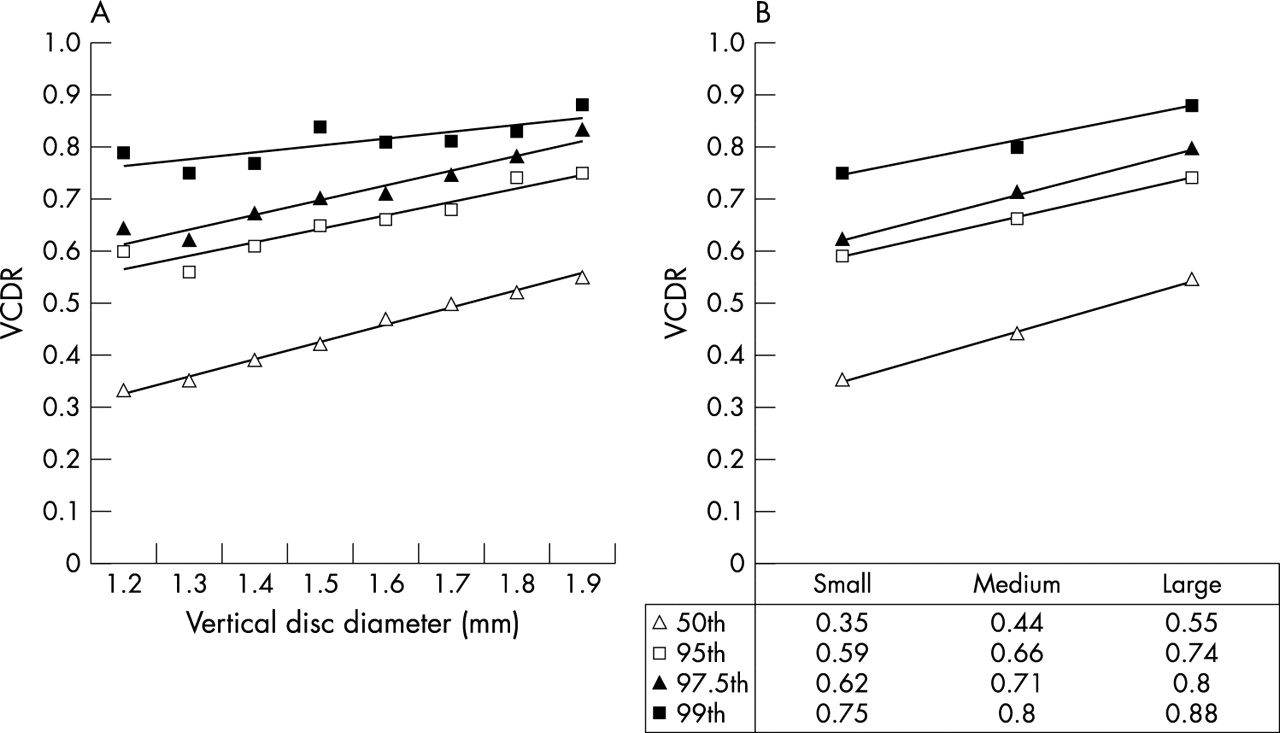
Percentiles for VCDR in non-glaucomatous eyes for increments in vertical disc diameter (A) and grouped data (B).
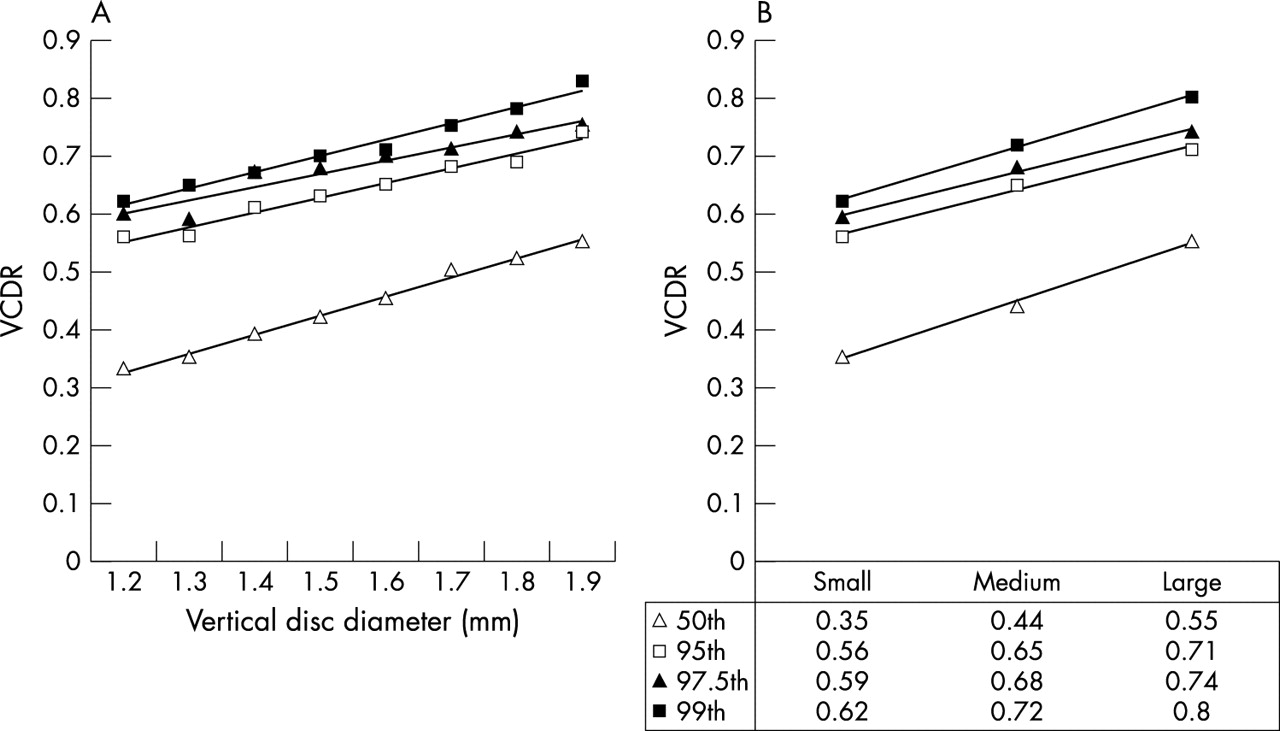
Percentiles for VCDR including glaucomatous eyes for increments in vertical disc diameters (A) and grouped data (B).
Percentiles for VCDR
The 95th, 97.5th, and 99th percentiles showed a linear relation to vertical optic disc diameter (table 4). The trend line for each percentile is expressed by the following linear regression equations:


The r2 coefficients of determination for each line were 0.97, 0.92, and 0.95, respectively, showing close approximation between the regression line and the actual data points. The 97.5th percentile increased from 0.6 for 1.2 mm optic discs to 0.75 for 1.9 mm optic discs, and from 0.62 to 0.83 for the 99th percentile. The median optic disc in this population had a vertical disc diameter of 1.5 mm, the non-size adjusted 97.5 and 99th percentiles for the whole population were 0.68 and 0.73, respectively.
Grouped data
To facilitate use of these data in clinical practice, optic discs were arbitarily reclassified as small (1.1–1.3 mm), medium (1.4–1.7 mm), or large (1.8–2.0 mm). The median and percentile values increased linearly with increasing optic disc size. An increase of 0.2 in median VCDR (from 0.35 to 0.55) was observed between small and large optic discs. Similarly, the 97.5th and 99th percentiles increased by 0.15 and 0.18, respectively, between small and large optic discs.
Inclusion of glaucomatous eyes
Glaucomatous eyes were included in the data analysis to determine whether this led to a clinically significant change in percentile values. Inclusion had minimal effect on the median values for any optic disc diameter (range 0 to 0.02). It resulted in a modest increase in the 95th (range 0 to 0.05) and 97.5th percentiles (range 0 to 0.08) and a larger increase in the 99th percentiles (range 0.04 to 0.17). Inclusion of glaucomatous optic discs in the analysis had more effect on the percentile values for smaller than for larger optic discs. The mean increase in the 99th percentile for optic discs ⩽1.5 mm was 0.13 but was only 0.06 for optic discs ⩾1.6 mm.
Analysis of right eye data
In light of the potential for concordance between the VCDR of the two eyes of any given individual, these values are not independent. This may have the effect of inflating associations and reducing the effective sample size. There were 3652 right eyes initially considered for analysis. After excluding 329 eyes (see details in table 2), this left a total of 3323 right eyes. The percentile values obtained were very similar to that observed when both eyes were included (table 4). Comparison of percentiles for VCDR obtained for the grouped data showed a median difference of 0 with a range of 0–0.03.
DISCUSSION
Estimation of the vertical cup to disc ratio (VCDR) is one of the most frequently performed clinical assessments of the optic disc, performed for the diagnosis and follow up of patients with glaucoma. The simplicity of this technique and the lack of specialised equipment required to perform these estimates also make VCDR an ideal measure for large population surveys.7 Foster et al recently proposed a scheme for case definition of glaucoma in population based prevalence surveys.1 They suggested that the 97.5th percentile for VCDR should define the upper limit of normal in a “hypernormal” population without visual field defects. It is well established that optic cup size is related to the size of the optic disc. The VCDR percentiles should therefore be adjusted to account for differences in the size of the optic disc. This report describes the relationship between VCDR percentiles and vertical disc diameter in a large population based cohort.
VCDR is well known to vary widely within the normal population. In this sample, VCDR ranged from 0.07 to 0.84, which is similar to the range reported by Jonas et al in an unselected cohort of 457 normal optic nerves (range 0–0.87).2 In addition, the overlap between normal and glaucomatous discs has also limited the value of a single cut off to define eyes as glaucomatous. Although it is well established that the optic disc rim area and vertical cup diameter increase in association with optic disc size,8 we are not aware of previous reports recording the actual size dependent percentile values for VCDR for a large unselected population. The median optic disc in our sample had a vertical disc diameter of 1.5 mm and a VCDR of 0.43. The overall (size independent) 97.5th percentile cut off for the entire population was 0.7, which is similar to that recorded in other population surveys.1 This justifies the common use of 0.7 as a cut off value. Our size adjusted 97.5th percentile cut off, however, increases from 0.6 for 1.2 mm optic discs to 0.75 for 1.9 mm optic discs. Using 0.7 as the cut off could potentially lead to high numbers of false negatives in eyes with small optic discs and high numbers of false postives in larger optic discs. This highlights the need for routine evaluation of vertical disc diameter in clinical practice.
The accuracy of using VCDR percentile cut off values to establish a diagnosis of glaucoma still requires validation. We have not determined the specificity and sensitivity of this approach to diagnose the glaucoma cases in our series. Optic nerve appearance and the size of the optic cup were used as diagnostic criteria in our population. Although some cases with glaucoma in this population had VCDR less than 0.7, a VCDR> = 0.7 was one of a number of guidelines employed in this study to identify eyes that required further evaluation for glaucoma. This therefore provides a potential source of selection bias which could overestimate the specificity and sensitivity from use of our percentile cutoffs to detect the glaucoma cases in the Blue Mountains Eye Study population.
Our population sample excluded eyes with glaucoma and optic nerve anomolies. The 2.5% of optic discs that fell outside the 97.5th percentiles were therefore “normal” eyes. The inclusion of glaucoma cases in the analysis led to a modest increase in the 95th and 97.5th percentile values. The difference in the 99th percentile, however, was up to 0.17. Such clinically significant differences in VCDR percentiles were particularly seen in smaller optic discs. A mean difference of 0.13 was observed in the 99th percentile for optic discs ⩽1.5 mm compared with only 0.06 for discs ⩾1.6 mm. This was seen despite the relatively small numbers of glaucomatous eyes in our population. Inclusion of glaucomatous eyes in the analysis can have a significant impact on 99th percentile values and future studies should state clearly whether or not glaucomatous eyes have been included in the analysis.
Inclusion of both eyes in the analysis could have led to a falsely higher association between VDD and VCDR owing to correlation of biometric and pysiological variables between two eyes of a given individual. Right eye analysis was therefore performed to determine whether this had a significant effect on the percentile values. Omission of left eye data had minimal effect on the percentile values for either the grouped or ungrouped data.
Percentile values were calculated for optic discs with vertical diameters between 1.2 mm and 1.9 mm for the non-grouped data. The total number of eyes with optic disc diameters outside these values was small (170 eyes) and the 95th, 97.5th, or 99th percentile for a given disc size was therefore frequently the same. A total of 98 eyes had optic discs below 1.2 mm and 72 eyes had discs with vertical diameters above 1.9 mm. Overall this accounted for only 1.1% of the total number of eyes.
Our grouped data show that small (1.1–1.3 mm) and large (1.8–2.0 mm) discs form a significant proportion of the population (16.1% and 9.0%, respectively). This suggests that approximately 1 in 4 optic discs require an adjustment to the 0.7 rule. Very small (microdiscs <1.0 mm) and very large (macrodiscs >2.0 mm) on the other hand are uncommon. These optic nerves are frequently the most difficult to diagnose in clinical practice. It is therefore tempting to extend the linear regression curve generated in the nomogram beyond the values shown. It should, however, be borne in mind that optic discs beyond the range shown may no longer have a linear relation between disc diameter and cup to disc ratio.
Planimetry using a stereoscopic viewing system permits reliable evaluation of VCDR.9 We have previously published the high interobserver and intraobserver agreement for the trained observers who performed the planimetric assessment in this study.4 The intraclass correlation coefficient was 0.91 for vertical disc measurements and 0.83 for estimates of VCDR. High levels of agreement for planimetry have also been descibed elsewhere. Varma et al also showed excellent intraobserver agreement for planimetric assessment of stereophotographs with a weighted kappa of 0.79. Interobserver agreement was slightly lower with a weighted kappa of 0.67.10 Klein et al showed that observers agreed within 0.1 of a ratio in around 75% of eyes.11
Vertical disc diameter and vetical cup to disc ratio can be reliably measured by slit lamp biomicroscopy.12 Jonas et al showed that fundoscopy with a Goldmann fundus contact lens permitted reliable estimation of rim area and was comparable to planimetry.13 It is, however, clear that different imaging methods may provide different estimates of optic disc size. Estimation of optic disc size with a 78 D fundus lens gave significantly larger estimates than planimetry. In contrast, Heidelberg retinal tomography provided significantly smaller estimates of vertical disc diameter.14,15 The potential differences in estimated disc size derived from different examination methods should be taken into consideration when transfering data generated in this study to clinical practice or other population studies. Scanning laser ophthalmoscopy of the optic discs will be performed in the third phase of the Blue Mountains Eye Study and it will be interesting to compare these values with those derived from planimetry.
The use of spherical error to correct for magnification—although an accepted methodology—is generally less accurate than formulae which use axial length.16 Spherical equivalent correction was used for this study as axial length measurements were not available. The consequence of using spherical error is that the vertical diameter of the larger discs can be underestimated whereas the vertical diameter of smaller discs can be overestimated.16 This may have led to our data underestimating the effect of disc size on VCDR.
Our study provides percentile values for VCDR from a large, elderly, predominantly white, population based cohort. A clear linear relation exists between VCDR and vertical optic disc diameter. The range of differences observed between small and large optic discs (together accounting for around 1 in 4 optic discs) underlines the importance of estimating vertical optic disc diameter in clinical practice. Although the absolute number of glaucomatous eyes in the population is small, we showed that their inclusion in the analysis can influence percentile values. The nomograms presented in this report may prove useful in clinical practice and in the conduct of population surveys. The value of these cutoffs as a sole diagnostic criterion for establishing a diagnosis of glaucoma, however, needs further validation and it will be interesting to test these percentile values against other populations.
REFERENCES
Footnotes
-
Supported by the Australian National Health & Medical Research Council, Canberra Australia (Grant No 974159) and the Keeler Scholarship, Royal College of Ophthalmologists, London, UK