Article Text

Abstract
Background Clinical research and management of retinal diseases greatly depend on the interpretation of retinal images and often longitudinally collected images. Retinal images provide context for spatial data, namely the location of specific pathologies within the retina. Longitudinally collected images can show how clinical events at one point can affect the retina over time. In this review, we aimed to assess statistical approaches to spatial and spatio-temporal data in retinal images. We also review the spatio-temporal modelling approaches used in other medical image types.
Methods We conducted a comprehensive literature review of both spatial or spatio-temporal approaches and non-spatial approaches to the statistical analysis of retinal images. The key methodological and clinical characteristics of published papers were extracted. We also investigated whether clinical variables and spatial correlation were accounted for in the analysis.
Results Thirty-four papers that included retinal imaging data were identified for full-text information extraction. Only 11 (32.4%) papers used spatial or spatio-temporal statistical methods to analyse images, others (23 papers, 67.6%) used non-spatial methods. Twenty-eight (82.4%) papers reported images collected cross-sectionally, while 6 (17.6%) papers reported analyses on images collected longitudinally. In imaging areas outside of ophthalmology, 19 papers were identified with spatio-temporal analysis, and multiple statistical methods were recorded.
Conclusions In future statistical analyses of retinal images, it will be beneficial to clearly define and report the spatial distributions studied, report the spatial correlations, combine imaging data with clinical variables into analysis if available, and clearly state the software or packages used.
- retina
- imaging
This is an open access article distributed in accordance with the Creative Commons Attribution Non Commercial (CC BY-NC 4.0) license, which permits others to distribute, remix, adapt, build upon this work non-commercially, and license their derivative works on different terms, provided the original work is properly cited, appropriate credit is given, any changes made indicated, and the use is non-commercial. See: http://creativecommons.org/licenses/by-nc/4.0/.
Statistics from Altmetric.com
Background
Retinal imaging is routinely used in clinics utilising a wide range of modalities, such as scanning laser ophthalmoscopy, fundus imaging, fluorescein angiography (FA) and optical coherence tomography (OCT), which enables us to better understand retinal physiology and to detect various abnormalities. Additionally, there is a wide variation of magnification, field of view, pixel density and heterogeneity across the images, while each methodology can be subject to various types of artefacts. In general, each image is a collection of thousands (or millions) of pixel data. The imaging data contain the spatial layout of the pixels and the intensity value of each pixel point. An example is the retinal FA images acquired for a study of the death or survival of children with malaria. Researchers were interested in how the location and the amount of capillary non-perfusion (CNP) relates to the survival outcome of the patients.1 The FA images can then be processed using an image segmentation method to tell whether a pixel point is a part of the CNP lesion or not. The processed image can be considered as a map of ones and zeros; hence for each retina, the imaging data are a spatially organised collection of thousands (or millions) of binary values. Such a map of zeros and ones can be seen as a realisation of a spatial point process (also called point patterns spatial statistics).2
Apart from pixel representations, the retinal images may be divided into smaller numbers of sectors to facilitate the manual annotation (ie, manual assessment of image). A useful set of sectors is created, for example, by the ETDRS grid (figure 1),3 designed for manually grading the macula, the centre of the retina. The grid consists of nine sectors or subfields, centred on the centre of the macula, providing a central subfield, and inner and outer rings with radii of 500, 1500 and 3000 mm, with the rings segmented into four quadrants (superior, inferior, nasal, temporal subfields). This grid has been implemented in most image platforms, and one of these is OCT imaging, which gives a cross-sectional view of the retina and provides retinal thickness measurements in each quadrant of the grid for each layer of the retina. In the spatial statistical community, the idea of dividing an image into non-overlapping sectors is, however, not new, it has been looked into thoroughly, and such sectors are called ‘lattices’.2

Colour fundus photograph with ETDRS grid (white lines) centred on the centre of the macula. In this photograph, sector 1 is the central subfield, sectors 2–5 are inner subfields, 6–9 are outer subfields; sectors 2, 6 are superior direction, sectors 3, 7 are nasal direction, sector 4, 8 are inferior direction and sectors 5, 9 are temporal direction.
Retinal images are often acquired repeatedly over time during follow-up visits, thus giving rise to spatio-temporal data, which is a complex data structure for analysis. These repeatedly collected retinal images can give valuable insight into studying disease aetiology, monitoring of diseases and early diagnosis, and response to treatment. With the recent improvement of the imaging technologies, it is now highly topical to assess systematically the right ways to analyse these complex spatial and spatio-temporal data. There are practically two quantitative approaches: manual quantitative (eg, manually quantify the extent of damage on image) and automated quantitative (eg, automatic quantification using a computer algorithm) assessment.
A manual quantitative evaluation of the retinal images can be done by clinicians or trained graders. Manual evaluation can be beneficial; however, it is often expensive, subjective and practically impossible to do on a fine spatial scale. Furthermore, it possesses an enormous task for humans to evaluate the change in images over time manually.
An automated quantitative evaluation of the retinal images can be done either via a spatial or non-spatial statistical evaluation. In this study, we note that a spatial evaluation is defined as a method that acknowledges the spatial location of features and their possible correlations between the locations (ie, the spatial correlations). By contrast, a non-spatial statistical evaluation focuses on one or multiple locations of features but does not consider their potential correlations. Another clinical example is diabetic macular oedema (DMO), a condition seen in diabetes when leaky vessels cause fluid to accumulate in the macula, and where researchers are interested in acquiring the retinal thickness using OCT to relate to different stages of DMO. Retinal imaging data not only contain thickness values but also the locations of those thicknesses relative to various landmarks, such as the foveal centre and the optic disc. However, to date most researchers have only investigated the changes in the central subfield mean thickness and ignored the retinal thickness measurements in other subfields.4 This may lead to bias or inaccuracy in the diagnosis due to ignoring the spatial context. Also, in real-world practice, one criterion for patients with DMO to be treated with intraocular injections is the increased thickness measurement of the central subfield rather than the complete profile of the retinal thickness. This simplifies the decision-making process, but it is not clear how and if the process is affected by ignoring the data from other parts of the image. The main challenge of such automated quantitative spatial statistical evaluation lies in the fact that each image contains thousands (or millions) of pixels; hence it is highly dimensional. Such dimensionality prohibits the use of maximum likelihood unless some assumptions are made about the studied features (eg, basis functions or lattices). Several statistical approaches have been recently proposed and used for the retinal images.1 5 6 However, there is no review of the approaches, and there is a lack of understanding of the advantages of different approaches.
Outside of retinal imaging, there is extensive literature on the statistical analysis of medical images, which provides an invaluable insight into the advantages of careful spatial analysis. The spatial and spatial–temporal modelling has been applied in the analysis of cardiac images and functional MRI (fMRI) brain images.7 8 Its advantage is that it captures the temporal covariance structure across spatial locations, and in doing so, it can increase the precision of parameter estimates. Moreover, an ideal fMRI statistical analysis should incorporate a proper characterisation of the spatial and temporal properties of physiological activities.9
In this review, our primary aim was to investigate what data analytic approaches are used to analyse retinal imaging data: in both association (epidemiological) and diagnostic (prognostic, predictive, screening) studies. Specifically, we aimed to see if the spatial correlation is estimated, reported and incorporated (adjusted) in the analysis. Our secondary aim was to create a comprehensive list of all relevant spatio-temporal statistical modelling frameworks applied to other medical specialties in the current literature.
Methods
We used Scopus, MEDLINE (Ovid) and Web of Science to search for relevant papers. Search strategies are presented in online supplementary file 1.
Supplemental material
Eligibility criteria
We included articles if
Spatial/spatio-temporal information is available in their studies, or the article used spatial/spatio-temporal ophthalmic imaging data.
The article used statistical analysis methods for human retinal imaging data.
Full text is available online.
We excluded articles if the article
Interested purely in image processing such as image registration or image segmentation.
Focussed purely on machine-learning methods.
Conducted cell-level image analyses.
Aimed to do analyses on non-human retinal data.
Both spatial and non-spatial approaches to the analysis are included in this review. The original titles, abstracts and keywords were identified, and then irrelevant papers were excluded. If the study relevancy was unclear from the title and abstract, the full text was viewed to decide whether to include the study or not. We note that in this study, machine learning is defined as a model that learns and improves automatically through the given data.10
Data extraction: primary information extracted from papers
The most crucial information that we extracted from papers was on the type of statistical approach used. There are two types of statistical approaches and hence two groups of papers:
Papers that use a spatial or spatio-temporal statistical approach.
Papers that use a non-spatial statistical approach.
Data extraction: the list of all information
The data extraction form to obtain all necessary information can be found in online supplementary file 2. Spatial data refer to having more than one single measurement on the retinal space. Papers stating the analyses of the direction, namely spatial, inferior, temporal and superior, or ring (eg, central subfield, inner ring and outer ring) effect, are all selected in the review as analyses of spatial content. If the paper involves models analysing a spatial data recorded at more than two time points, it is referred to as using a spatio-temporal modelling framework, otherwise purely a spatial model. We report spatial models and spatial–temporal models separately in the results.
Supplemental material
For each paper included in our review, the information was extracted relating to the author, publishing journal, the aim of the study, the year of publication, the reported sample size, the length of follow-up, the clinical variables and the demographic data. We also reported how the spatial or spatio-temporal data were obtained, and if the sector-wise or pixel-wise analyses were done (not involving image preprocessing). The type of retinal-related diseases studied in the papers is also reported. Healthy eyes are referred to as eyes without a known history of ocular diseases, and without an identified tumour or severe myopia. We also included whether the paper used two eyes or just one eye for the analyses and whether the correlation between the two eyes was reported, if two eyes data were obtained.
Statistical methods and software used to analyse the spatial or spatio-temporal ophthalmic data are also recorded in our review. If a method/ software was used to do image preprocessing analyses or other statistical preliminary analyses such as the normality checking, we did not record it in our review. If a paper used a spatial approach to analyse the spatial or spatio-temporal ophthalmic data cited from another paper where the method was initially developed or applied in clinical imaging data, the reference cited was also included in our review.
We also reported whether the spatial correlation was considered and adjusted in the included paper. If the term ‘spatial distribution’ was mentionlined in the paper, we recorded the way how the spatial distribution was reported. If a spatio-temporal modelling was used, the effect of adding temporal information into models was extracted in terms of whether it improved the prediction precision and accuracy.
Results
The databases Scopus, MEDLINE (Ovid interface), Web of Science were searched on 27 September 2018. We restricted our search to the English language published papers starting from the year 2012, and updated the searches on 26 March 2019. The flowchart of the progress is shown in figure 2. A total of 989 papers were identified based on the search strategy from three databases after removing duplicates and one retraction record. Titles and abstracts of these 989 papers were screened, which excluded 926 papers. After full-text extraction, 34 papers remained which analysed spatial or spatio-temporal ophthalmic images,1 5 6 11–44 among which 11 papers used spatial, or spatio-temporal modelling framework and 23 papers implemented non-spatial analyses to the data.

Literature review eligibility flowchart for statistical analyses of retinal images.
Characteristics of the selected papers
Characteristics of the selected papers are listed in table 1, where the number of papers using either spatial approach (N1 (%), including spatial and spatio-temporal) or a non-spatial approach (N2 (%)) was recorded for each extracted information.
Characteristics of the selected papers
Among 34 included papers, 28 (82.4%) of them involve ophthalmic images obtained at only one or two time points; 6 (17.6%) studies include images from more than two time points. Table 1 shows that most of the selected papers perform sector-wise analyses and 7 (20.6%) papers analyse images in a pixel-wise manner. In contrast, 2 (5.9%) papers conducted categorical analyses of the feature of interest in the images in terms of presence or absence. In regards to the number of eyes per patient involved in the statistical analyses, 19 (55.9%) papers use one eye per subject, where the chosen eye is referred to as the study eye. Moreover, it was selected in one of these mechanisms: the eye with better best-corrected visual acuity or with the best image quality, or randomly selected eye, or the left eye or the right eye. There were 13 (38.2%) papers that use two eyes per subject, but only six papers consider or report the correlation between two eyes from the same subject, and there were two studies that did not report clearly whether one or two eyes were used.
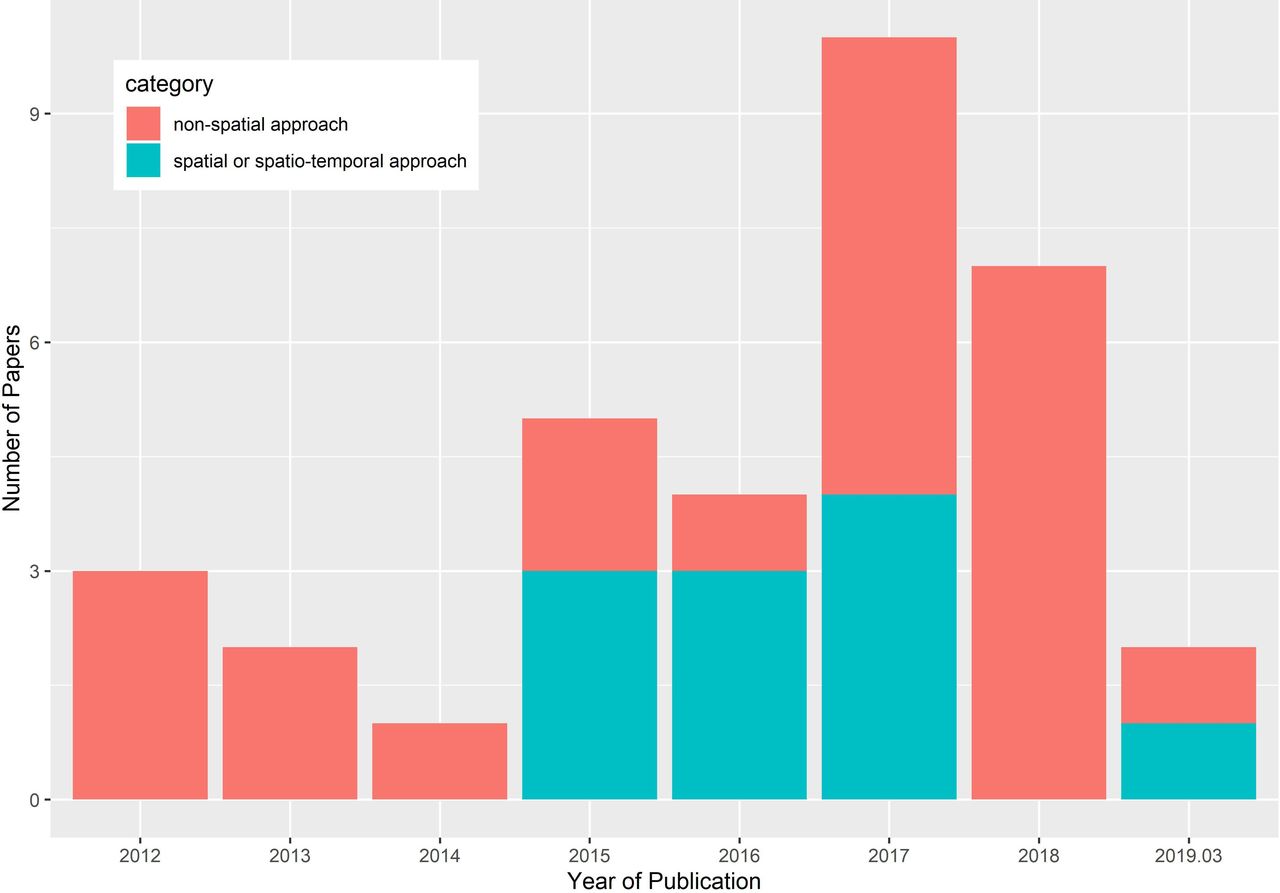
Year of publication
As shown in figure 3, the distribution of publication time from January 2012 to March 2019 was skewed towards more recent dates with a median publication year in 2017. Over the time duration investigated, there is an overall trend of the increasing number of papers both in the category of non-spatial approach and spatial modelling framework published, and the number of papers in the category of non-spatial approach was still high in 2018.
Year of publication of included studies.
Retina-related diseases
Retina-related disease types are listed in table 1, with the most common including age-related macular degeneration, macular oedema, diabetic retinopathy, glaucoma and retinal artery and retinal vein occlusion. There are also 6 (17.6%) studies that only included eyes with no known or previously presented ocular disease, and 7 (20.6%) studies included age-matched healthy controls and demonstrated the importance of studying the spatial information in both healthy and unhealthy eyes.
Imaging device
Of the included studies, six imaging devices (excluding images taken during the patient recruitment process) were used more than once to obtain spatial or spatio-temporal ophthalmic data (summarised in table 1). Some papers used more than one imaging capture technique either in the data preparation step or validation procedure. MRI was used only once to detect MRI-visible tumours in the eye.24
Journal
The included studies were published in a diverse set of journals, with 18 (52.9%) in separate journals and 11 (32.4%) papers published in the same journal ‘Investigative Ophthalmology & Visual Science’, which is a journal well-known for publishing both clinical and laboratory research in ophthalmology and vision science.
Types of spatial approaches to analysis of retinal images
Of the included 34 papers, 28 (82.4%) papers analysed imaging data at one time point (ie, cross-sectionally) or at two time points (ie, a baseline and one follow-up visit). There were 21 papers where the researchers collected ophthalmic images at one time point and four papers at two time points. In three papers, the researchers collected imaging data at three or more time points; however they analysed the images from the first and the last time points only, that is, did not perform a longitudinal analysis.
A summary of the description of these 28 studies is listed in table 2. Of the 28 papers, 15 (53.6%) studies mentioned the term ‘spatial distribution’ or ‘topographic distribution’ and reported how the spatial distribution looked like (eg, histograms or heatmaps). Other 13 (46.4%) studies did not mention the term ‘spatial distribution’ but presented and compared the measurements of interest obtained from different sectors of the image, for example superior, inferior, nasal and temporal sectors, that is, they effectively reported the values of the ‘spatial distribution’.
Summary description of reviewed papers on spatial data from retinal images
Aim of investigating the spatial distribution
The main study objectives of the 28 studies were the spatial distribution of specified pathological features in the retina.
Three popular purposes of analysing the spatial distribution of pathology of interest were: (1) identifying the clinical risk factors of a retina-related disease (10 studies), by evaluation of the difference of the distribution between different groups; (2) exploring the relationship between the spatial profile of the pathology and other factors (eight studies); and (3) investigating the progression or detection or diagnosis of a retina-related disease (seven studies).
Other purposes of analysing the spatial distribution of pathology of interest include: to establish normative data; and to propose a novel statistical approach to characterise distributions of interest in the retina.
Statistical method used
Of the 28 studies, 19 (67.9%) included demographic data or patient’s clinical variables such as age, gender, smoking status, blood pressure, refractive error, visual acuity, and axial length.
Among the 28 included studies, the preferred statistical method (64.32%, 18 studies in total) for imaging data was a simple statistical hypothesis test. For example, Student’s t-test, χ2 test, Tukey test, Mann-Whitney U test or Spearman correlation test was applied on sectors in separate analyses. Interestingly, in most studies, the reported aim was to identify (or characterise) the spatial distribution or spatial profile of pathology of interest. However, they used a non-spatial data analysis method, which utilises simple ‘non-spatial’ metrics such as the frequency, odds ratios, or χ2 statistics, and does not acknowledge the spatial correlations.
In the category of non-spatial statistical approaches, there are also three papers that applied linear regression, linear mixed-effect models or generalised estimating equations.20 22 30 In these papers, the spatial data from different sectors were analysed separately (ie, each sector was analysed in one analysis) rather than in a whole-image modelling framework. Another approach used in these studies was averaging all the measurements from all the sectors and then using this single mean value in a linear modelling analysis, which neglected the potential variation in the spatial distribution.
Of the eight1 6 13 15 24 31 32 39 papers identified in the category of the spatial statistical modelling framework, there were five types of statistical methods recorded for the analysis of the spatial data: GLM, linear mixed-effect model, generalised estimating equation, empirical quantification without specified model and spatial point process model. The study that used empirical estimates did not clearly specify a statistical model, and they estimated the probability density function of a random variable of interest using a non-parametric bootstrapping technique.32 In the study that used the point process modelling for the spatial data,24 the relevant methodological papers45 46 were properly cited.
Spatial correlation and statistical methods to account for spatial correlation
As shown in table 2, of the 28 studies analysing the spatial imaging data, 12 (42.9%) studies mentioned the term ‘spatial correlation’ in their Methods or Results sections. Out of these 12 studies, seven studies reported spatial correlation estimates between different spatial locations in the retina, while there were only three studies taking spatial correlation into account and including it in the modelling framework, and the other four studies reporting Pearson correlations of variables measured in different spatial sectors. The remaining 5 (17.9%) studies mentioning the ‘spatial correlation’ or the ‘spatial relationship’ referred to the association between variables of interest from multiple subjects in each retinal sector.
In three published papers,1 6 15 the spatial correlation is being accounted for as within-subject variability in the analysis, and this is accomplished by using generalised estimating equation and linear mixed-effect model.
A flexible framework to analyse the spatial imaging data is linear mixed-effect modelling. Linear mixed effect models are capable of quantifying both between-subject and within-subject variations, which are characterised by random effects and random errors, respectively.47 Another flexible approach for analysis of the spatial imaging data is via generalised estimating equations.48 It does not assume distribution for the responses. For each Yi, a variance–covariance matrix Vi and the mean μi is assumed, where the expectation μi is connected to the linear predictor through a link function  , and Vi is formulated as
  with a
  working correlation matrix
  and a
and a  diagonal matrix Si. The generalised estimating equations is defined by
where Wi is a n
i × p matrix with the jth row equals  and
ϕ
is a scale parameter. In this modelling framework, the working correlation matrix is able to specify different forms of within-subject correlations.
and
ϕ
is a scale parameter. In this modelling framework, the working correlation matrix is able to specify different forms of within-subject correlations.
How the spatial distribution was reported
As shown in table 2, the form of presenting the estimated spatial distribution of the retinal pathologies were line charts, tables with mean measurements and SD in each sector, colour or grayscale intensity maps and contour plots. Of the 28 papers mentioning the terms ‘spatial information’ or ‘spatial distribution’, there were 3 (10.7%) studies not presenting the distribution visually.
What software was used?
Software used in the included 28 studies is listed in table 2 (references included in the table). In 5 (17.9%) studies, it was unclear which software was implemented for analysing the spatial imaging data. Also, there were 5 (17.9%) studies reporting more than one software used in their analyses.
SPSS, R, MATLAB and STATA are mentioned more than once across the 28 studies. The most popular software used is SPSS, possibly because the data analysis is straightforward to be conducted in SPSS if simpler statistical analysis is used. R is the next most popular software used, which might be owing to the availability of various modelling packages being developed. However, the availability of packages or codes used is not always stated clearly in the published papers.
Spatio-temporal analyses of longitudinally collected ophthalmic imaging data
Next, we reviewed studies that analyses imaging data collected at three or more time points. We refer to them as ‘spatio-temporal data’. Of the 34 included studies, 6 (17.6%) used three or more time points data and analysed them using longitudinal approach.11 17 27 29 37 38 There were four papers involving imaging data recorded at more than five time points. The summary characteristics of the identified spatio-temporal modelling studies are described in table 3.
Summary description of reviewed papers that analyse spatio-temporal data from retinal images
Aim of analysing spatio-temporal data
The reviewed papers reported various aims when analysing spatio-temporal data (table 3). Some studies had multiple goals. Three common aims were predicting the retina-related diseases, establishing the normative data that is, the topographic distribution and its change over time and detecting or evaluating the progression of retina-related diseases over time. Papers reporting the aim for the prediction used a spatial analysis framework, while all papers designed to investigate topographic distribution or to detect/evaluate the progression of diseases used a non-spatial analysis framework.
Statistical method used for spatio-temporal data
Of the identified six papers, elastic net regularised sparse logistic regression49 was used twice to predict binary outcomes. The elastic net is a regularised regression method to select variables when fitting a linear model or generalised linear model (GLM). One paper37 was aimed at predicting two different types of variables: a binary variable (eg, if the disease reoccurs) and a continuous variable (eg, when the disease reoccurs). The binary variable was modelled and predicted using an elastic net regularised sparse logistic regression. In contrast, the temporal variable was modelled and predicted using a Cox proportional hazards model50 via the elastic net. Another paper38 implemented two different models to predict binary outcomes, namely the sparse logistic regression via elastic net and the extremely randomised trees.51
This review showed that a useful method for the analysis of spatio-temporal retinal images data proves to be the elastic net regularised sparse logistic regression. Under the elastic net regularised sparse logistic regression modelling framework, for each individual i, the probability pi of binary outcomes yi are modelled as a logit function of the input covariates  with
with  . The response function is formulated as a linear function of the input covariates:
  , where the coefficients are estimated from a spatio-temporal signature matrix x by minimising the following objective function,

The overall amount of penalty is controlled by λ, and α defines the elastic-net penalty, which balance the ratio between Least Absolute Shrinkage and Selection Operator (LASSO), the l1 regularisation (α=1), and ridge, the l2 regularisation (α=0) penalty.
Another common approach to the analysis of spatio-temporal data was linear mixed-effect models or generalised linear mixed effect models. The models were implemented in two ways. One way was to analyse the temporal data repeatedly for different locations (or sectors) using mixed-effect model. Another way was to model the spatial data at each time point separately. For such modelling, simple statistical tests were then used, such as Friedman test, Pearson's correlation analysis or Fisher exact test.
Adding clinical data to the spatial analysis is an essential and challenging task. Among the studies that analysed spatio-temporal data, only two studies combined their imaging data with clinical data in their analyses. The patient’s age was a common demographic variable used in their analyses. Regarding the spatial correlation, there was only one study that performed and reported the spatial correlations by reporting the correlations between temporal, nasal, superior and inferior sectors. Two studies considered the anatomical spatial locations into the modelling and hence also for the prediction.
Software used for spatio-temporal data
The software/software library used in the reviewed spatio-temporal analyses is listed in table 3. The software packages used are also specified (references included if cited in the paper). The most mentioned softwares were R and SPSS, though one research group used the same R package (glmnet) in their two papers to perform sparse logistic regression via elastic net. The studies that applied simpler statistical tests used SPSS. None of the reviewed studies provided the software code.
Spatio-temporal modelling of images in other medical specialties
Ophthalmology is one of the medical specialties that has a comparatively shorter history of applying statistical approaches to images, which can be seen from the number of reviewed papers above. Our second aim was to see what spatio-temporal methods are used in other medical specialties and what can be potentially useful for ophthalmic images. Spatial statistical models have been successfully used for a long time in other medical imaging, such as functional neuroimaging data and myocardial perfusion imaging.7 8 52–57 In order to get a methodological overview of the spatio-temporal modelling framework in other medical imaging specialties, we used MEDLINE (Ovid interface) to search for relevant papers based on the search strategies listed in online supplementary file 1. The aim of this secondary review was not to conduct a comprehensive analysis of all papers from all medical specialties. Instead, we aimed to understand the available spatio-temporal models in the recent literature of medical imaging and to assess their usefulness for images in ophthalmology.
Searches were conducted on 26 March 2019, which was restricted to the English language published papers from the year 2007. In total, 346 papers were included, and 42 remained after the abstract screening. One duplicate, describing analyses of retinal images, was removed, and 21 irrelevant papers were discarded. In total, 20 papers were identified,8 52–56 58–71 which presented spatio-temporal statistical approaches with application in medical images. Among the included papers, one review article was found, which discussed Bayesian spatio-temporal models for analyses of fMRI data to estimate task-related activation patterns.70
The extracted information includes the image capture techniques, the statistical approach used, the indication of whether a clinical variable was incorporated, whether the spatial and temporal correlation was accounted for and whether a disease prediction was performed in the studies.
Spatio-temporal statistical methods used for imaging data in other medical specialties
Of the 19 selected papers (excluding one review article), there were five types of image capture techniques used, including MRI, fMRI, positron emission tomography, magnetoencephalography and electroencephalography. In this section, we report the statistical methods used to analyse spatial–temporal data collected from medical imaging.
One of the most popular statistical approaches is to apply the linear or GLM to the imaging data. Two studies took a Bayesian approach, and incorporate the space and time context as prior information in the model. Another three studies took a frequentist approach where they built parametric covariance models for spatial and temporal data separately. Both the Bayesian and frequentist approaches captured the spatial and temporal correlations in the analyses.
Besides, two papers used mixed-effect models. One paper proposed a functional non-linear mixed-effect model that considered non-linear spatial–temporal patterns of the imaging data. The other paper proposed a method to analyse the longitudinal imaging data in a mass univariate way, and the spatial and time series relationships are separately included using non-diagonal covariance matrices.
Other Bayesian approaches used include Gaussian process-based spatial–temporal models, hidden Markov models, sparse Bayesian learning algorithm of the elastic net and elitist LASSO and Bayesian spatial mixture model estimated via Monte Carlo Markov Chain. A more detailed description of the selected papers is available in online supplementary file 3. It includes details, such as whether the clinical variables were incorporated, whether spatial and temporal dependency was included and whether prediction was one of the aims of the studies.
Supplemental material
Discussion
We presented here the first review on spatial and spatio-temporal statistical methods for analysis of retinal images. Retinal images play an essential role in the research of aetiology and diagnosis of retinal diseases, which show the location and distribution of pathological features relative to the location of two landmarks: optic disc and fovea. We reviewed a collection of retinal studies that can be seen as a representative sample of the current research situation (between January 2012 and March 2019) in the statistical analysis of retinal images that were acquired at one or two time points, or longitudinally.
We find that it is possible to perform spatial analyses of retinal imaging data; however, not many studies considered the spatial context or correlations in their models. Moreover, there is a limited number of studies conducting spatio-temporal analyses, which can be due to the limited availability of spatio-temporal data from retinal images or suitable statistical methods. In our identified papers, we did not find a study that looks into the benefits of incorporating the spatial correlation into the statistical model: in terms of bias and precision. Furthermore, we also found that the reporting of the methods and software is not complete in some publications.
In our review of statistical analyses of imaging data in non-retinal imaging specialties, we also found a more extended history of utilising the spatio-temporal methods for imaging data. Their success indicates the potential and advantage of using spatio-temporal analyses for retinal images. Some of the frequentist or Bayesian statistical models identified in our review can be applied to retinal imaging data. For example, we can specify a separable parametric spatial and temporal relationship in the covariance matrix of a GLM model.54 58 Alternatively, a Bayesian model can be built where Gaussian Markov random field prior and autoregressive prior are used for spatial and temporal data, respectively.60 In theory, both models will work for longitudinal retinal imaging. However, neither of these two methods is easy to be implemented as the source code is not available or the software is designed for neuroimaging data (eg, Analysis of Functional NeuroImages; AFNI).72
The retinal image availability can be less of the problem in the near future because the technology is progressing for image acquisition, image storing and data sharing. Spatial statistical analyses of retinal images can be a robust framework for future studies of risk factors, diagnosis, and prediction.73
Both statistical and clinical communities recognise the importance of the location information in the retinal images. Theoretically, the statistical community recognises that ignoring spatial correlations can lead to bias and a loss of precision, which is clearly demonstrated in the application of geographical data.2 The effect of adjusting for spatial correlations can potentially vary in different data scenarios, can depend on sample size or strength of spatial correlations in the images—all of which need further investigation. Practically, the clinical community recognises the importance of the spatial context in retinal images. The relative spatial location of pathologies is routinely used by clinicians when they do a manual assessment of the image. They use the relative location of features from the images to have an informed deduction when diagnosing the diseases. For example, focal photocoagulation is used when assessing patients with clinically significant maculopathy. The location of the lesion and retinal thickening is considered qualitatively in clinics—as the current state-of-art treatment.74 Furthermore, density or eccentricity maps have been developed to quantitatively describe capillary perfusion in the parafoveal areas of the retina,75 76 which provides potential possibilities of considering spatial context and using statistical methods in the analysis of retinal imaging data.
A limitation of our retinal imaging review is that some studies may not be included if the key search terms are not in the accessible texts. For example, Gadde et al 5 used repeated measurement analysis of variance, and they performed it for different directions and circular zones in the retina, which considered the spatial context in the retina, but this was not clear from the title and abstract. Thus it is not included in our review. Also, in our secondary non-retinal imaging review, we did not include a heavily used statistical analysis in fMRI called statistical parametric mapping,77 because we only focus on spatio-temporal statistical analyses in other medical specialties.
It is important to say that, in general, there are two approaches to analysing the images. The first approach directly uses the images to make inference about disease detection or to assess the probability of disease; hence it can be seen as a one-step approach. This approach needs a highly computational method for image analysis, such as deep learning methods, and usually requires a large sample size. The second approach proceeds in two steps: the first step is to process the image to obtain imaging features (eg, segmentation of vessels) automatically, and then the features are analysed via spatial statistical methods or machine-learning methods. In this second step, it is both statistical and machine-learning methods that rely heavily on the image preprocessing (ie, the first step). Due to the sequential nature of this two-step approach, the spatial statistical and machine-learning methods (ie, the second step) would not affect the quality or the results of the image preprocessing. However, one mitigation would be incorporating the quality of the images or image preprocessing (as another variable or via specifying a relevant error structure in the spatial model) in the second step of the analysis. Furthermore, we recommend researchers to report the robustness and accuracy of the image preprocessing or data acquisition process (ie, the first step) in addition to their spatial statistical or machine-learning interpretations.
Compared with machine-learning methods (including the deep learning one-step approach), the spatial statistical methods can be more suitable for retinal images in the following scenarios. (1) The sample size is not large enough for the training of machine-learning methods. (2) An intuitive interpretation of the model (eg, how the preprocessed imaging data relate to the disease) is essential. The statistical methods have a lower number of parameters compared with machine-learning methods and have existing paradigms of adding risk factors and prior knowledge into the model to, for example, study aetiology of the disease. (3) The researchers need to design a cost-efficient clinical trial. In some studies, the research question may allow reducing the high dimensionality of imaging data so that the spatial statistical approach is beneficial to use.6
Recommendations
Our recommendations are driven by two primary concerns. First, there is low utilisation of spatial information in reviewed studies. The potential of the spatial information in retinal images has not been fully studied in most of the review papers. In some cases, the pathological features have been spatially automatically identified successfully, but the data were then averaged in order to use simple statistical methods. In the spatial statistics, it is a well-known fact that the nearby recorded data may be associated with each other in some way78 and that ignoring it can lead to bias and a loss of precision. However, only 10 (29.4%) of the studies considered such spatial correlations of the pathology of interest between different locations, and only 5 (14.7%) of them included the spatial correlations in their spatial statistical model. It is, therefore, crucial to do studies where one compares and reports the models with various specifications of spatial correlations: with no spatial correlation and with appropriate adjustment to spatial correlation. Further research and guideline are needed to show researchers how to find the best adjustment for the spatial correlations such as via model selection methods.
Our second concern is the reporting of spatial distribution. It was unclear in many reviewed studies what the estimated spatial distribution was because the spatial distribution of the pathology of interest was not clearly defined or not clearly presented or not visualised. We provide several recommendations for the future statistical analyses and the reporting of spatial retinal imaging data. They can apply to other types of imaging data outside of ophthalmology (box 1).
Recommendations for future statistical analyses of retinal imaging data as well as for reporting of such analyses
Unless reasons are given, the spatial data from retinal images should not be averaged into one measurement for the statistical analyses.
Spatial correlations (of one pathology of interest between different sectors) should be reported. Statistical analysis should be conducted with and without adjustment for spatial correlations, and both results should be reported.
Definitions of spatial distributions of the feature of interest need to be clearly stated, and the spatial distributions (or density map) need to be clearly reported.
Clinical variables should be included in the analysis, due possible confounding, if relevant and if they were recorded.
Software (or packages) used should be clearly stated, or codes should be available upon request.
Due to the need for patient monitoring and disease management in clinics, it is essential to combine spatial imaging data with clinical variables, which could provide causality or relevance between clinical variables, disease prognosis, or prediction. Additionally, for research reproducibility, it is crucial to specify the software and the packages or the functions used in the analysis, so it is possible to understand (after a reasonable effort) how the spatial data and the spatial correlations were analysed.
Conclusion
This review reports the current state of knowledge and practice in spatial and spatio-temporal statistical methods for retinal images. We found a limited number of publications reporting spatial and spatio-temporal statistical methods, and this work brought us to the acute question of how big a difference will it make to adjust for spatial correlations in retinal imaging.
Further development needs to be done by the statistical community to develop the spatio-temporal methods as well as the software. The complexity of having both the spatial and temporal components is large; hence more developmental focus is needed.
In the future, the spatial context and spatial correlations in retinal images should be reported and taken into consideration in the analyses. This will allow readers to compare the differences in adjusting and not adjusting spatial correlations in terms of diagnosis or prediction error, parameter estimates and standard errors. The combination of spatial imaging data with clinical data, the spatial and spatio-temporal framework can help bring further light into understanding of the risk factors, improve the automated algorithms in decision support systems for clinical diagnosis and can improve the trial design by lowering the sample size and bringing more refined definitions of the imaging markers.
References
Footnotes
Contributors All authors contributed to the design of the investigation and to the interpretation of the results of the investigation. WZ extracted data from the identified papers, conducted analyses and wrote the first draft of the manuscript. All authors edited and approved the final manuscript.
Funding WZ would like to acknowledge the PhD funding from Institute of Ageing and Chronic Disease and Institute of Translational Medicine at University of Liverpool and the Royal Liverpool University Hospital.
Competing interests YZ, GC were authors on two of the papers identified in this review. SH was an author on one of the papers identified in this review.
Patient consent for publication Not required.
Provenance and peer review Not commissioned; externally peer reviewed.