Article Text

Abstract
Objective To measure the kinetic visual acuity (KVA) which is the ability to identify approaching objects and the functional visual acuity (FVA) which is continuous VA during 1 min under binocular and monocular condition (non-dominant eye shielding) for healthy subjects, and related ocular parameters to explore their correlation and implication in aspect of integrated visual function.
Methods The mean age of the 28 participants was 38.6±8.9 years (range, 23–57 years; 6 women). A KVA metre (AS-4Fα) and FVA metre (AS-28) were used to measure KVA and FVA, respectively. Multiple regression analysis was conducted to explore correlations among the measured visual function and related parameters, including age, binocularity, best-corrected visual acuity, refraction and tear break-up time.
Results The results of binocular KVA were better than monocular KVA at all speeds. A strong correlation was found between monocular and binocular KVA. The results of binocular FVA were better than monocular FVA (p<0.001) and there was a correlation between monocular and binocular FVA (R=0.638, p<0.001), as well as the maintenance rate for FVA (R=0.228, p=0.003). A linear mixed-effects model revealed that binocularity for KVA prediction was significant at all speeds and FVA was also significant at 60 km/h (p<0.05).
Conclusion The current results suggest that both binocularity and FVA may contribute to KVA.
Trial registration number UMIN00032385
- vision
- visual perception
This is an open access article distributed in accordance with the Creative Commons Attribution Non Commercial (CC BY-NC 4.0) license, which permits others to distribute, remix, adapt, build upon this work non-commercially, and license their derivative works on different terms, provided the original work is properly cited, appropriate credit is given, any changes made indicated, and the use is non-commercial. See: http://creativecommons.org/licenses/by-nc/4.0/.
Statistics from Altmetric.com
Key messages
What is already known about this subject?
Previous investigations described binocular kinetic visual acuity (KVA) was superior to monocular KVA, however, there have been only a few investigations on other factors influencing differences in KVA.
What are the new findings?
KVA was closely correlated with functional visual acuity (FVA) at higher speeds and this was stronger than the correlation between KVA and binocularity.
How might these results change the focus of research or clinical practice?
Close correlation between KVA and FVA suggests that FVA could be a potential indicator for evaluating visual function in daily life to percept moving objects.
Introduction
A better understanding of binocular visual function is required in modern society. People with monocular vision may suffer impaired visual function as the superiority of binocularity is well established in visual acuity (VA), reading speed, depth perception and movement detection.1–6 Binocular summation/binocularity is composed of probability summation and neural summation. When the light stimulates the photoreceptors in one eye, the corresponding photoreceptors in the contralateral eye are simultaneously stimulated. Thus, the probability of photoreceptor stimulation in the binocular conditions is higher with binocular than monocular viewing.3 Other studies reported that binocular viewing lowers the contrast threshold by up to 40%7 8 and the degree of summation is related to the complexity of the visual task.9 However, the functional role of binocularity has not been fully determined for daily activities. Common vision-threatening diseases that may cause monocular status include cataract, glaucoma and age-related macular degeneration, along with disorders of the central nervous system, such as cerebral infarction. A recent increase in the prevalence of the above-mentioned age-related eye diseases10–13 may be associated with increased traffic fatalities involving the elderly as binocular or monocular diseases can affect the integrated visual function essential for traffic safety. It is an emerging issue in our ageing society.
Kinetic VA (KVA) is the ability to identify approaching objects, whereas the ability to identify objects moving horizontally or vertically is called dynamic VA.14 There have been only a few investigations of KVA, and detailed studies have not been conducted on factors influencing differences in KVA ability. Rose3 reported that the threshold of movement detection for binocular viewing is quite small compared with monocular viewing, and the threshold for monocular viewing is higher than that for binocular viewing out to distances of 15–20 m, beyond which they are the same. This finding indicates that binocularity may contribute more at higher speeds to recognise distant objects.
Recent investigations suggest that dry eye (DE) affects numerous visual parameters including higher-order aberration, accommodation and functional VA (FVA).15 16 DE is a very common eye disease and the estimated prevalence is 10%–20% in the adult population.17 DE is diagnosed by a specific corneal examination, lacrimal examination and medical interview.18 FVA is worse in DE and many other age-related eye diseases.19 The previous investigation described that among various clinical factors, FVA significantly predicted the correct answer rate in driving aptitude tests, and it was a promising method for screening driving aptitude, including both visual and cognitive functions in a short time.20 However, the association between KVA and FVA has not been determined even though both are involved in the performance of watching objects continuously and are critical in driving safety.
KVA and FVA were examined under binocular and monocular conditions and analysed the correlation between these visual functions and ocular parameters. The aim of this study was to explore these correlations and find an appropriate method for determining the best visual performance with integrated visual function.
Methods
Participants
Participants aged 20 or older were recruited via an advertisement in our research centre. The exclusion criteria were best-corrected visual acuity (BCVA) <20/30 in either eye, systemic disease or eye disease affecting visual function, history of surgery or refractive surgery, near stereovision over 80 s and a Mini-Mental State Examination (MMSE) score <24.
Ethics statement
The Institutional Review Board and Ethics Committee of the Keio University School of Medicine approved this study (approval number: 20170295) and the methods were carried out in accordance with the Declaration of Helsinki. Written informed consent was obtained from all participants. The study protocol was registered with the UMIN Clinical Trials Registry (UMIN00032385).
Ophthalmological and cognitive examination
Bilateral monocular and binocular distance VA was measured with the best corrective lenses (BCVA) and without corrective lenses (uncorrected VA). All participants underwent measurement of binocular-corrected and monocular-corrected distant FVA using the AS-28 FVA measurement system (Kowa, Aichi, Japan). The FVA was defined as the average of all VA values measured during 60 s with the best distance correction. Measurements started with the Landolt ring size of the subject’s BCVA. Each Landolt ring was displayed in the device for 2 s. When the subject’s response was correct, the next Landolt ring size became smaller. If the response was incorrect or none, the next Landolt ring size became larger. The maintenance rate of FVA was calculated as follows: (lowest logarithm of the minimum angle of resolution (logMAR) VA score − FVA at 60 s) / (lowest logMAR VA score − baseline VA).
The KVA was measured using a KVA metre (AS-4; Kowa, Tokyo, Japan.) with the best distant correction as follows. The participants were instructed to look through the measuring window. They would detect the Landolt ring of 20/60 in a bright white circular shape. The Landolt ring moved towards the subjects from a 50 m distance at a velocity of 20, 40 and 60 km/h. The participants were asked to immediately respond by pressing a joystick when they identified the orientation of the Landolt ring. The results were expressed as decimal VA according to the distance of the participant’s response. After two practices to reduce mistakes due to unfamiliarity with the test, the participants carried out five trials at three velocities under binocular and monocular conditions, with a 1 min rest between each setting. If the participant’s answer was incorrect in all five trials, it was excluded from the analysis.
The stereo fly test (Stereo Optical Company Inc., Chicago, Illinois, USA) was performed at 40 cm to evaluate near stereopsis. The dominant eye was determined by the Rosenbach test. The Rosenbach method21 was used to determine which was the dominant eye. Subjects concealed small objects far away with their thumbs under binocular vision. When one of the eyes closed, the object hidden by the thumb became visible, which proved that the closed eye was the dominant eye.
The standard tear BUT was measured after the instillation of fluorescein sodium in the conjunctival sac with a test filter paper.22 The interval between the last complete blink and the appearance of the first corneal black spot in the stained tear film was measured three times, and the mean value was calculated. The cut-off value was 5/6 s. Cognitive status was evaluated with the MMSE-Japanese (MMSE-J, Nihon Bunka Kagakusha Co. Ltd, Tokyo, Japan).
Statistical analysis
For statistical analyses, decimal VA values were converted to the logarithm of the minimum angle of resolution. The measured value in the dominant eye was used for comparison with the binocular value. Where appropriate, data are expressed as the mean±SD. The normality of distribution of all variables was confirmed using the Shapilo-Wilk test with a significance level of 0.05. Paired t tests and Wilcoxon signed-rank tests were used for univariate analyses of continuous demographic and clinical features to compare monocular and binocular KVA and FVA. To further evaluate the association between KVA and other parameters, a linear mixed-effects model analysis was conducted with monocular and binocular KVA as dependent variables and demographic (age and sex) and ophthalmic parameters (monocular and binocular BCVA and FVA, FVA maintenance rate, refraction, anisometropia, BUT, Schirmer test value and MMSE score) as independent variables to obtain standardised correlation coefficients. All statistical tests were two-sided and the significance level was set to α=0.05. All analyses were performed using SPSS V.24 software (IBM, Armonk, New York, USA).
Patient and public involvement
Study participants were involved in this study as the examinee. They were recruited via an advertisement in our research centre and fully informed of the time, burden and safety of examinations. The Institutional Review Board and Ethics Committee of the Keio University School of Medicine approved this study and were to regularly check the compliance.
Results
This study included 28 volunteers (6 women and 22 men) with the mean age of 38.6±8.9 years (range, 22–56 years). All participants satisfied the inclusion and exclusion criteria. The results of VA and refraction are shown in table 1. Most participants were mild myopes. The mean tear break-up time (BUT) was 9.64±2.84 s and three participants had a short BUT and were possible patients with DE according to the latest definition.18
Visual acuity and refraction of the participants
In all participants, near stereovision was over 80 s and the MMSE score was better than 24 points with a mean MMSE score of 29.9±0.26.
Comparisons of KVA between binocular and monocular conditions are shown in table 2. Binocular KVA was better than monocular at all speeds and a strong correlation was observed between binocular and monocular KVA. KVA at 60 km/h was significantly worse than KVA at 20 km/h under binocular and monocular conditions (p<0.01).
Comparison of binocular and monocular kinetic visual acuity
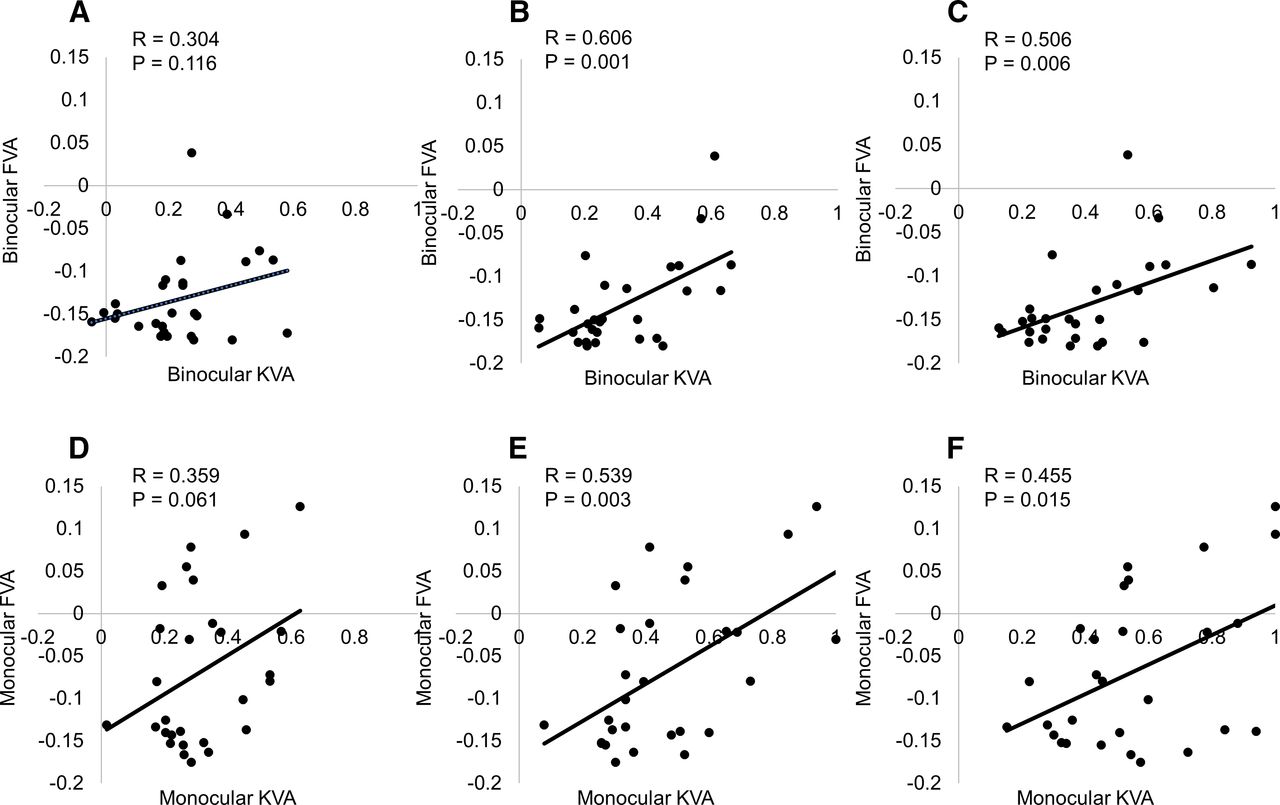
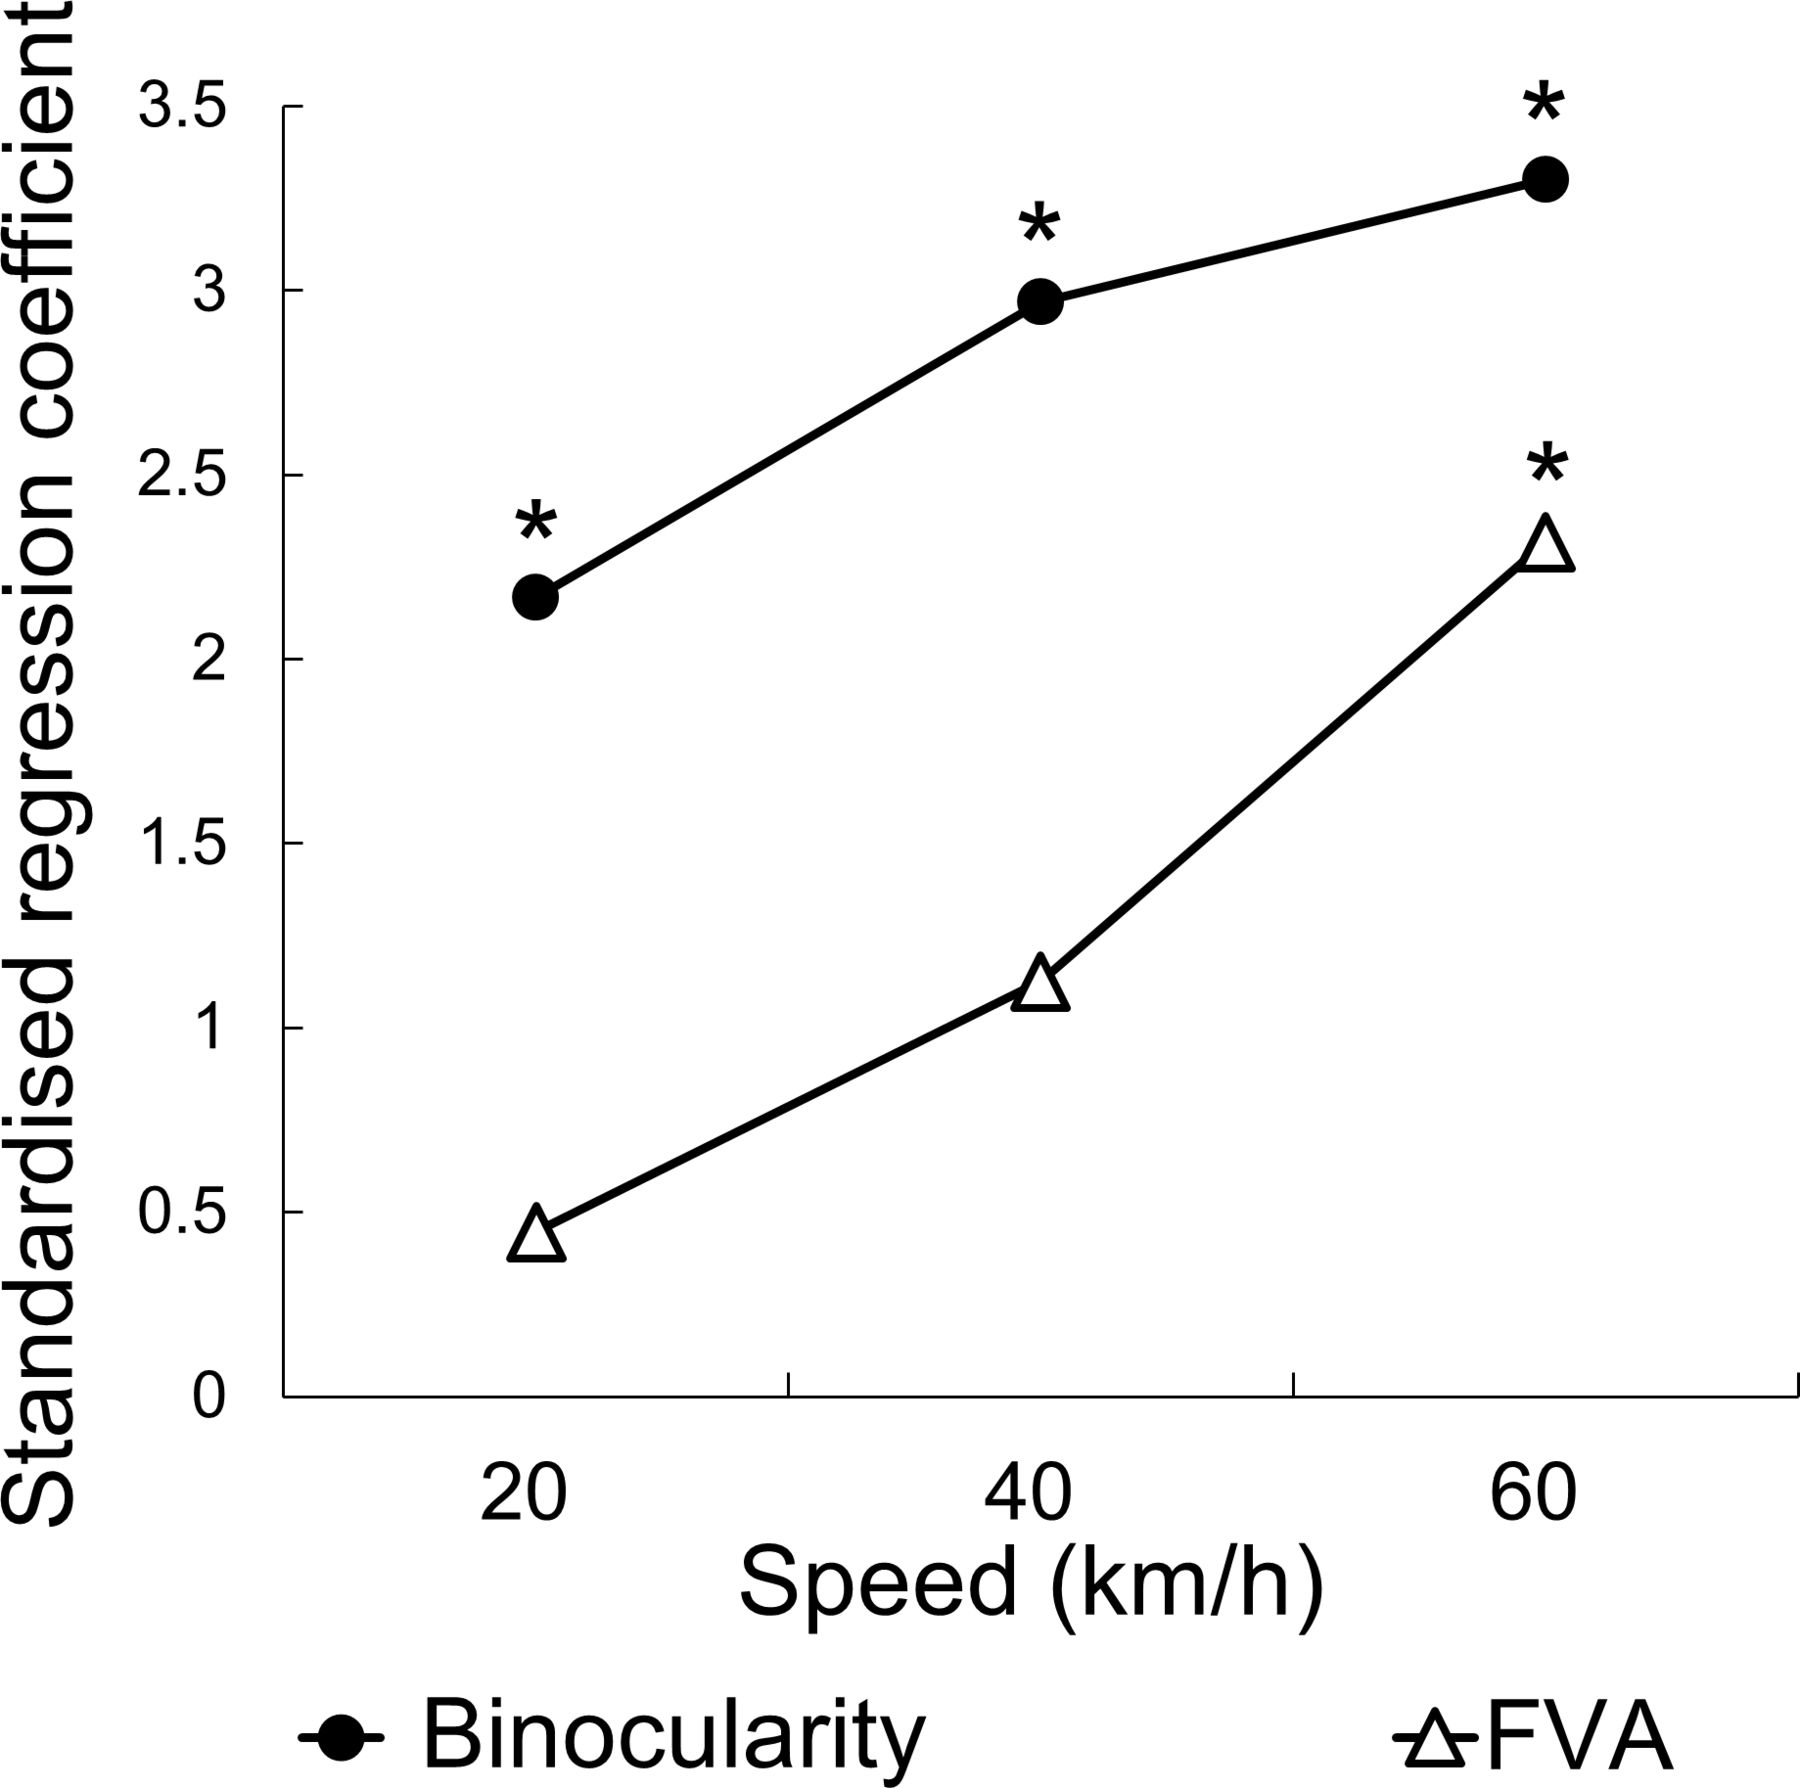
The results of a simple regression analysis between KVA and independent values (VA, refraction, FVA, object speed and binocular/monocular condition) are shown in table 3. The correlation between KVA and FVA (R=0.473, p<0.001) was stronger than between KVA and BCVA of the non-dominant eye (R=0.274, p<0.001) or binocularity (R=0.278, p<0.001). There were significant correlations between KVA and FVA at 40 and 60 km/h under both binocular and monocular conditions (figure 1). BUT was not correlated with KVA at any speed. The results of multiple regression analysis between KVA and visual parameters are shown in table 4. The correlation between KVA and FVA in the non-dominant eye (R=0.493, p<0.001) was stronger than for BCVA in the dominant eye (R=0.242, p<0.001). The results of the analysis of factors affecting KVA using a linear mixed-effects model are shown in table 5. The standardised regression coefficient for binocularity was significant at all speeds and that of FVA was significant at 60 km/h (figure 2).
Simple linear regression analysis of kinetic visual acuity

Scatterplot of KVA and FVA at each speed. There are significant correlations between KVA and FVA at 40 and 60 km/h: (A) Binocular, 20 km/h; (B) binocular, 40 km/h; (C) binocular, 60 km/h; (D) monocular, 20 km/h; (E) monocular, 40 km/h; (F) monocular, 60 km/h. FVA, functional visual acuity; KVA, kinetic visual acuity.
Multiple regression analysis of kinetic visual acuity
Linear mixed-effects model analysis results for factors affecting kinetic visual acuity

Standardised regression coefficient values for kinetic visual acuity, using a linear mixed-effects model. Binocularity was significant at all target speeds and FVA was significant at 60 km/h (*p<0.05, linear mixed-effects model). FVA, functional visual acuity.
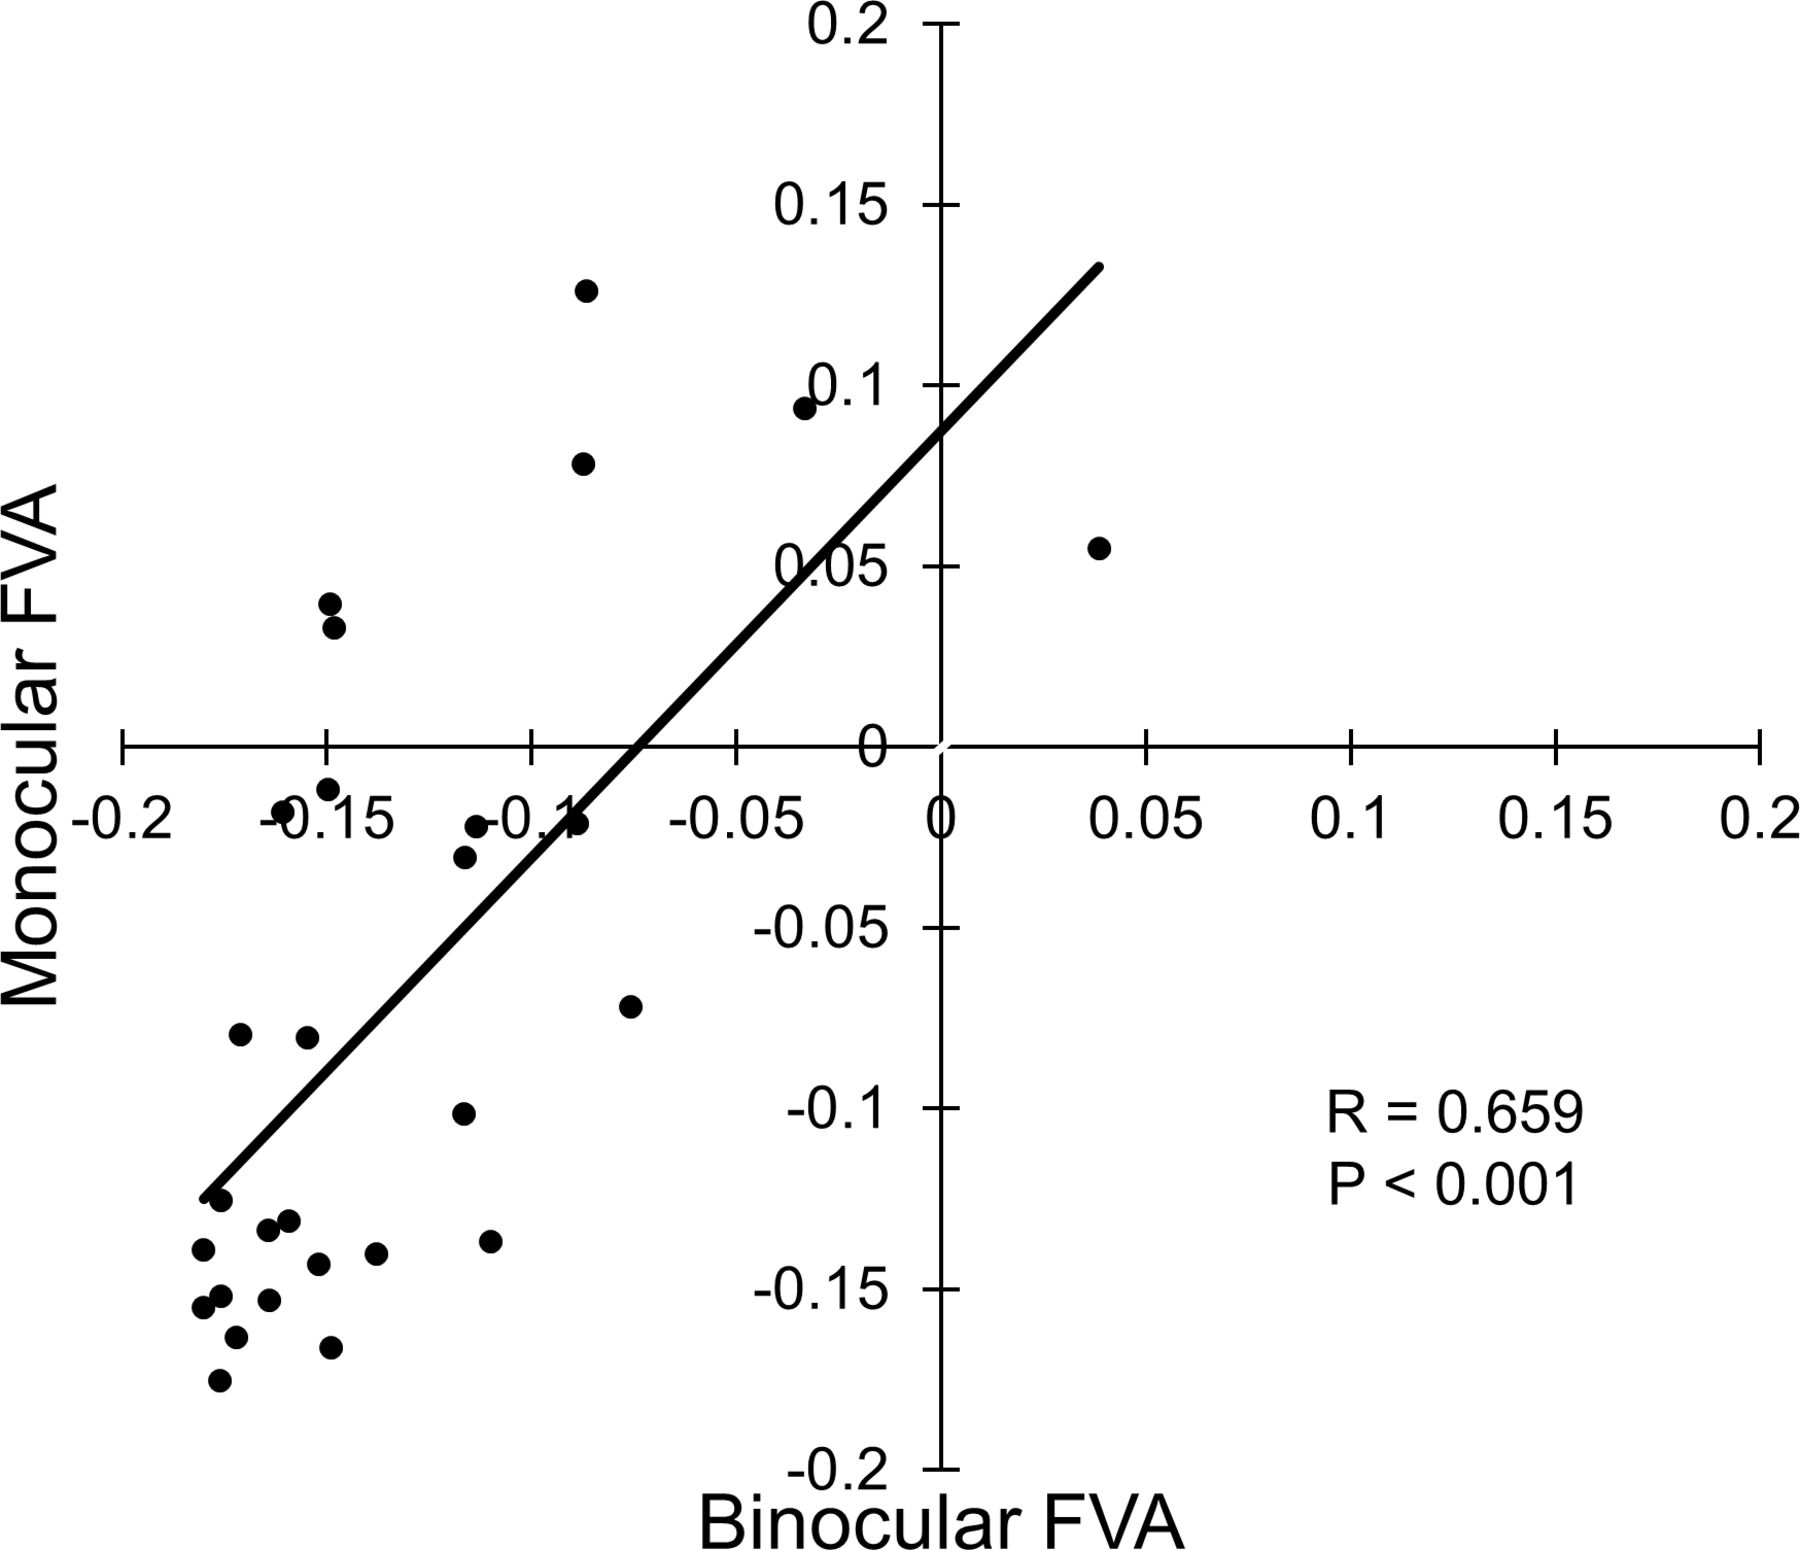
Binocular FVA (−0.13±0.05) was significantly better than monocular FVA (−0.07±0.09; Wilcoxon signed-rank tests, p<0.001), and a strong correlation existed between binocular and monocular FVA (R=0.659, p<0.001; figure 3).

Scatterplot of binocular and monocular FVA. Binocular FVA was better than monocular FVA (Wilcoxon signed-rank tests; p<0.001), and a strong correlation was found between the two parameters (R=0.659, p<0.001). FVA, functional visual acuity.
Discussion
The effects of binocularity and ocular parameters on KVA were evaluated and binocular FVA was correlated with KVA at higher speeds. It is speculated that both KVA and FVA are important for major integrated visual function working with continuous fixation. FVA may deteriorate in cataract, posterior capsule opacification, DE and age-related macular degeneration.23–28 These are treatable eye diseases and adequate ophthalmological treatments are recommended for drivers suffering these diseases to achieve the best possible visual performance. It is notable that FVA was more strongly correlated with KVA at a higher speed than age. Given that visual function is critical in driving, as well as physical mobility and recognition, vision care specialists and drivers should be aware that FVA provides the ability to keep seeing and focusing on objects.17
Although DE is a very common ocular surface disease and major cause of decreased FVA, which should be maintained in high-speed driving, the patients may be asymptomatic and diagnosed with symptoms as well as loss of homeostasis of the tear film.29 Visual disturbance in patients with DE may be due to a blurry optical image with increased aberration and scattering induced by an unstable tear film.30 31 Patients with DE may recognise their symptoms only as eye fatigue or presbyopia, so DE may be often overlooked.32 KVA was correlated more strongly with FVA than BCVA and previous investigation described a significant correlation between FVA and the useful field of view, which is related to the driver’s cognitive function; therefore, FVA is an important indicator for driving safety, whereas KVA is important in recognising pedestrians and other traffic circumstances.20 Based on the present results, the FVA examination could be recommended in the driving aptitude test, as currently, only BCVA is required in Japan. FVA can be screened by a user-friendly automated instrument on a self-check basis, as used in the present study.
Binocular KVA was better than monocular KVA as expected. Many studies investigating the effect of binocularity report that visual function, including VA, speed cognition and contrast sensitivity, improve with binocular summation.1–3 7–9 33–35 For example, the visual performance of Formula one drivers, for example, sense of speed and distance, improves with a binocular summation.35 The present results could provide additional evidence by showing the additive effects of binocularity in KVA and FVA. The present results also indicate that KVA is more strongly correlated with BCVA in the non-dominant eye than with BCVA in the dominant eye, suggesting that the non-dominant eye may significantly contribute to binocularity with appropriate refractive correction.
The limitations of the present study first include the small number of participants. Second, the significance of FVA should be confirmed with a larger number of patients with severe DE, before and after the intervention. Third, potential contribution with adaptation was not excluded in the verification of the superiority of binocular vision in the present study. Thus, it should be claimed as another limitation of our study as the results of the binocular test may be overestimated. Finally, the present results should be further evaluated in older people with impaired MMSE and visual function to predict the risk of motor accidents potentially caused by insufficient visual performance.
Conclusions
BCVA, KVA and FVA were strongly correlated with each other and FVA was contributory to KVA at high speed. The present results may be applicable for the evaluation of driving aptitude in diseased and older individuals.
References
Footnotes
II and KN contributed equally.
Contributors II: collected and analyzed the data. II and MA: wrote the manuscript. II and KN: designed the study. II, MA, KN and KT: interpreted the data for the work, reviewed and approved the final version of the manuscript.
Funding Hitachi Automotive Systems, Ltd.
Disclaimer II and KN work have been funded by Hitachi Automotive Systems, Ltd. KT has the patent (US patent No.7470026) of kinetic visual acuity meter (AS-4Fα).
Competing interests None declared.
Patient consent for publication Parental/guardian consent obtained.
Provenance and peer review Not commissioned; externally peer reviewed.
Data availability statement Data are available upon request