Article Text

Abstract
Background/aims To report alterations in visual acuity and visual pathway structure over an interval of 1–3 years in a cohort of children, adolescents and young adults who have Wolfram syndrome (WFS) and to describe the range of disease severity evident in patients with WFS whose ages differed by as much as 20 years at first examination.
Methods Annual, prospective ophthalmological examinations were performed in conjunction with retinal nerve fibre layer (RNFL) analysis. Diffusion tensor MRI-derived fractional anisotropy was used to assess the microstructural integrity of the optic radiations (OR FA).
Results Mean age of the 23 patients with WFS in the study was 13.8 years (range 5–25 years). Mean log minimum angle resolution visual acuity was 0.66 (20/91). RNFL thickness was subnormal in even the youngest patients with WFS. Average RNFL thickness in patients with WFS was 57±8 µ or ~40% thinner than that measured in normal (94±10 µ) children and adolescents (P<0.01). Lower OR FA correlated with worse visual acuity (P=0.006). Subsequent examinations showed declines (P<0.05) in visual acuity, RNFL thickness and OR FA at follow-up intervals of 12–36 months. However, a wide range of disease severity was evident across ages: some of the youngest patients at their first examination had deficits more severe than the oldest patients.
Conclusion The genetic mutation of WFS causes damage to both pregeniculate and postgeniculate regions of the visual pathway. The damage is progressive. The decline in visual pathway structure is accompanied by declines of visual function. Disease severity differs widely in individual patients and cannot be predicted from their age.
- child health (paediatrics)
- genetics
- optic nerve
- visual (cerebral) cortex
- visual pathway
- cosmesis
This is an Open Access article distributed in accordance with the Creative Commons Attribution Non Commercial (CC BY-NC 4.0) license, which permits others to distribute, remix, adapt, build upon this work non-commercially, and license their derivative works on different terms, provided the original work is properly cited and the use is non-commercial. See: http://creativecommons.org/licenses/by-nc/4.0/
Statistics from Altmetric.com
Key messages
What is known?
The hallmarks of Wolfram syndrome are bilateral optic atrophy, diabetes mellitus and deafness.
What are the new findings?
First report of follow-up of a large cohort of patients with Wolfram syndrome documenting longitudinal decline in visual acuity and retinal nerve fibre layer.
First report showing a correlation of subnormal visual acuity in Wolfram syndrome with structural abnormalities of the optic radiations.
How might these results change the focus of clinical practice?
Better appreciation of postgeniculate and pregeniculate visual neuropathy of Wolfram syndrome to use as markers in recently initiated pharmacological therapy trials.
Introduction
Wolfram syndrome (WFS), also known as DIDMOAD, was first described in 1938 by Wolfram and Wagener.1 It is a rare, autosomal recessive syndrome characterised by a cluster of symptoms including diabetes insipidus (DI), diabetes mellitus (DM), optic nerve atrophy (OA) and sensorineural deafness (D). WFS can result in a shortened lifespan.2 3 WFS is caused by mutations in the WFS1 or WFS2 genes (OMIM 222300). WFS1 encodes a transmembrane protein localised to the endoplasmic reticulum (ER) named wolframin, which plays a crucial role in maintaining ER homeostasis, including calcium regulation, redox regulation, ER stress signalling and cell death.4–8 WFS2 (also known as CISD2) encodes ER intermembrane small protein, which plays a role in ER calcium homeostasis.9 10 WFS is associated with lower volume of the brainstem as well as cerebellum and reduced myelination throughout the brain (Lugar et al; Hershey et al). WFS also damages afferent visual pathway neurons.11–14 The reason for the selective neuronal damage remains unclear.
The Washington University WFS Research Study has examined a cohort of children, adolescents and young adults longitudinally.14–18 Cognitive, neurological, audiological and ophthalmological measures are performed annually using standardised protocols, supplemented by magnetic resonance brain imaging (MRI). The current report describes how visual acuity, retinal nerve fibre layer (RNFL) thickness and the optic radiations of the geniculostriate cerebral visual pathways are affected at a cross-section of ages and longitudinally. A secondary goal was to show the wide range of disease severity evident in patients with WFS.
Subjects and methods
The 23 participants were recruited through the Washington University Wolfram Syndrome Registry website to participate in standardised evaluations across domains known to be associated with WFS at an annual Washington University WFS Research Clinic. Minimal diagnostic criteria to enrol in the registry are: (A) the diagnosis of insulin-dependent DM and optic atrophy by a physician before 18 years of age or (B) genetic confirmation of a WFS1 mutation. Informed consent from parents for minor participants or from adult participants was obtained prior to study enrolment.
Ophthalmic measures
A comprehensive quantitative ophthalmic examination was performed by one of the authors (JH or LT), including documentation of strabismus, nystagmus, binocular perception, pupillary function, slit lamp biomicroscopy and fundoscopic examination. These clinical measures were supplemented by laboratory testing of RNFL thickness, Humphrey Visual Field Analysis, colour vision and fundus photography as described in detail in a previous report.18 Here we confine the description to testing of visual acuity and RNFL thickness as measures of disease progression. Best-corrected distance logMAR visual acuity (CDVA) was recorded for each subject using Early Treatment Diabetic Retinopathy Study optotypes.19 RNFL thickness was measured by Optical Coherence Tomography (OCT, Zeiss CirrusHD-OCT, 4000–5444 version 4.5.1.11; Carl ZeissMeditec, Dublin, California, USA). Normative values for RNFL thickness were obtained from age-matched controls tested in our laboratory who had normal visual acuity and no neuroretinal abnormalities.
Diffusion tensor MRI (DT-MRI)
Scans were acquired in awake, unsedated patients on a Siemens 3T Tim Trio MRI scanner at Washington University. The DT-MRI echo planar sequence consisted of 27 directions with the b-values ranging from 0 s/mm2 to 1400 s/mm2. Transverse acquisition, TR=12 300, TE=108, voxel resolution=1.98×1.98 × 2 mm, time=5:44 min. DT-MRI optic radiation images were atlas transformed, and measures of white matter microstructural integrity (fractional anisotropy (FA)) were computed.20 21 Probabilistic tractography was performed using FMRIB’s Diffusion Toolbox. Masks for tractography were created using FSLView. To track the optic radiations, masks were placed bilaterally on the lateral geniculate nucleus and the striate cortex (area V1) calcarine sulcus, and probability distributions were generated between them. The resulting distributions were then thresholded at 1% to remove extraneous pathways and converted into binary masks for the purpose of extracting mean FA.
Statistical analysis
Variables were tested for normality using the Kolmogorov-Smirnov test. Measures were obtained for each eye. Visual deficits in WFS are generally symmetrical17 18; in the cohort reported here there were no significant differences between right and left eyes for CDVA (P=0.37) or RNFL thickness (P=0.46). To minimise comparisons and improve clarity in the results, we averaged by combining left and right values. Relationships between age, CDVA and RNFL measures were assessed using Pearson’s r. Ophthalmological and DT-MRI measures were compared using the related samples Wilcoxon signed rank test for small sample sizes. All analyses were performed employing Statistical Package for the Social Sciences software (SPSS V.22). A P value of <0.05 was considered significant.
Results
For the 23 patients included in this analysis, mean age was 13.8 years (range, 5–25 years); median 11.3 years, that is, half of the patients were <12 years of age. Sixty-five per cent (15) were female and 35% (8) were male. Seventy per cent (16) were Caucasian, 13% (3) were Hispanic and 17% (4) were mixed race. Average age at detection of visual impairment by an outside examiner before enrolment in the study was 9.1±4.2 years (range 3–17 years). The average time between vision impairment detection and enrolment in the study was 4.8±3.7 years. Impaired vision and optic disc pallor (96% of patients) were diagnosed when children were examined by an eye care provider after experiencing difficulty with visual tasks in elementary school. The prevalence of ophthalmic findings are listed in table 1. These rates are similar to those reported previously in a subset of this cohort.18
Prevalence of ophthalmic findings in the 23 patients with Wolfram syndrome
At entrance into the study, all 23 patients (100%) were able to cooperate for measurement of CDVA; RNFL measurement was achieved in 20 patients (87%), and DT-MRI scans of the optic radiations were obtained in 19 patients (83%). The combination of low-vision-related unsteady visual fixation, neurodevelopmental disability and/or immaturity prevented testing of the RNFL in three patients and contraindications for MRI (eg, cochlear implants and braces) precluded scanning in four patients. Table 2 shows the number of patients who have been enrolled for 1–3 years and thus the number retested at those intervals. About half of patients (11/23) have 3 years of CDVA test data available for longitudinal analysis (table 2).
Number of patients tested at entrance examination into the study and retested at annual follow-up intervals after entrance
Age-related trends for visual acuity, RNFL and optic radiation FA
Visual acuity (CDVA) as a function of WFS patient age is shown in figure 1. The CDVA at entrance examination is plotted for each of the 23 patients. Lines joining data points represent the CDVA obtained at annual follow-up examinations for individual patients. CDVA was a mean 20/91 (logMAR: 0.66), with a range of 20/25 to 20/40 000 (logMAR: 0.9–3.3). CDVA was 20/40 or worse in 91% of patients (21/23).

Visual acuity (logMAR units) versus patient age. Lines join sequential annual measures of individual patients with WFS. logMAR, log minimum angle resolution; WFS, Wolfram syndrome.
RNFL thickness is a measure of the health of anterior (pregeniculate) visual pathway axons; RNFL as a function of patient age is shown in figure 2. The RNFL thickness at entrance examination is plotted for 20 patients (20/23; three children could not perform the test reliably). Lines joining data points represent the CDVA obtained at annual follow-up examinations for individual patients. Seven of the 20 patients (35%) had one or more follow-up RNFL values that exceeded the entrance value (upward slope of the line joining values). It would be difficult to explain these upward deflections as true increases in RNFL thickness; they likely represent ‘noise’ inherent in measurement of RNFL in patients who have subnormal vision and fixation instability. RNFL thickness in patients with WFS (figure 3) averaged 57±8 µ, or 40% thinner than that measured in normal (94±10 µ) children and adolescents. The difference between mean RNFL thickness in WFS patients versus controls was significant (year 1, n=20, Z score=−4.30, P<0.01). RNFL thickness was not correlated with CDVA (r=– 0.07, P=0.70).

Retinal nerve fibre layer (RNFL) thickness versus age in patients with WFS (white dots) and in age-matched normal subjects (black dots). Lines join sequential annual measures of the same patient with WFS. WFS, Wolfram syndrome.

Retinal nerve fibre layer mean thickness for patients with WFS versus controls. WFS, Wolfram syndrome.
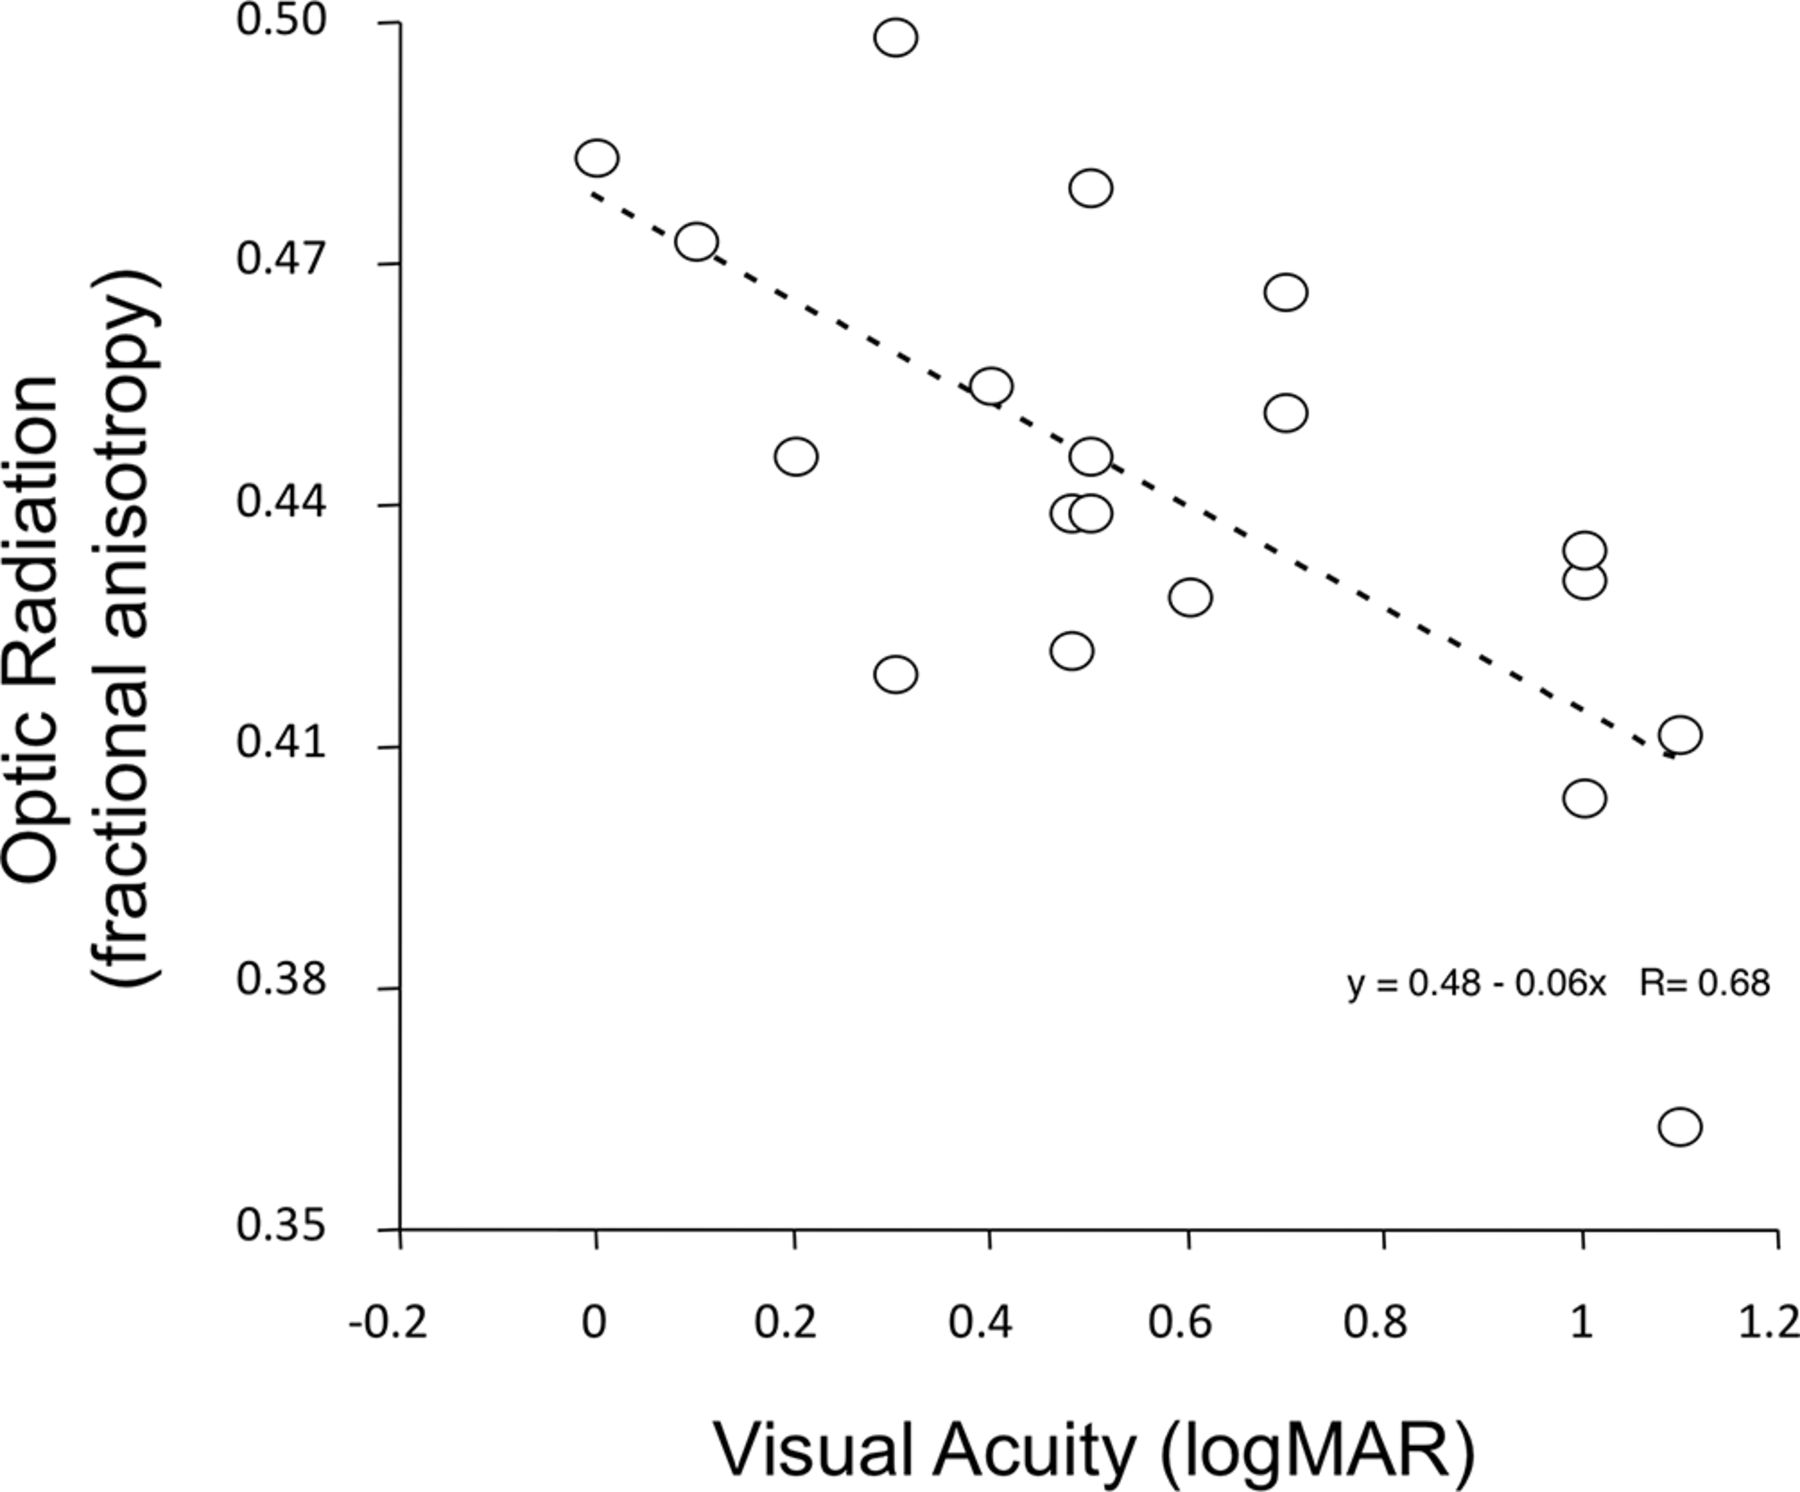
Optic radiation FA measures the health of posterior (postgeniculate) axons (figure 4). FA is a sensitive indicator of white matter injury22 and can detect damage even when standard MR images appear normal.23–27 In patients with WFS, lower optic radiation FA (figure 4) correlated strongly with worse CDVA (year 1, n=19, rs=−0.60, P=0.006).

Optic radiation fractional anisotropy versus visual acuity (logMAR units) in patients with WFS. Measures obtained at entrance examination. logMAR, log minimum angle resolution; WFS, Wolfram syndrome.
A downward trend is evident in the regression line of figure 1—worse CDVA at older age—and in the regression line of figure 2—thinner RNFL at older age. However, the data of both figures show a wide range of disease severity. Some young patients with WFS had poor CDVA and thin RNFL, whereas some older patients had comparatively good CDVA and thicker RNFL. The range of severity independent of age is evident in the fact that correlation with age was non-significant for CDVA (P=0.44), RNFL (P=0.11) and optic radiation FA (P=0.94).
In normal adults, thinner RNFL has been associated with older age, longer axial length (AL) of the eye and smaller optic disc area.28 AL was not measured in our patients so we used spherical refractive error as a proxy; hyperopic eyes tend to be shorter and myopic eyes tend to be longer. Neither age, refractive error nor disc area were correlated with thinner RNFL in our Wolfram cohort (age, P=0.44; spherical refractive error, P=0.13; optic disc area, P=0.39).
There were no significant differences between male and female patients with regard to entrance CDVA (P=0.71), RNFL thickness (P=0.36) or OR FA (P=0.65).
Comparison of entrance year measures to follow-up year measures
To assess disease progression, measures obtained at entrance were compared with measures obtained in successive annual follow-up examinations. Because patients in this longitudinal cohort study are enrolled as they are referred to our centre, patients enrolled earlier in the study have longer follow-up and those enrolled recently have shorter follow-up. Table 1 shows the number enrolled (23 patients) and the lower numbers measured at each year of follow-up.
In the 11 patients measured annually for 3 years, CDVA declined significantly from a mean logMAR 0.61±0.37 to logMAR 0.80±0.42 (Wilcoxon signed rank test, P<0.05). Over the same interval, RNFL thickness declined from an average 59±6 µ to 55±4 µ (P<0.05). Did patients with worse CDVA at the entrance examination and/or thinner RNFL thickness at entrance examination have greater rates of loss at follow-up examinations? To examine this issue, the slope of the loss was calculated for each patient and then correlated with the entrance values. The slopes did not correlate with the entrance values, that is, the most severely affected patients did not have steeper rates of loss (CDVA mean=0.05 logMAR/year, P=0.35; RNFL mean=−0.3 micron/year, P=0.54).
For OR FA, the decline from entrance (mean 0.45±0.03) to 1 year follow-up (0.43±0.03; 13 patients) was significant (P<0.05). Lower numbers of patients at the 2-year and 3-year follow-up (nine patients and six patients, respectively) likely account for non-significant statistical declines at the longer OR FA retesting intervals.
Discussion
The goal of the current study was to answer three questions. First, how does visual function and structure relate to patient age in WFS? Second, how widely does visual disease severity range in a sizeable cohort of WFS patients? Third, does visual function decline over time in WFS patients, for both pregeniculate regions of the visual pathway (RNFL) and postgeniculate regions (OR FA)?
Our results show that visual function and structure in WFS are related to patient age. Considering the cohort as a whole, younger patients tend to have better CDVA (figure 1) and RNFL thickness (figure 2) than older patients. All of the patients with WFS—from the youngest at age 5 years to the oldest at age 25 years at entrance into the study—had significantly thinner RNFL thickness than any of the age-matched control subjects (figure 2). However, the variation of disease severity within the WFS cohort is wide. Many younger patients have worse CDVA and a thinner RNFL than some older patients. In patients followed for 3 years, CDVA and RNFL declined significantly. Zmysloska et al reported recently also decline of RNFL in patients with WFS followed on average 22 months.29
OR FA in patients with WFS has been shown to be reduced significantly compared with both age-matched healthy and diabetic controls14 (diabetic controls are necessary because DM is one of the diagnostic criteria for WFS and DM can impair brain function and structure).27 30–33 OR FA is a sensitive indicator of postlateral geniculate nucleus visual axon health and myelination.22 26 FA measures the movement of water within and parallel to neuronal axonal fibres. In normal children and adolescents, FA increases with age.34 When axons or myelin are damaged, FA can decrease.23 Previous analyses have found that OR FA is lower in patients with WFS than in controls.35 We found a significant correlation between optic radiation FA and CDVA in our WFS patients (figure 4). Lower OR FA was associated with lower CDVA. Taken together, these results indicate damage to pregeniculate (RNFL) and postgeniculate visual axons (OR FA) in WFS. The results allow better appreciation of the postgeniculate and pregeniculate visual neuropathy of WFS. These functional and structural tests may be helpful as outcome measures in future therapeutic trials.
In previous reports of entrance examination findings in a portion of this WFS cohort, the phenotypic characteristics were catalogued.17 18 The visual characteristics included subnormal CDVA, impaired colour vision, visual field deficits, vision loss-related nystagmus, strabismus, afferent pupillary defects and optic nerve head pallor. A previous report of neuroimaging compared a portion of this WFS cohort to age-matched controls.14 That report documented that WFS patients have reduced brainstem (midbrain; pons) and cerebellar volumes at early ages. The reduction of RNFL thickness, OR FA, brainstem and cerebellar volumes at even the earliest ages imply that the brain abnormalities of WFS are both neurodevelopmental and neurodegenerative. The WFS1 mutations may cause hypoplasia of neurons and their axonal projections, as well as gradual atrophy of neurons. The current study documents that the neuronal damage—while variable across patients with WFS—encompasses the anterior as well as the posterior visual pathway and worsens with age.
Acknowledgments
We thank the Washington University Wolfram Syndrome Research Group (P Austin, MD (Surgery); B Beato, BA (Psychiatry); E Bihun, MA (Psychiatry); A Bischoff, BA (Psychiatry); G Earhart, PhD (Physical Therapy); S Eisenstein, PhD (Psychiatry); J Hoekel, DO (Ophthalmology); R Karzon, PhD (Audiology & Comm. Sciences); A Licis, MD (Neurology); H Lugar, MA (Psychiatry); L Manwaring, MS (Pediatrics); A R Paciorkowski, MD (Neurology, URMC); Y Pepino de Gruev, PhD (Medicine); A Permutt, MD (Medicine) (deceased); K Pickett, PhD (Physical Therapy, U Wisconsin); A Reiersen, MD (Psychiatry); J Rutlin, BS (Psychiatry); J Shimony, MD, PhD (Radiology); L Tychsen, MD (Ophthalmology); F Urano, MD, PhD (Medicine) – International Wolfram Registry Director); A Viehoever, MD (Neurology – UCSF); J Wasson, MS (Medicine) (deceased); N H White, MD, CDE (Pediatrics)) for their contributions to the larger study and the patients and their families for their participation in this research.
References
Footnotes
Contributors JH designed and executed the ophthalmological work, including interpretation and analysis. LT designed, analysed, interpreted, wrote and revised the manuscript; he is responsible for overall content. TH designed the parent study on Wolfram syndrome (HD070855), directed the neuroimaging data collection, analysis and interpretation and assisted in manuscript writing. AN prepared and analysed data used in this manuscript. AA-L assisted in data analysis and manuscript planning. HL and JR designed, analysed and interpreted the neuroimaging data.
Funding This work was supported by the NICHD (HD070855; Hershey, PI) and supported by CTSA (UL1 RR024992) and Diabetes Research Center (DK 020579), the Jack and JT Snow Foundation, American Diabetes Association (Permutt/Urano), the George Decker and Julio V Santiago Pediatric Diabetes Research Fund.
Competing interests None declared.
Ethics approval The study was approved by the Institutional Review Board of Washington University in St. Louis.
Provenance and peer review Not commissioned; externally peer reviewed.